Performance Management
Part 1 Chapter 2
The goal of performance management is to address problem before customers complain. If you can’t detect the problem before customers do, then you don’t have performance management in place. The word manage implies proactive. Passively waiting for an alert or complaint to trigger the troubleshooting process is not performance management. Proactivity requires regular cadence to prevent the problem. This cadence requires an internal threshold that is more stringent than the external, formally agreed SLA.
A Day in the Life of a Cloud Admin
Here is a common story often told in the virtualization community, which will resonate with you as an IaaS provider.
A VM Owner complains to you that her VM is slow. It was not slow yesterday. Her application architect and lead developer have verified that:
-
The VM CPU and RAM utilization did not increase and are within a healthy range.
-
The application team has verified that CPU Run Queue is also in the healthy range.
-
The disk latency is good. It is below 5 milliseconds.
-
There are no network packets loss.
-
No change in the application settings. In fact, the application has not had any changes in the past month.
-
No recent patches were installed into Windows.
-
There was no reboot. It has been running fine for weeks prior to this issue.
She said your VMware environment is a shared environment, and perhaps an increase in the number of VMs and an increase in the workload of other VMs are straining your IaaS.
She also said that her other VM, which was P2V recently, was performing much faster in physical.
If you think she is saying it’s your fault, you are right!
What do you do?
It is certainly a difficult situation to be in. You oversee more than 10,000 VMs. You have successfully consolidated them into 500 ESXi Hosts, saving the company 9500 servers, not to mention a lot of money. You built your reputation during the process, so this is not just a matter of her VM not performing. Your reputation is at stake here.
You also recall that your team has been adding new VMs regularly over the past several months so she could be right about the increasing number of VMs straining the IaaS platform. In addition, there have been several soft errors in your network and storage, and your team has been investigating for weeks. But why did she say it only happened today, but not yesterday or a few days ago?
It’s a hard question. To answer it, we need to take a step back and elaborate. Let’s dive in!
The 3 Realms
In the big picture, there are 3 realms of IT in business. Each realm has its own set of teams. Each team has a set of unique responsibility and hence skills required. The following diagram outlines the 3 realms, alongside with typical layers within each realm and questions being asked.
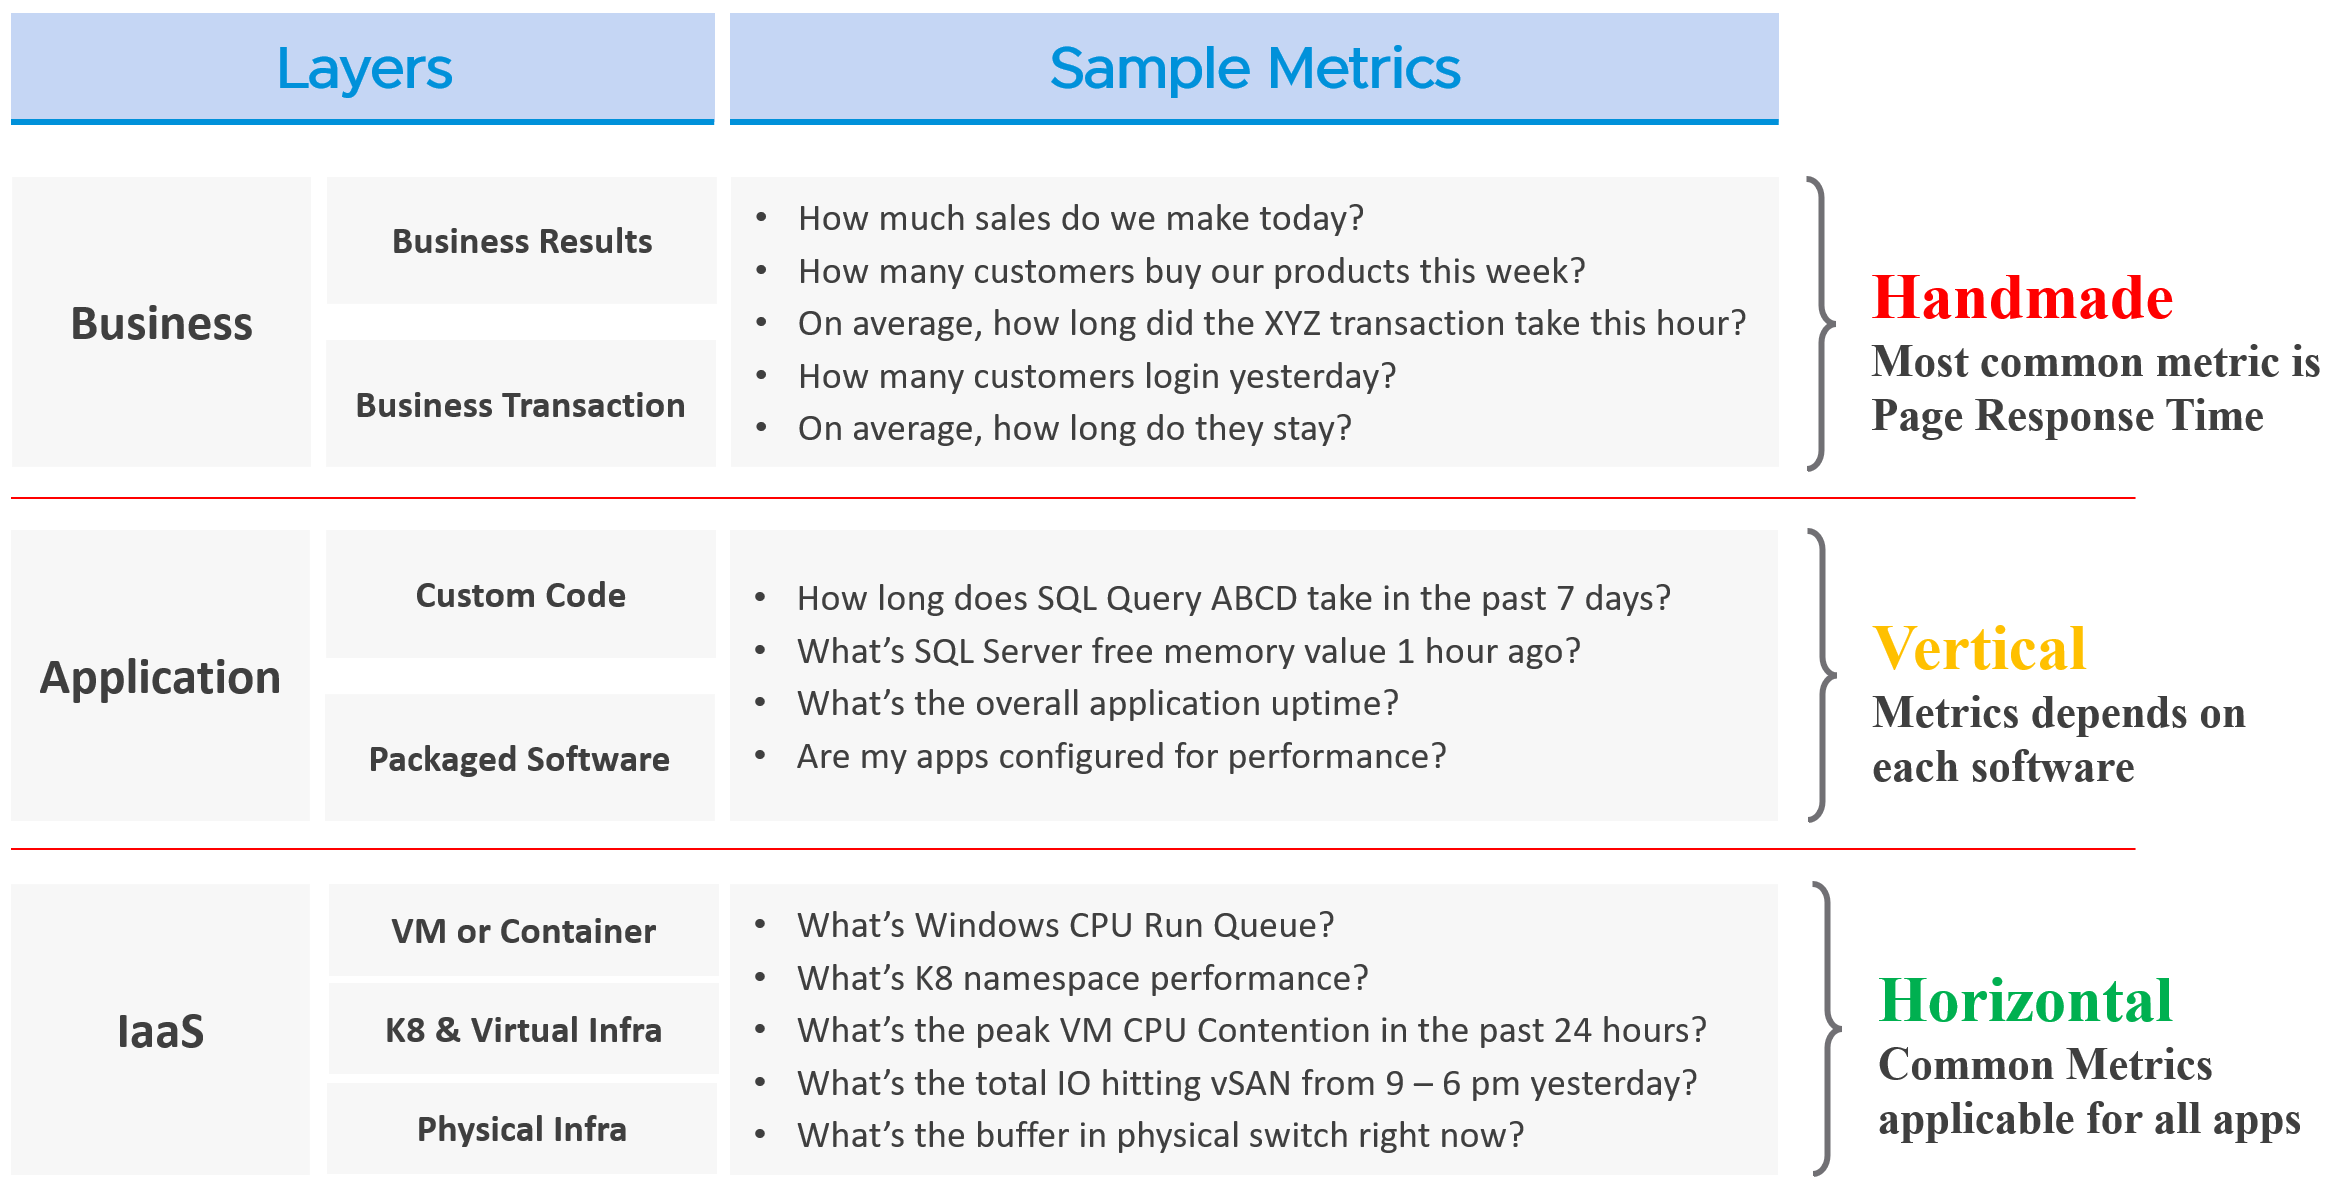
The fight typically happens between application team and infrastructure team, as both are IT. The business folks are real consumers or end users and not technical enough to provide solutions.
By the way, for those who use enterprise architecture framework, the 3 realms above actually map to TOGAF[^9] by The Open Group.
-
Business maps to Business Architecture
-
Application maps to Information Systems Architecture
-
IaaS maps to Technology Architecture
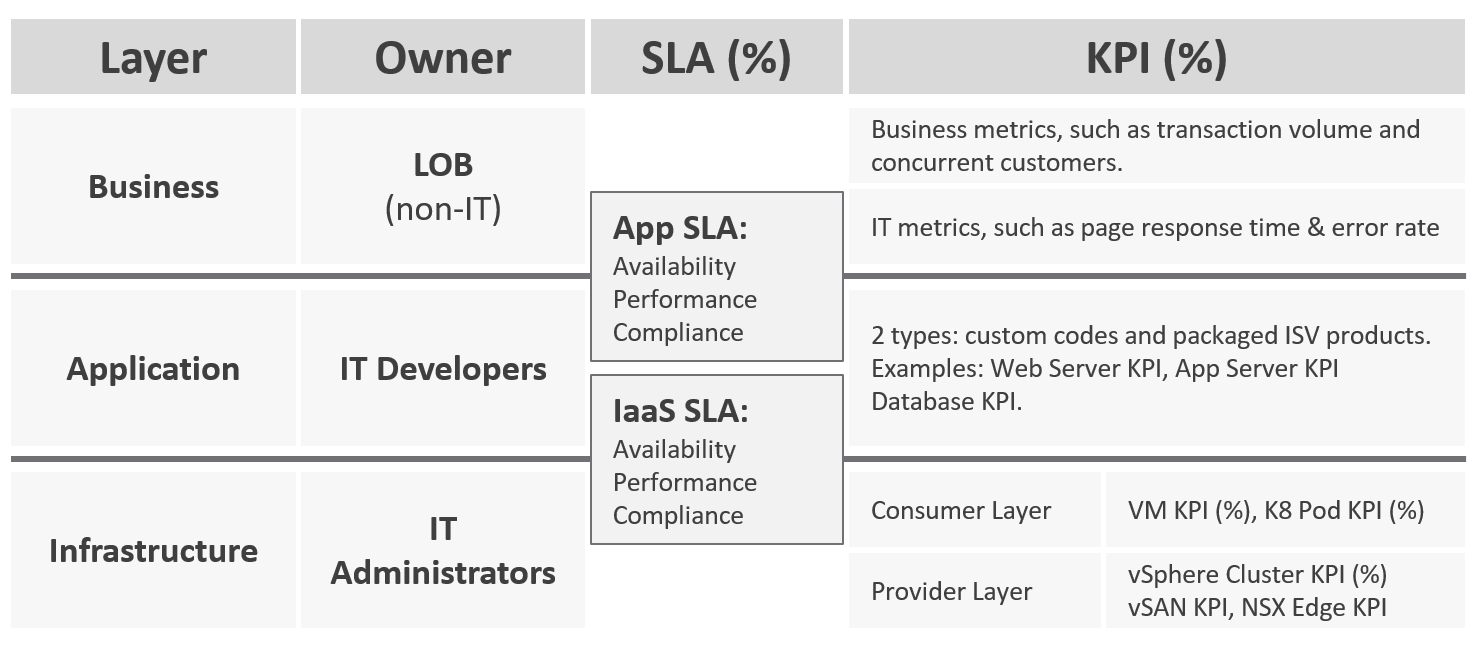
Each team need to have their own KPIs, and there must be SLAs between them.
| Layer | Owner | Observability |
| Business | Non-IT (specific departments owning the business functions, such as Internet Banking) | Service Response Time. This is business-function specific. For example, if it’s an eCommerce website, a good example of function is the payment for a shopping cart. |
| Application | IT (Application Team) | It depends on the application software and codes. Typically requires agents with specific knowledge of that application, as it has unique metrics. As a result, it is not possible to develop a generic KPI. |
| Infrastructure | IT (Infrastructure Team) | It’s possible to develop a universal KPI that works on all applications as it’s basically about CPU, memory, disk, and network. This is the focus of our work. |
While businesses run on IT, not all business KPIs depend on IT. Some depends on marketing, pricing strategy, and what your competitors are doing. Take an ecommerce portal: its top business KPIs probably involve revenue and gross profit. As you can imagine, if your competitors are doing a massive discount, you may not be able to achieve your sales and profit target.
That means there are 2 types of business KPIs:
-
Metrics based on IT software.
-
Metrics not based on IT software.
Examples for the ones relying on IT are business transactions (e.g. buy a product, update personal information, transfer fund) that are provided by the IT system. They can be online (real time, a user is waiting) or batch (runs in the background) in nature. They can be user to system, or system to system. Online transactions are often measured in time taken to process a single transaction (typically less than a few seconds) and is called Online Transaction Processing (OLTP). Batch transactions are often measured in time taken to process many transactions (which can be hours).
As you can imagine, different transactions require different amount of time. Even the same kind of transaction (e.g. generating a report), can vary as it depends on the amount of data or records. As an application architect, it’s important to define the expected time taken to complete commonly used business transactions. Obscured business transactions that are rarely used can be given low priority. However, this effort is not scalable if you have hundreds of business applications.
If you want universal metrics for all business applications, then page response time and error returns are the only metrics. I like the principle behind apdex, but not its implementation. Happy to share an improved formula if you are interested.
Performance troubleshooting is largely an exercise in elimination. The methodology slices each layer and determines if that layer is causing the performance problem. Hence it is imperative to have a single metric to indicate if a particular layer is performing or not. This primary metric is aptly named Key Performance Indicator.
Higher layers depend on the layers below, and hence the infrastructure layer is typically the source of contention. As a result, focus on the bottom layer first, as it serves as the foundation for the layer above. The good part is this layer is typically a horizontal layer, providing a set of generic infrastructure services, regardless of what business applications are running on it.
Now, we don’t know the impact to the application when there is latency in the infrastructure. That depends on the application. Even on the same identical software, e.g. SQL Server 2019, the impact may differ as it depends on how you use that software. Different natures of business workload (e.g. batch vs OLTP) get impacted differently even on the identical version of the software.
The Layers in IT Systems
To continue the discussion of layers in IT systems, the following example of an IT system shows 5 layers. The challenge in performance troubleshooting is the layers may not share context. Depending on the application and infrastructure architecture, there could be more layers.
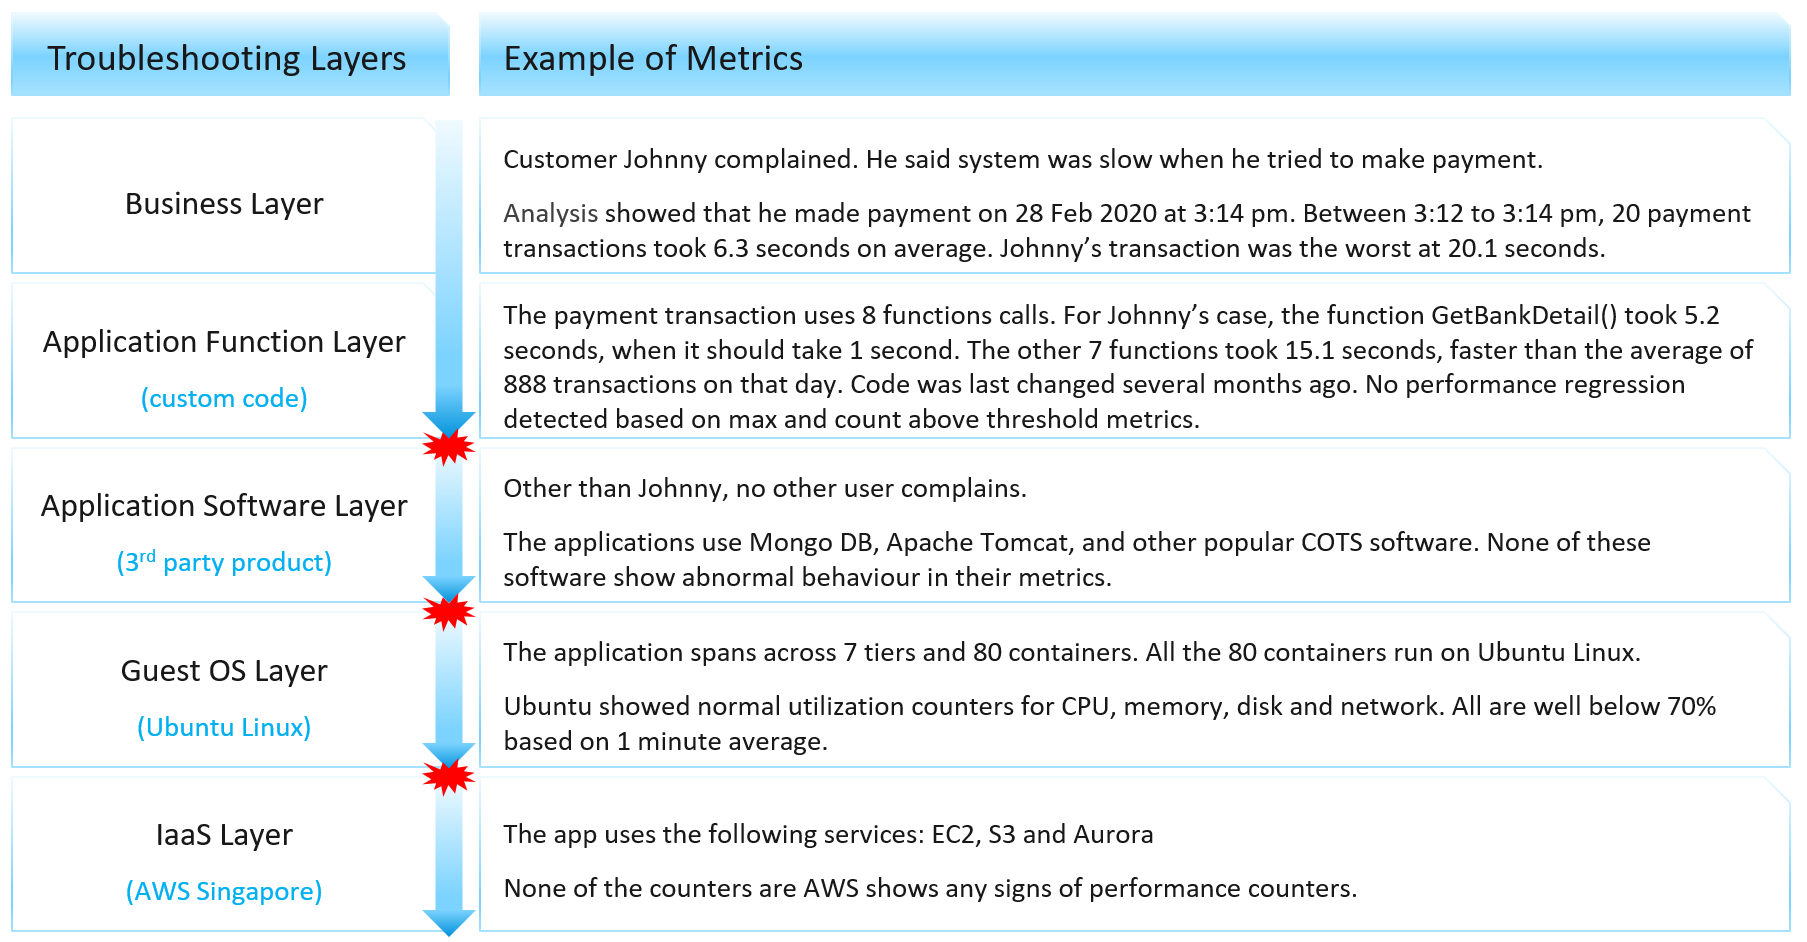
Using the example above, we can demonstrate how the lack of visibility is making troubleshooting virtually impossible. Let’s run through the hypothetical example depicted above. The story starts with a complaint as that resonates better.
At the Business Layer, you can see the performance of each business transaction. You not only know which user was affected, you also know what transaction was affected as the metric has transaction ID. You can trace it in the code as you know how long each function calls take place, assuming you log for every single transaction.
The problem starts when you move beyond your code and into Commercial of the Shelf (COTS) software. The software may show that its queue is 10000, which is 5000 more than what the manual say it can handle. But you have no idea if the user’s transaction was in that queue or not. The COTS software metrics do not relate to users anymore, let alone individual transactions. The red explosive icon marks where context is lost.
Moving from application to infrastructure resulted in another loss of context. Windows or Linux has no idea what applications you’re running. As far as the OS is concerned, every application is just a process. It will report basic CPU, Memory, Disk and Network utilization per process. More advanced metrics are reported at OS-level, system wide. For example, you do not know if your process was the one experiencing network packet loss. The packet loss metric is a system-wide metric.
Moving from individual EC2 or VM to the shared infrastructure results in another loss of context. In the case of public cloud, you may not get visibility into the physical layers at all.
The Layers in IaaS
Let’s apply the layers to IaaS.
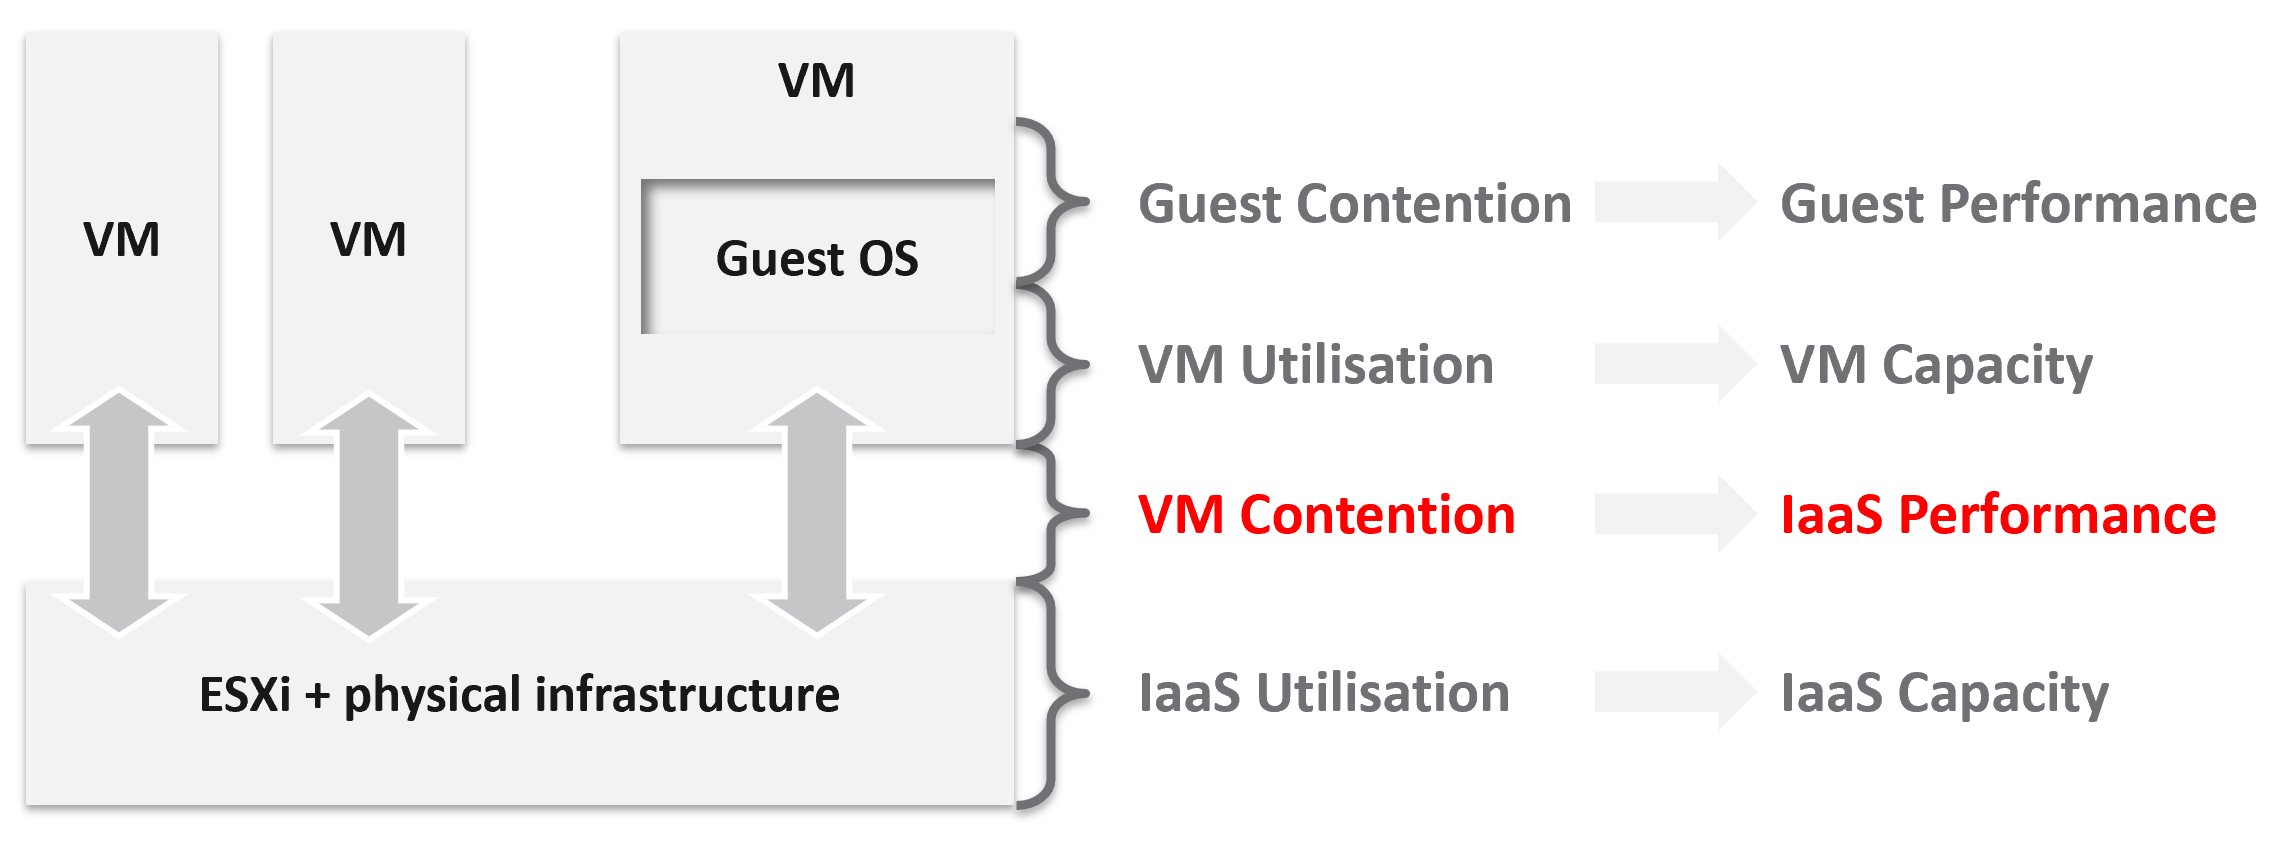
The 1st level is Guest OS contention. This is beyond the control of the IaaS platform. It’s completely up to each Guest OS to manage their given resources.
The 2nd level is useful for tracking VM capacity. Say a VM is given 8 vCPU. If you want to know if it’s using it, this is the area where you measure it. Whether you measure it In-guest or at the VM level, it depends on the specific use case because each layer lacks visibility into the other.
The 3rd level is where the VM meets the provider. This is where you track whether the IaaS platform is serving the VM well.
The 4th level is the underlying IaaS platform. This level is irrelevant to the VM Owner. This is normally the domain of the capacity planners and the troubleshooting specialists.
Let’s drill down further, breaking the layers more.
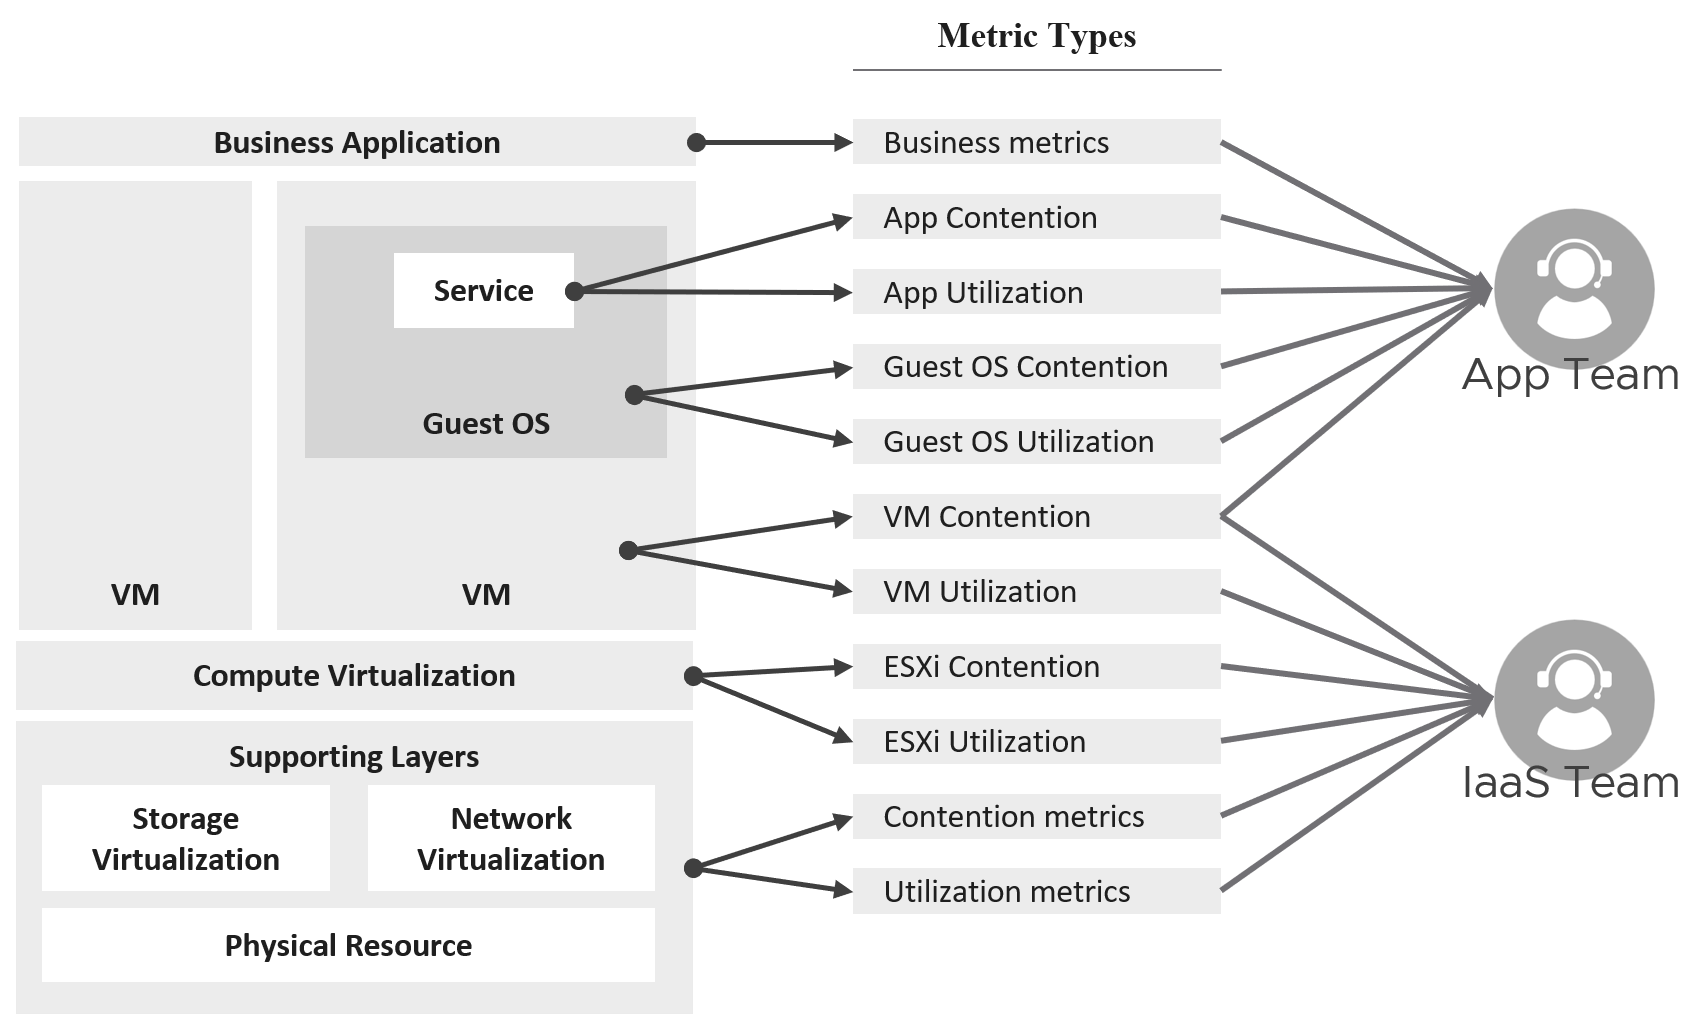
IaaS Metric Types
Broadly speaking, there are two categories of metrics we are interested in: consumer metrics, and provider metrics.
Consumer metrics consist of:
-
Business Applications: this could span multiple VMs, containers, and serverless functions. The metrics here are business metrics, not IT metrics. They are the best at measuring the application performance, but they can’t explain why it’s not performing,
-
Service: this is a process running inside Windows or Linux. We normally call this the application. An example is a database server.
-
Guest OS: there are two kinds of performance metrics; One at the Windows/Linux layer, and one at the driver layer (e.g. PVSCSI, vmxnet).
-
Container: this typically runs inside a VM. If there is more than 1 container in a VM, it makes operations management harder.
-
The Virtual Machines themselves.
Provider metrics consist of:
-
Compute virtualization, also known as the hypervisor. This is where the VM or container is running.
-
Storage and Network virtualization: they act as subsystem, supporting layer to the hypervisor. Ideally, they should have VM-level metrics, so you can trace how a single VM is performing deep into the storage and networking stack.
-
Physical resources: with hyperconverged, the only physical resources which are not already included in the categories above are basically network equipment due to their function as interconnects.
The following diagram captures the interrelationships between these metrics.
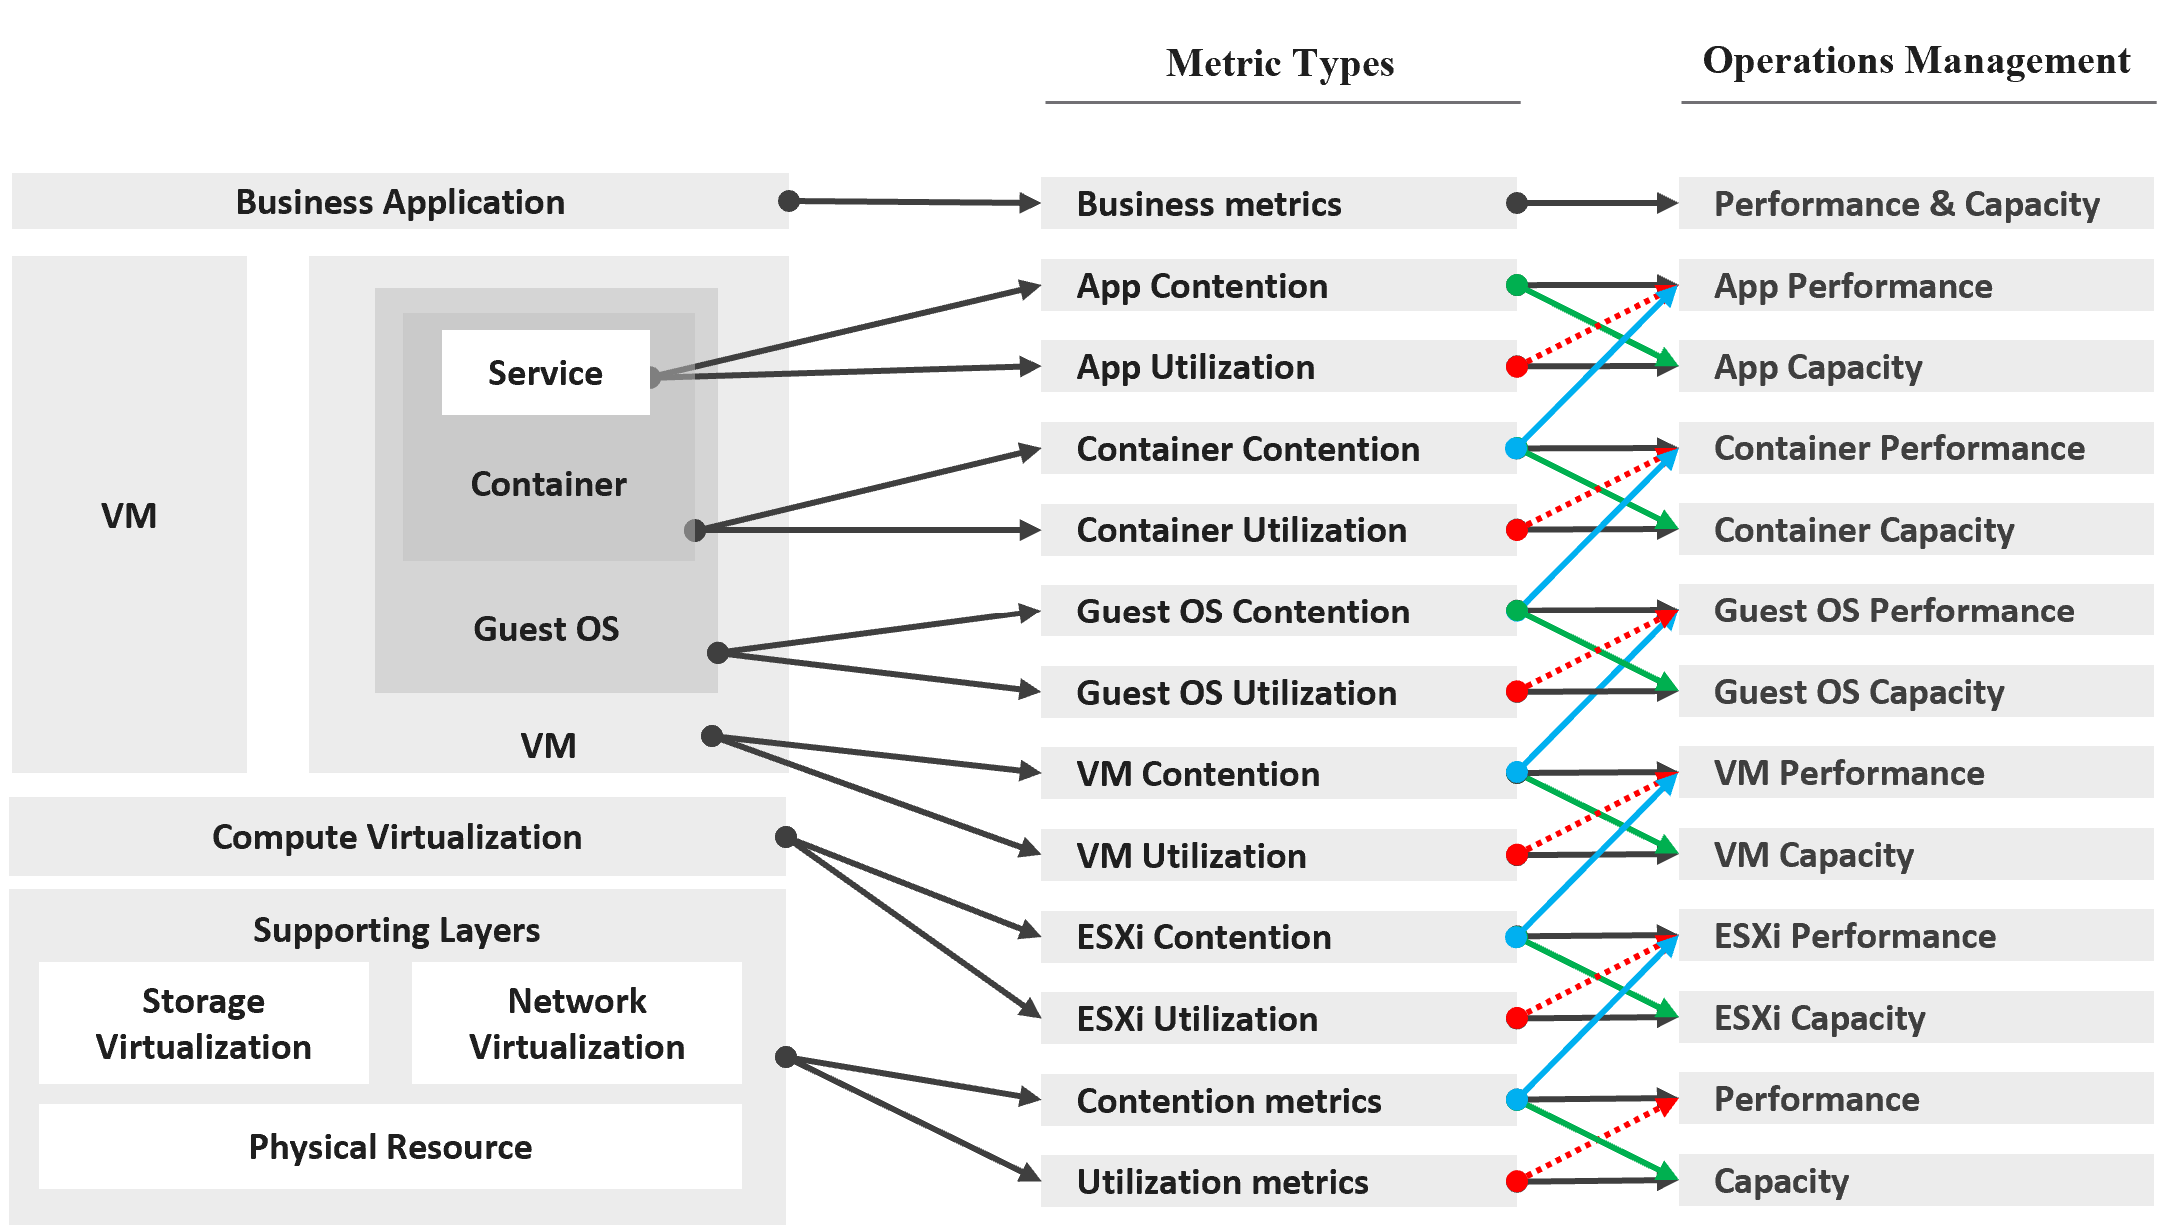
Notice how consumer and provider metrics are intertwined. A consumer contention metric becomes the performance metric for the provider.
Contention metrics are placed above utilization metrics as that’s what you should drive your operations. As Mark Achtemichuk said in this article, “drive by contention”. For each layer, you have a set of metrics. The black line indicates that contention is the primary counter for performance, and utilization is the primary metric for capacity.
| Green lines | show that contention metrics give valuable input to capacity metrics by showing how much additional capacity is required. For example, the number of queues in the CPU should be used to determine the amount of CPU to add. |
|----|----|
| Blue lines | show that contention in underlying layers directly impact performance in the layer above. For example, if a Guest OS experiences disk latency, the application will feel the impact. That can result in a ripple effect to the top layer. |
| Red lines | are not solid, as they’re highlighting a misconception. If contention = 0, then utilization at 100% is in fact maximum performance. If contention is not measurable, then add buffer to utilization as queue tends to develop at high utilization. |
On the other hand, you can have poor performance at low utilization. Many things can cause this as there are many possible configuration errors.
Optimized Performance
Optimized performance is difficult because the best performance is achieved when utilization/throughput is at 100%. This is when the most work is being done by the system overall. Running at that level requires a perfect level of mastery due to many dimensions of inter-dependencies. In addition, majority of loads have peaks so on average you could be well below 100% during idle periods.
| Type of Dependency | Description |
|----|----|
| Vertical | There are layers in the stack, and a problem in a lower layer can impact an upper layer. |
| Horizontal | The four elements of IaaS are not standalone. When CPU is paused, RAM & Disk will experience latency as time shifts as far as the Guest OS is concerned. |
| Flow | A problem in your NSX Edge VM on the NSX Edge Cluster can impact a business VM sitting on another cluster, because of the traffic flow. If you don’t understand the flow, you can waste time troubleshooting at the wrong place. |
| Version | There are valid reasons behind “What Works With What”. It’s a known problem that not all versions of all components work well together. Drivers, Firmware, etc. can cause interoperability problem, which can manifest itself as performance. |
Key Performance Indicator
In this book, my definition for KPI is strictly on performance, because the word performance has a specific meaning in enterprise IT. To me, KPI as a term does not apply to availability management and compliance management. We should call the key indicators that determine availability as KAI, and the key indicators that determine compliance as KCI[^10]. This prevents confusion as implementation-level solution requires us to be non-ambiguous with terminology. For a general overview of KPIs, Norman Dee has written a series of blog post starting here.
We’ve covered SLAs in-depth. They are complex to operationalize, especially the performance SLA.
Google VMware “performance SLA”, and you will find only a few relevant articles. The string performance SLA must be within a quote, as it is not “performance” and “SLA”, but “Performance SLA”. Yes, I’m after web pages with the words Performance SLA together. You will get many irrelevant results if you simply google VMware Performance SLA without the quotes.

I checked the first few dozen results. Other than my own articles, Google returned only a handful of relevant articles. The rest were not in fact relevant once you read them carefully. The relevant articles did mention Performance SLA, but did not define and quantify what a Performance SLA is. If something is not quantified, it is subjective. It’s hard to reach formal agreement with customers quickly and consistently when the line is not clearly drawn. If you have a disagreement with your customers, especially paying customers, guess who wins 😊
KPIs as a Stepping Stone
As an SLA is hard to vrealize, what can you do today?
You walk from where you stand. Adopt KPIs first as you don’t have to worry about classes of service. If you have different expectations set for Production and Non-Production VMs, then create a group for each. Create a super metric that averages the performance of each group. You should expect production VMs to have a better KPIs overall.
KPIs complement SLAs by providing the stepping-stone in your operations transformation. It is a necessary step towards operations with formal business SLAs.
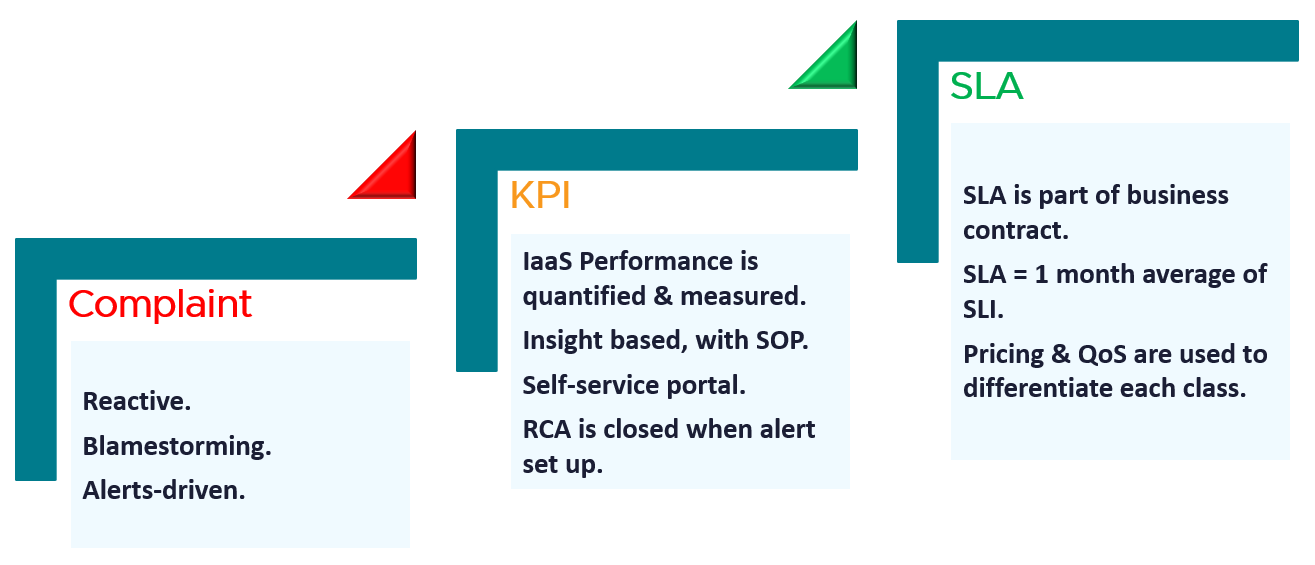
| Complaint | Metrics based on user complaints. Blamestorming among teams. Politics come into play. Alerts-driven, not insight driven. Reactive and firefighting. |
|---|---|
| KPI | Using both 20-second average and 5-minute average. Performance for both Consumer and Provider objects are quantified & measured. KPI includes Guest OS, if IT owns VM sizing. 1 common policy for all. No formal class of service defined. Performance is based on production environment. Insight based, with SOP. RCA is closed with alerts set up. Customers can track the SLA via self-service portal. |
| SLA | SLA is measured on 5-minute average. SLA = 1 month average of SLI of that specific month. SLA is part of business contract. 1 policy for each Class of Service. Pricing & QoS are used to differentiate each class. |
KPI | SLA
KPIs and SLAs work hand in hand.
KPIs are also better suited for when the infrastructure team takes ownership (and responsibility) for sizing the VM. Since sizing the VM basically means sizing the Guest OS resource, you’re now responsible for metrics at Windows and Linux level.
Regardless of SLAs, the main reasons for creating a KPI metric is ease of monitoring. A KPI is color coded. Metrics can be color coded like traffic lights (e.g. green, yellow, orange, red), so you can understand their indications and react faster. The goal is in fact to enable proactive remediation, before the situation degrades too far.
Differences
| KPI | SLA |
|---|---|
A single metric that quantifies the true performance of a logical entity. VM and Guest OS are 2 separate objects, but they are 1 logical entity due to 1:1 permanent relationship, hence they are combined in 1 KPI number. | A set of metrics written in the business contract between the service provider and service consumer. Typically, this is between the IaaS provider (the infrastructure team) and the IaaS consumer (the application team or business unit). What happens inside the Guest OS is not even relevant to the VM SLA. |
| Simple to operationalize. | Complex to operationalize. It needs Operations Transformation, much more than technical changes. You need to look at contract, price (not just cost), process, people, class of service, etc. |
| It tends to be absolute, as it’s reporting raw metrics | It is always relative, compared to an agreed threshold. |
Leading Indicator. 5-minute window. They are used as the starting point to troubleshoot, before user complaint | Lagging Indicator. 30 days backward looking, to be precise. You complement it with SLI, a 5-minute tracking indicator. If you breach, you’re talking penalty already. Typically it’s a credit for the next billing cycle as opposed to actual refund. |
20-second accuracy. It tracks at higher intensity, and it covers more metrics and events. | 5-minute accuracy. |
| Based on day (e.g. last 1 hour), which is moving as time passes. | Based on date (e.g. June 1972), which is a fixed period. |
Comprehensive coverage. Covers the SLA metrics, plus relevant additional metrics that provide early warning before the SLA metrics are breached. There are many KPI for a given SLA because not all metrics should be in the contract, while almost all performance metrics need to be monitored. | Limited. Only important metrics are included. Having too many metrics in SLA makes it harder to comply. Guest OS metrics should not be included as that’s part of “application KPI” or VM KPI, not IaaS SLA. They impact the VM performance, but nothing the IaaS can do, meaning the remediation is at the Guest OS layer. |
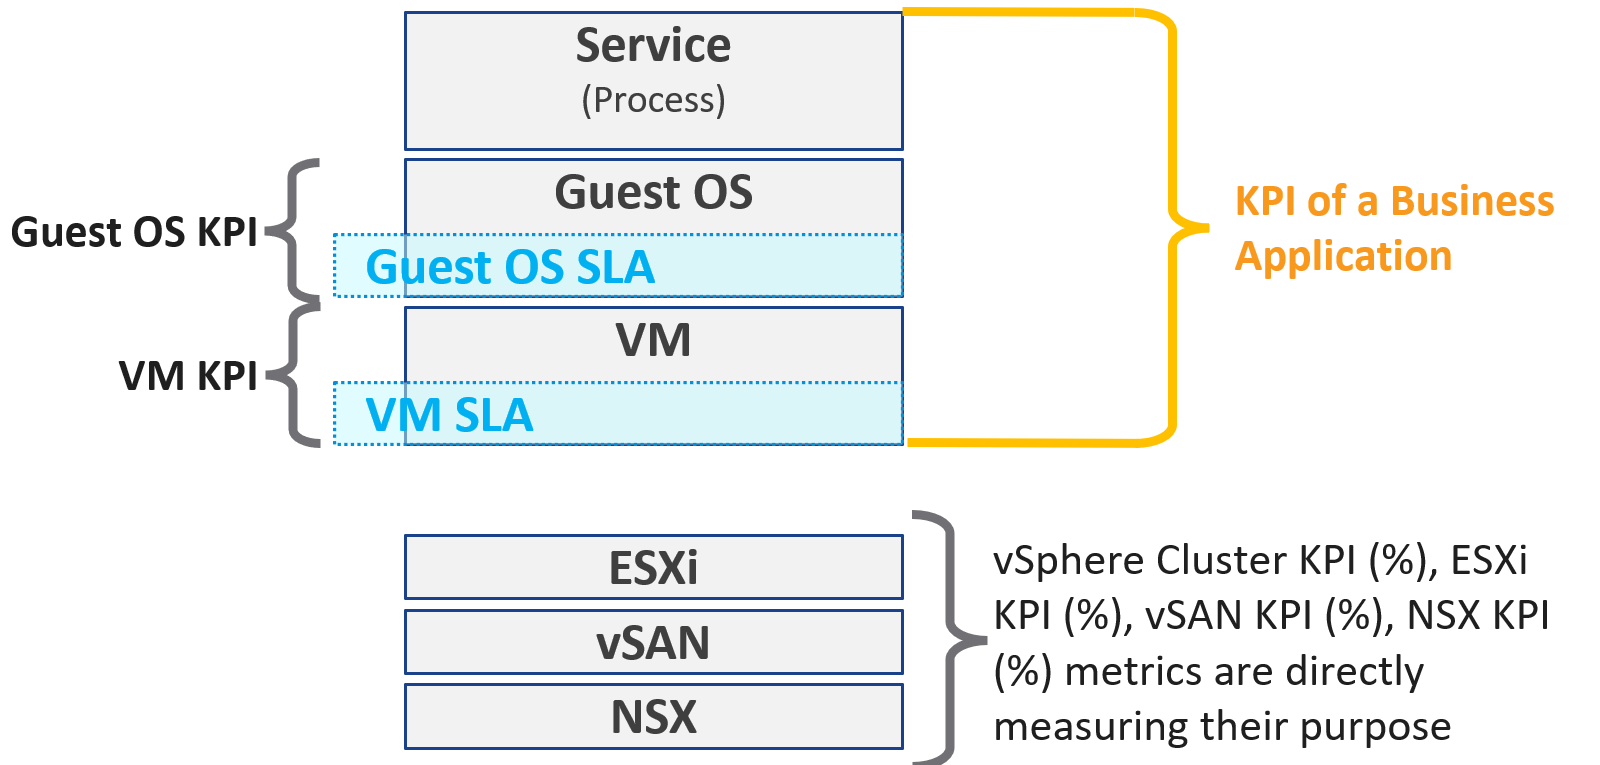
KPIs in IaaS
Within the context of VM as a Service, here are the KPIs and SLA.
Why are there more KPIs than SLAs?
There is only 1 SLA per service.
| VM KPI | It excludes the application or service running inside Guest OS as infrastructure team stops at Windows or Linux. |
|---|---|
| Business Application KPI | There are actually 3 levels of KPI. The highest and most important tracks the business transaction (e.g. user login). If the number is below expectation, you check for application software KPI (e.g. Apache web server) and infrastructure KPI (which is basically the VM KPI) |
| vSphere Cluster KPI | It includes only the contention metrics of the running VMs. The utilization metrics are excluded as that has no direct correlation to the cluster performance. If the cluster is running vSAN, then the KPI should include metrics measuring vSAN performance. |
| vSAN KPI | I do not add in the diagram to keep the diagram simple. vSAN KPI includes VM disk latency of all VM accessing the vSAN datastore (from the same vSphere cluster or from other cluster). |
| NSX KPI | I do not add in the diagram as it has a many to many relationship to vSphere cluster. |
Baseline Profiling
How do you determine what’s an acceptable performance by your customers? Is their expectation unrealistic (read: not impossible but costly to implement)? What’s the value of profiling your environment if the application team is unhappy with your service level?
Let’s look at 3 scenarios. The first 2 are corner cases, and the 3rd one is the most common, especially in large environment with many application teams.
| Happy | Unhappy | Mixed |
|----|----|----|
| If your application team is happy, then the profiling is a proactive exercise to ensure performance is maintained as your environment grow or change. | If your application team is not happy, then the profiling quantifies the complaints so they can be measured. It reveals the full picture as it analyzes the entire VMware environment, not just the complaints. | Likely, some are happy and while others are not. |
| This prevents infrastructure from being blamed for application-level changes. For example, if your database size grow, it can slow down the application. | It might prove the blame on infrastructure is not right, if the metrics are good. | In a large environment with many VM Owners, it’s common to see different owners have different threshold. A 10% CPU Ready may be fine for Owner A yet a 2.5% CPU Ready causes Owner B to be upset, even though both VMs are in the same class of service |
| It helps you establish the SLA while everyone is still happy. | It shows how bad the situation is, and how much improvement is needed. This can help in justifying additional capacity | Profiling brings up these facts to facilitate discussion to get everyone agree on the same SLA, because it’s a shared platform |
This is why education is important. As you have promised to serve everyone well, you need to have a threshold that works with 99% of your customers, and not 98%. While 99.9% is a better target, it’s also far more expensive.
Methodology
Now that we know the value and purpose, let’s discuss how to implement it. The following flowchart shows the overall process
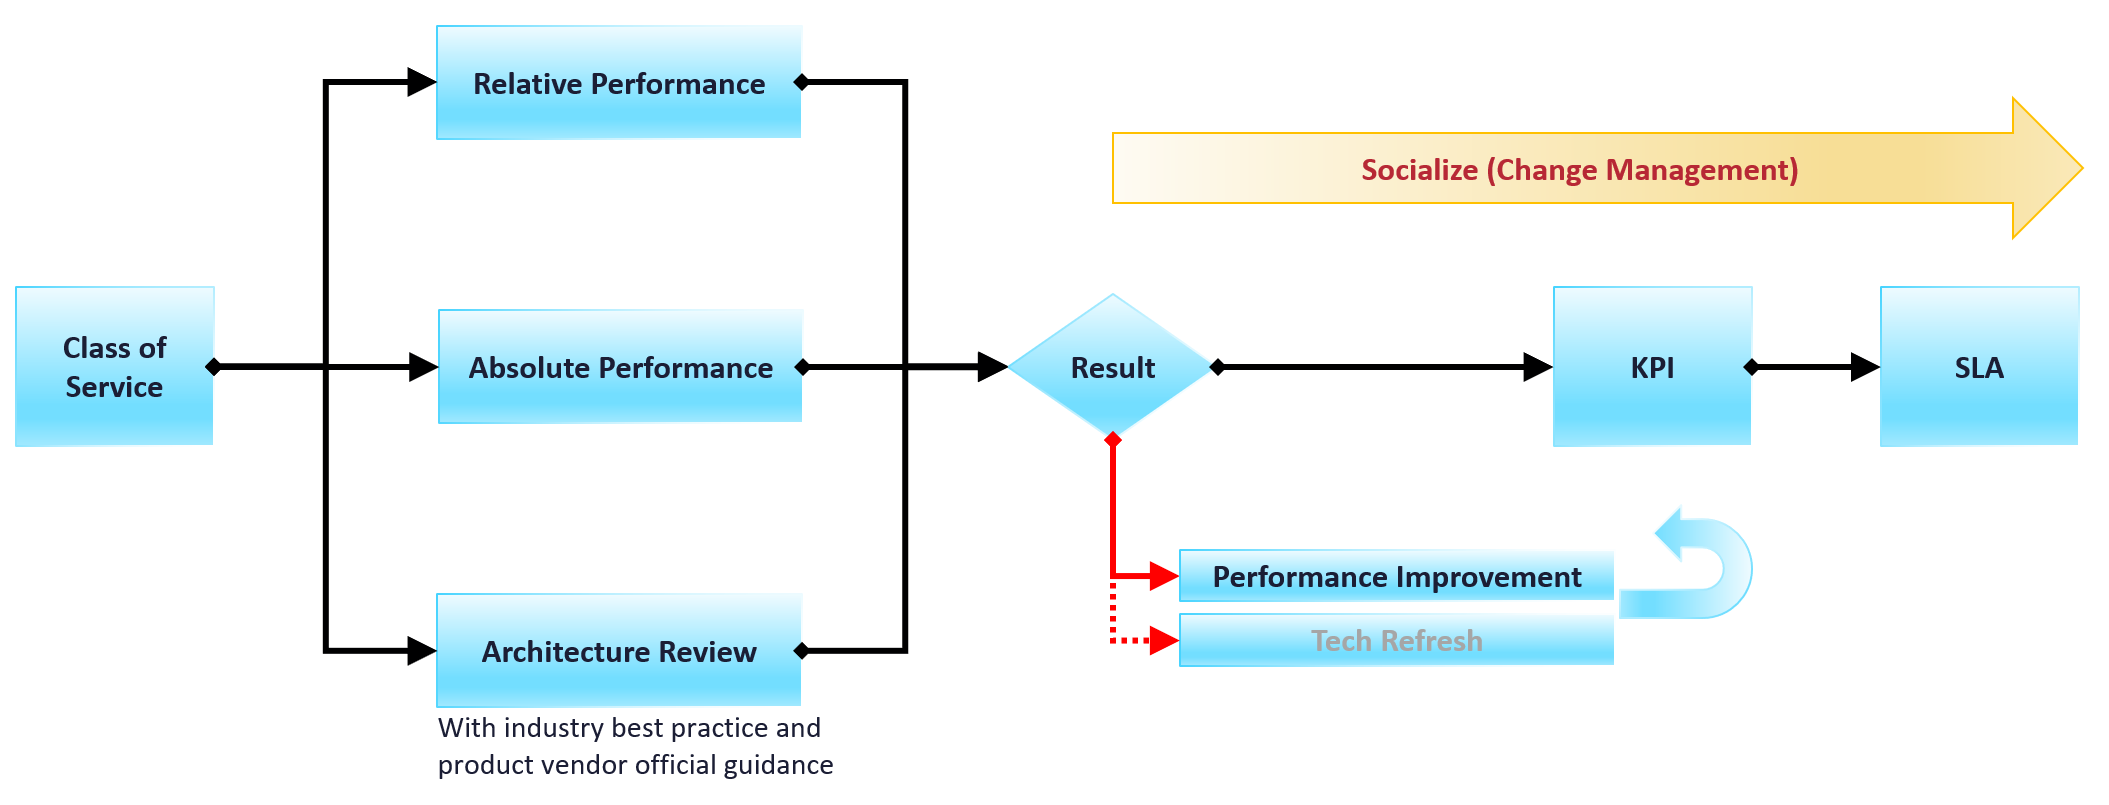
Do you have a performance SLA implemented?
If yes, that’s great!
-
Do you get complain from your customers? If yes, go back and follow the no performance SLA flow.
-
If there is no complaint, how is your actual SLA compared with your contractual SLA? The first one is what was actually delivered in your DC, while the contract is just a promise written on a piece of paper.
-
How is your promised SLA compared with industry best practices? If there is a room for improvement that both your customers want and your management supports, then it’s worth looking at the system and process to improve it. This may result in a technology refresh, reducing your cost while increasing both capability (availability, performance, capacity, and compliance).
If no, then how do you set? There are 3 factors to consider:
| Complaint | This gives the relative number, as complaint is subject to the person giving the complaint. Different people have different tolerance levels when it comes to how slow a system is. This is the most time-consuming, as most of the time there is neither data nor analyzis. You might have to interview the actual users one by one. In some political cases, you will need to get the business users, the application developers and the infrastructure team in a room or zoom. Compile the list of actual complaints. Analyze each complaint to ensure the problem is indeed with the infrastructure (and not application-level issue). If it is due to infrastructure, write down the actual metric or event that prove the problem. |
|---|---|
| Actual | This gives the absolute number, as it’s based on actual number. This number should be based on the 20-second peak, as the 5-minute average is not sufficient. |
| Best Practice | This comes from the makers of the product. For example, Microsoft has a guideline for disk latency for its SQL Server database |
2-level Profiling
Profile both “inside the VM” and “outside the VM”. The following diagram show the metrics of interest for each level.
Time Factor
You definitely need enough data points per VM. I recommend 1 – 3 months so you get at least the month end business cycle.
| Period | Data Points | 99th percentile |
|---|---|---|
| 1 hour | 12 | These are too short a timeline as there isn’t enough data points, or it will not capture monthly peak. |
| 1 day | 288 | |
| 1 week | 2016 | |
| 1 month | 8765 | What I recommend so habit it formed. |
| 3 months | 26298 | Too infrequent. You may forget. |
Taking the worst value of 8765 data points can result in outlier.
I recommend taking the 99th percentile. This eliminates the worst 87.65 data points per VM if you take 1 month’ worth of data. That means ignoring the worst 7.3 hours of the month. As this can be significant, that means the data cannot be ignored.
How about maintenance, upgrade, and other exceptional activities?
They should not take up 7+ hours per month.
Outcome
What are the possible outcomes of the analyzis? There are 1 – 4 action items you can do. The action “align with best practice” include configuration changes, design changes and version upgrade.
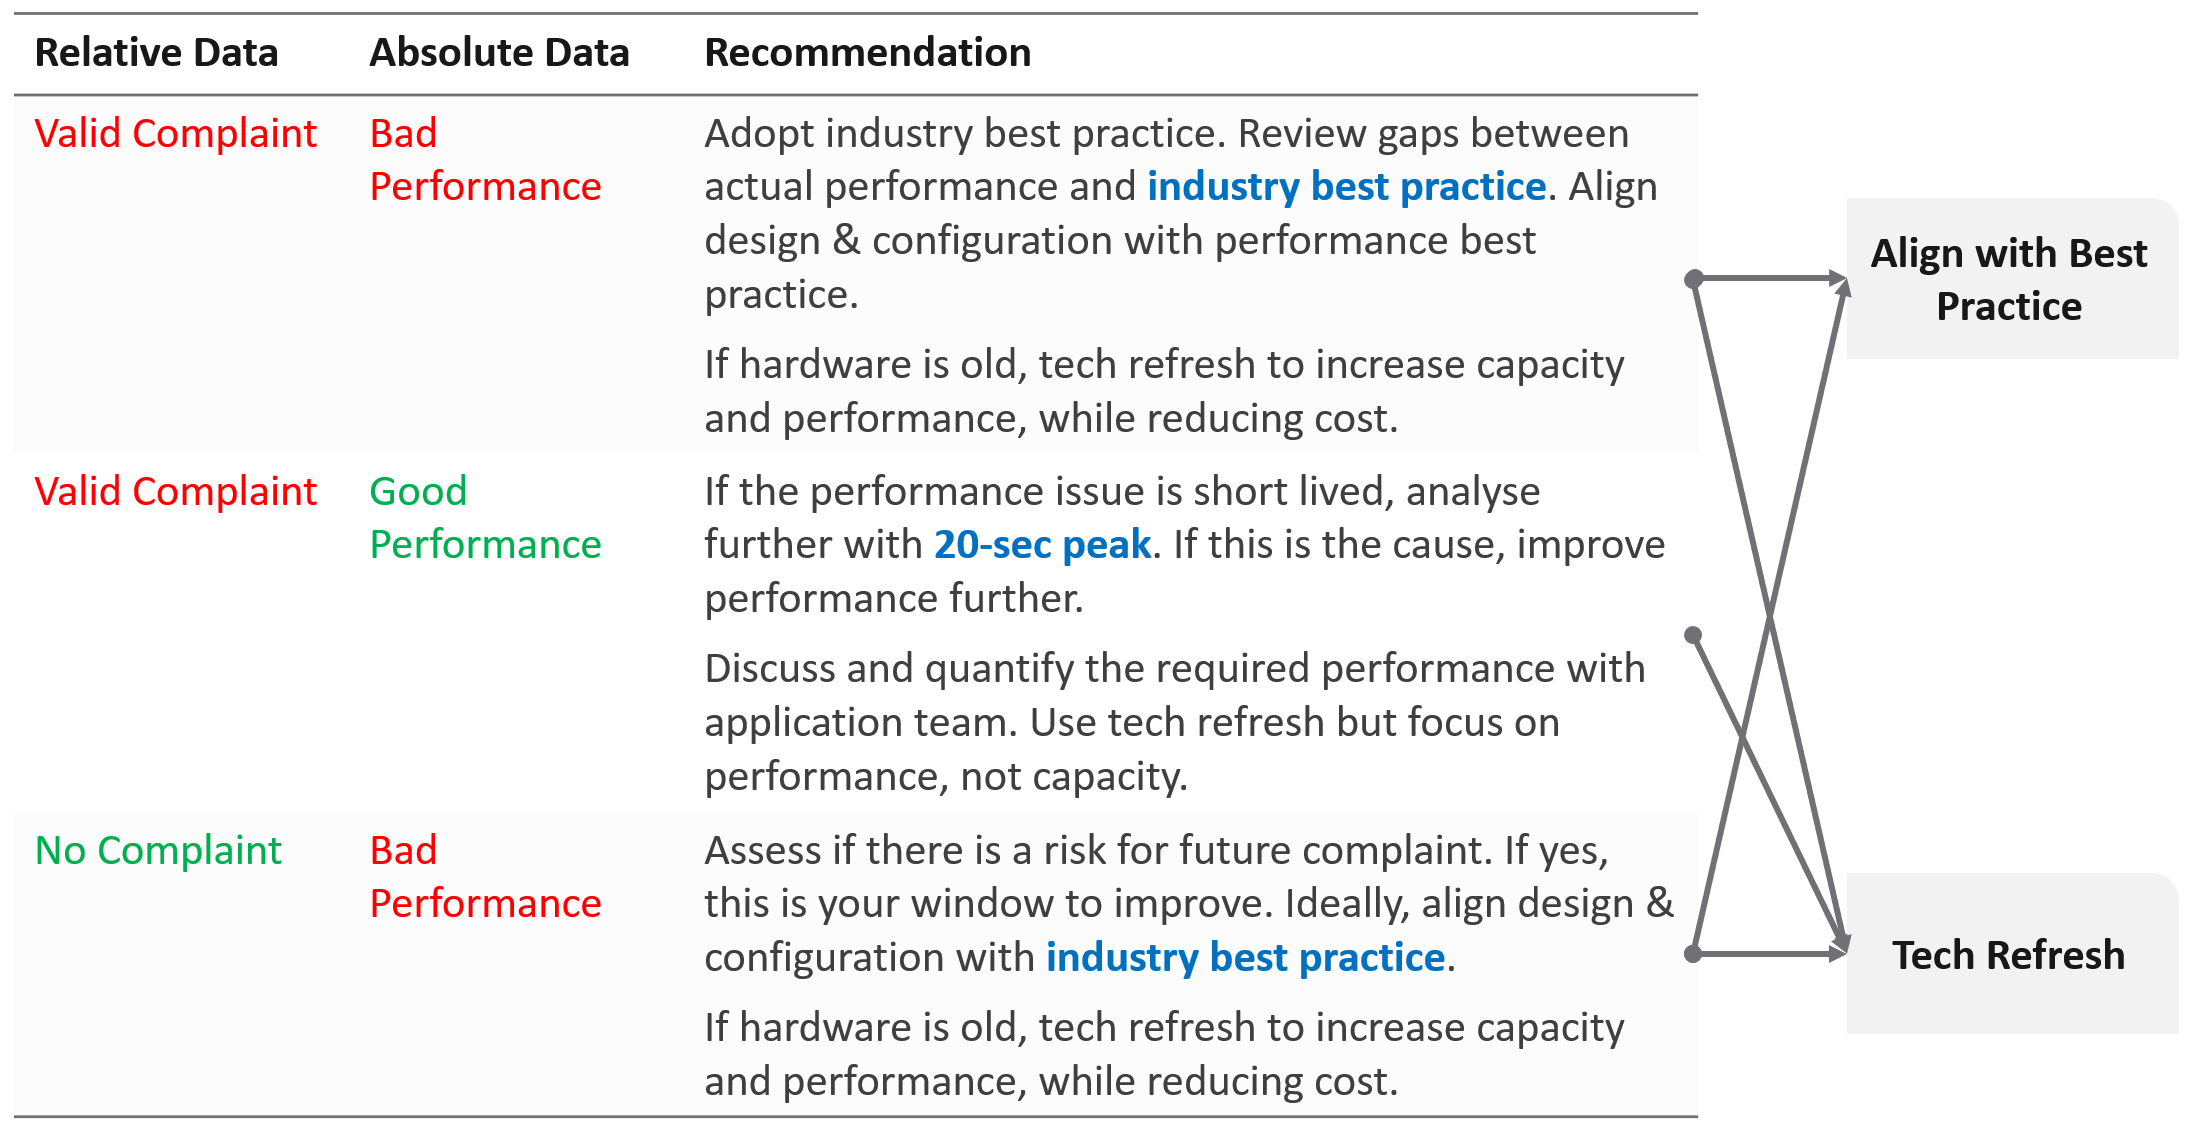
What if you have no complaint and the profiling proves the performance is good?
-
That’s certainly a good news. It is the ideal situation and you may not have to do anything. However, make sure you set expectation at the right level (balancing price/performance).
-
Proactively, check if present both performance & capacity are enough for future demand.
Complaint Analysis
Why do we start with complaint?
Because this is what the business experience.
End users normally complaint on 2 types of problems:
-
The system is down. This is easier to confirm as the proof is clear. You typically have log files too.
-
The system is slow. This is much harder as it’s subjective.
They don’t normally complain about the system is not secured.
The problems above can be major or minor. Major problems are easier to analyze, and they tend to be reproducible. You have many users, or many applications, or many VMs affected over long period of time. In this case, the problem is likely something common, and you can see the metrics.
Minor problem is hard to analyze. You likely need to interview the actual user. When you do, gather the following
| Time | This is not the time the complaint was lodged, but the time the problem actually happened. For example, the developer may complain at 12:34 pm that her application was slowed at 09:51 am, and it lasted 14 minutes. |
|---|---|
| VM | The VM affected. Ideally, this was analyzed by developer as the VM causing the problem, not the VM receiving the problem. |
| Analyzis | What is the root cause? If the actual cause is not directly related to the symptom, it needs to be explained as it becomes less convincing. |
| Proof | What’s the metric or event that prove that the root cause was indeed correct? The acid test is alert. The expectation from senior management is if the same problem happens again, you know right away. How can you know it right away? The alert. You set up an alert to trap the root cause. If your root-cause alert does not detect the problem, you have not found the root cause. |
Consideration
What things must you consider when doing the profiling?
| Resolution | Profile based on 5-minute average, not the 20-second metrics. This matches your SLA. |
|---|---|
| Scope | Profile Compute and Storage. Why is network not included? Network needs to be analyzed separately due to its nature as interconnect and not nodes. |
| Focus | Profile all the VMs, not just the VMs you care. This gives you the complete picture. The only time you exclude VMs is when you’re 100% sure they cannot impact the performance of the VMs that matter to you. Typically, this means the environment is physically isolated, including separate physical network and storage. For example, if there is a physical data center where you don’t care at all, you can exclude them. In large environment, split by Class of Service. The higher one should be performing better than the cheaper tier. You profile the VM, not the cluster or datastore, as that’s where the SLA is. |
Noisy Neighbour
I use the word Noisy Neighbour instead of “resource management” as it’s clearer in meaning. When you have enough overall capacity, but some consumers (VM, K8 Pod) aren’t getting what they are asking, you have imbalance in the shared environment. One major root cause of imbalance is noisy neighbour.
In a shared environment where there is practically no limit or control placed on consumer (e.g. VM, Container), you can get into Victim Villain problem. This is where a small percentage of consumer cause performance problem to others. It could be as simple as 1 constant consumer causing the problem to the same few victims, so you know who the villain and who the victims. It could be as complex as transient problems, where you can not even see a pattern. Both the villains and victims are random, and they may even trade position over time. Sometimes the victim is the villain, causing self-harm.
The real villain may not be the VM, meaning the real request of the load is coming from outside the VM. Windows or Linux was simply executing what a central command center asked.
The cause of the problem may not even be related to the symptom.
A story I remember well is the Head of IT Operations asked me to “find the b@$t@rd that did this to me”. He believed there is a villain VM in this environment that randomly attacked other VMs. The symptom is the victims became unresponsive, sometimes to a simple ping, but the problem always disappeared within 15 minutes. The victims were spread across multiple clusters, multiple datastores and multiple data centers. There is no pattern on the victim. They varied in size, and both Windows and Linux were affected. There is no pattern on the time, so he did not know when the next attack would be.
We did a lot of analyzis, working with both storage team (they were on EMC high end array) and network team (they have synchronous replication for mission critical datastores over Cisco switches and routers).
At the end, we found out it was the anti virus signature update. It was not randomized over long period. When hundreds of VMs were updated, the combined IOPS saturated the WAN link, reducing the synchronous replication. That basically paused IO commands, so the VMs were frozen.
What are the 3 knobs you have to control noisy neighbour?
-
Share
-
Reservation
-
Limit
We cover them in Configuration Management chapter. Go to the Resource Management section.
What knob is missing from the above?
Do you think Priority is missing? I think priority is too strong a knob. It gives 0% to the lower priority ask, which is not what you want. You still want each consumer to get something, which is basically what share does.
Let’s now apply the above knobs into the four main resource types. In future I hope to address GPUs as they have different functionalities.
Just like there are many nuances on metrics, there are also nuances in addressing noisy neighbours.
You will see that the settings are complex. Adding Resource Pools complicates further as you have another management layer.
CPU
Let’s begin with CPU as this is typically where the problem is.
| Control | Analyzis |
|---|---|
| Limit | There is a default limit, which is the configured CPU size of the VM or container. The problem with this limit is most of the time it’s too high, driven by cheap pricing. A VM that only needs 8 vCPU has a 32 vCPU configuration. Why? Because the buyer can afford it. |
Let’s take an example:
In the above example, all you need is a few 32 vCPU VM to create the problem. If you have 10 of them, there is a chance each fills up 1 ESXi host. This is why both overcommit ratio and maximum VM size are both in your pricing policy. While you can set a limit on the VM, it can result in unpredictable performance as Windows or Linux does not know that it can only really use a portion of the resources allocated. The limit is also applied in GHz, not vCPU. So the impact can vary each second as the frequency fluctuates. | |
| Reservation | Can you solve the above problem by reserving CPU to all the VMs? The answer is no. You can only reserve 25% of the configured capacity of each VM, because the overcommitment ratio is 4:1. That means a 2 vCPU VM is only given 1.25 GHz. This loosely translates into 0.5 vCPU only, not enough to run anything useful. One adjustment you might think of is to guarantee the first vCPU. So each VM gets 2.5 GHz, regardless of size. Since there are 400 VM, you reserve 1000 GHz. Your total capacity is only 1000 GHz, so the cluster is filled up. This actually exceeds your usable capacity, as you need to account for HA. On the other hand, you have 25% boost due to HT. Reservations become less effective as you increase the overcommit ratio. At 8:1 overcommit, you cannot guarantee more than 0.5 CPU worth of resource across the environment, on average. |
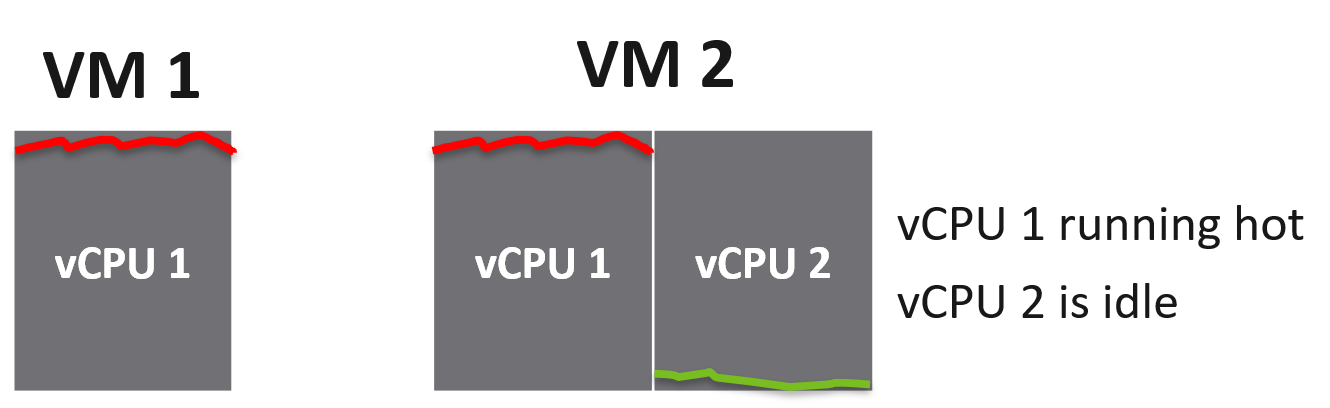
| Share | Share is per vCPU, not per VM. While a larger VM has more overall CPU shares, the share is not shareable among its vCPU. In the following example, the vCPU 1 of VM 2 does not get 2x the share as it does not benefit from idleness of vCPU 2 of VM 2.
|
IO cost the associated VM. A VM doing excessive network packet and disk commands may experience CPU ready if it runs out of share. The reason is the share is measured against CPU Used, and not CPU Run. CPU Used includes CPU System, which account for the work performed by hypervisor on the vCPU behalf. %USED = (%RUN + %SYS - %OVRLP) * Frequency Factor * HT Scaling Factor. Hence a high CPU System will eat the share of the vCPU. |
Memory
Memory is basically an extremely fast disk, such that you care about space more than speed. As a result, the memory utilization metric tends to be flat over time, both at the VM level and ESXi level. The exception here is transient VMs or containers. ESXi clears its consumed metrics when the associated VM is powered off. So in environments running Horizon Instant Clones, you get higher fluctuation.
Because of this flat utilization, the overcommit ratio is lower. This results in relatively less contention, and therefore problems. The problem with this solution is cost. You are basically paying for a lot of cache.
| Control | Analyzis |
|---|---|
| Limit | The memory utilization at both Guest OS level and VM level consist of mostly cache, pages that are not used. Since there is no limit within Guest OS, should you apply at VM level then? This carries the risk of memory contention, as the 2 layers are independent of each other. You need to track the memory contention closely if you are doing this. Considering the lack of real-time remediation solution, I’d recommend you stay away from this, and focus on right-sizing at the Guest OS level instead. |
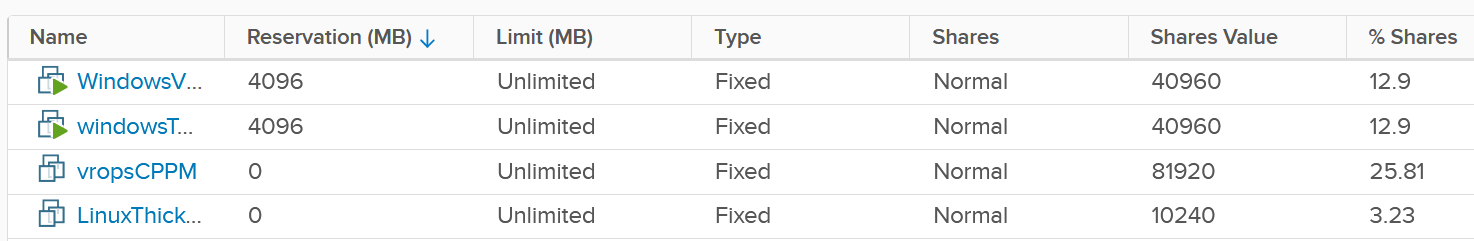
| Reservation | Unlike CPU, memory reservation is “sticky”. Once the VM touches that page, it’s permanently reserved regardless of subsequent usage. The problem is the VMkernel does not know if that page is useful or not. As a result, I’m not recommending you use this. Unlike CPU, where you frequently go beyond 2 : 1 overcommit, you typically do not overcommit beyond 2 : 1. If you overcommit, tracks the VM memory ballooning counter for an early warning of memory contention. For your highest class of service, where you guarantee memory performance, there is no overcommit. Per-VM reservation becomes irrelevant when the entire cluster does not overcommit. |
| Share | See CPU, as the behaviour is the same (although the default share values themselves are slightly different). |
Disk
There are actually two types of metrics, as disk has both space (GB) and speed (IO and throughput). The speed dimension is more problematic as the limit is much higher and the spike is unpredictable. You can have either IOPS or throughput giving you problems.
Unlike compute, there is no defined upper limit by default. A VM can generate unlimited IOPS or throughput. This creates risk, as it can take just a single developer running IO Meter to saturate your shared storage.
Compared with compute, storage typically has more layers, as the actual storage provider is often outside the hypervisor. Even with hyperconverged storage like vSAN, the vSAN kernel module is a separate stack and you need to deal with the vSAN network. In the case of central storage array, you likely need to deal with a storage fabric.
Because of the separate layers, there are multiple points of control:
-
Non vSAN: VM, datastore, storage array. If the fabric has control, you can set it there also to throttle IO going into the central array.
-
vSAN: VM and vSAN.
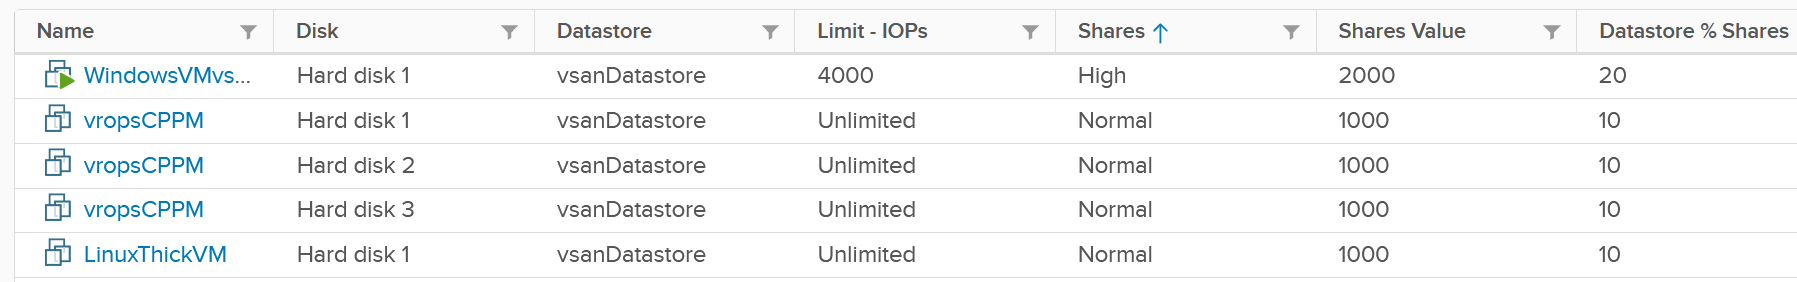
The control for VMs can be seen below, which shows that I’ve set a 4000 IOPS limit and give Hard disk 1 a higher share value.
The problem is: should you set it? If yes, what numbers?
| Control | Analyzis |
|---|---|
| Limit | There is a limit for IOPS, which is per virtual disk. Can you see the challenge in setting this number? There are different variations (block size, read/write ratio, random or sequential). That means the resulting performance of 1000 IOPS can vary. The problem is your application team typically do not know this level of details. Guess who loses when you argue with your customer? If you set too low, the VM latency may go up. If you set too high, it defeats the purpose. Your central physical array may be saturated. For example, if your storage is supporting 2000 VM, if the limit of VM 1% of what your array can deliver, then it only takes 5% of the VM population (40 VM in this case) to saturate your storage. And this is assuming their IOPS are perfectly distributed across your disks. In reality, you have hot spots. For VMs, you can consider limit for the OS disk, if applications do not use it. This at least prevents rogue agents or system-level service for running amok. |
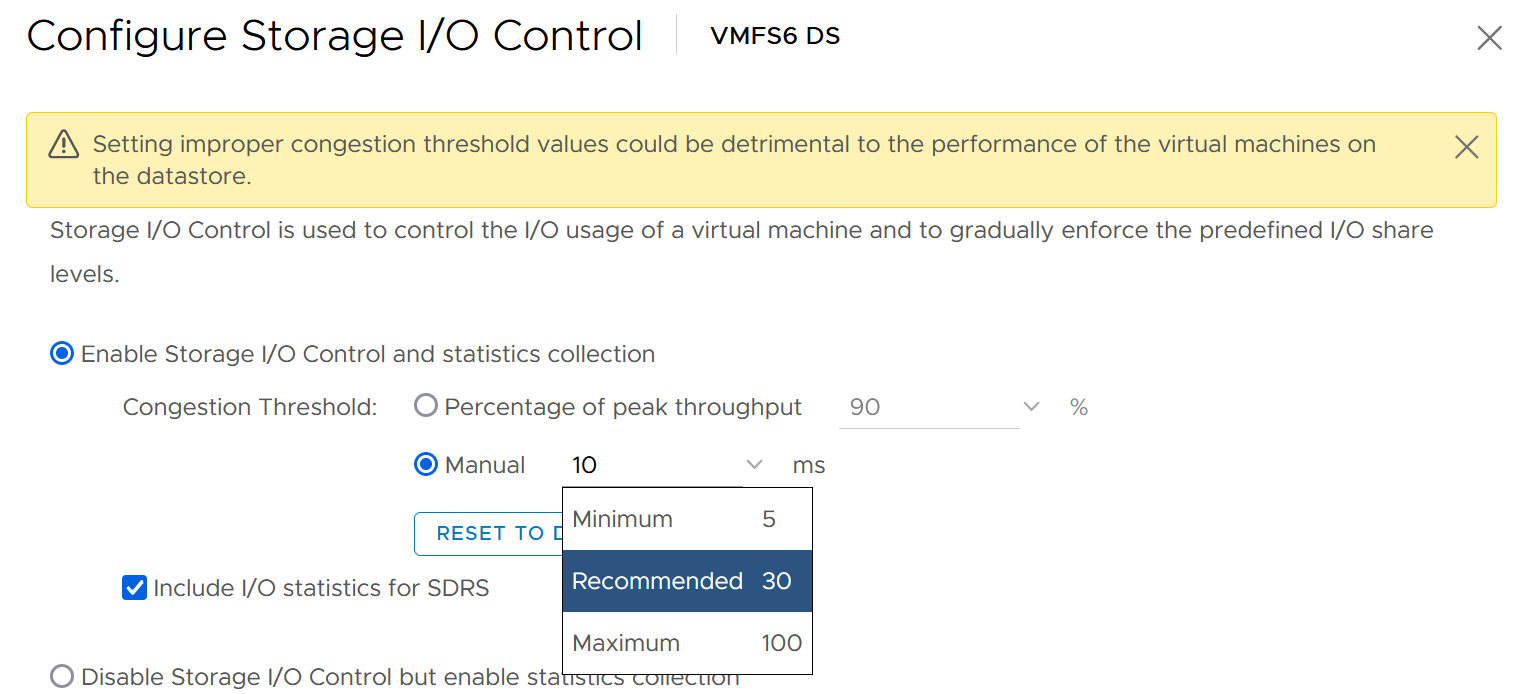
What about the control at datastore level (non vSAN)? SIOC provides 2 choices for congestion threshold. As you expect, both have their own pros and cons, else you just need the best and no need a choice. What about the control at a vSAN level? We certainly need to dive a lot deeper in this area, before applying limits to each virtual disk. What about disk space? How do you prevent your datastore running out of space when you overcommit? For thin provisioned, you can’t control when the disk space will be used. The only thing you can monitor is snapshot age. Remove them within a few days to minimize the risk of huge snapshot. | |
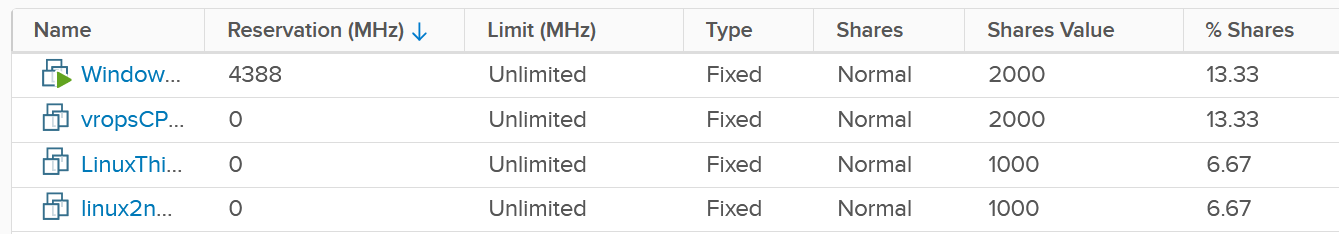
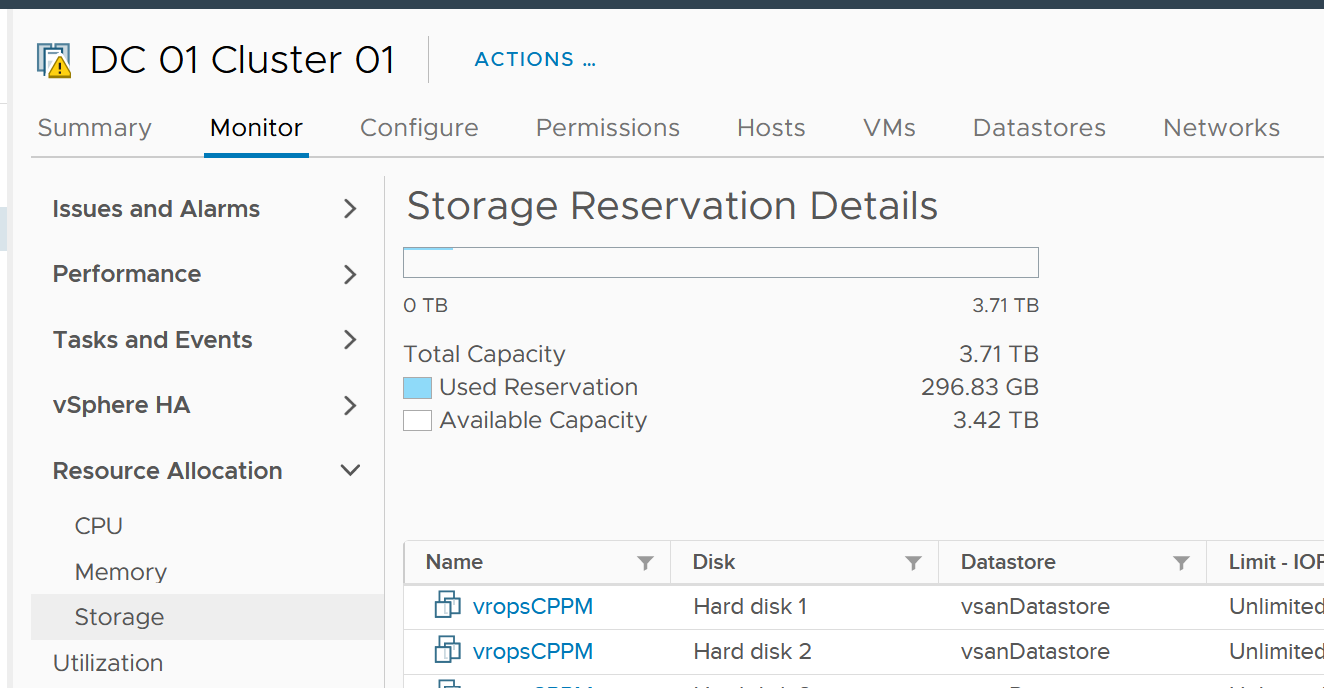
| Reservation | There is no reservation for VM Disk. See earlier screenshot listing 5 VMs in a table. None of the column show reservation. |
| Share | Shares come into play only when latency hits some threshold. Unlike CPU, the share does not care about the disk space size. Ideally, the control you want is IOPS per GB. So when you buy more capacity, get faster disk. The reason is when you sell disk space, it should come with a certain amount of IOPS and throughput at certain latency threshold. This is how you justify gold storage higher price per GB. |
Storage I/O Control
The control at the datastore level is for a different purpose. Storage I/O Control (SIOC) is a datastore-wide throttling. There is share and limit, but not reservation.
You can enable SIOC on each datastore, including local datastore.
Take note because vSAN has its own mechanism, SIOC does not apply to it.
Network
Network is the hardest to solve, due to its unique nature as interconnect. I cover it in-depth in vSphere Metric book. Read at least the section “Why Network Monitoring is Unique".”
Done?
Great, now let’s discuss how the noisy neighbour problem is harder in the network.
We start with a single ESXi, not distributed switch, as that’s where the villain VM is running. Let’s say the ESXi has 2x 25 Gb/s physical NIC. Total is 50 Gb although you typically count this as 40 Gb, giving you 20% headroom. In these 2 cards, you run both the VMK traffic (vSAN, vMotion, vSphere Replication, etc.) and VM. Let’s say you have 25 running VM on average. Assuming you allocate around 20 Gb for VMK, that leaves 20 Gb for 25 VM.
Now, a single villain VM can hit 10 Gb. For example, Hadoop worker node receives large amount of data over the network, sustaining 5 Gb over 300 seconds period. That leaves 10 Gb to be shared among the remaining 24 VM. Each only gets 400 Mb/s on average. If they are not network intensive, they may not feel the impact.
But the above calculation is done on 2 x 25 Gb network. If you only have 2 x 10 Gb, you increase your risk significantly. In a sense, it goes back to fundamental of capacity management, which is your overcommit ratio.
Review the following diagram, which shows a vSphere Cluster. Why is network missing on Resource Allocation?
The reason is you configure it on the distributed switch.
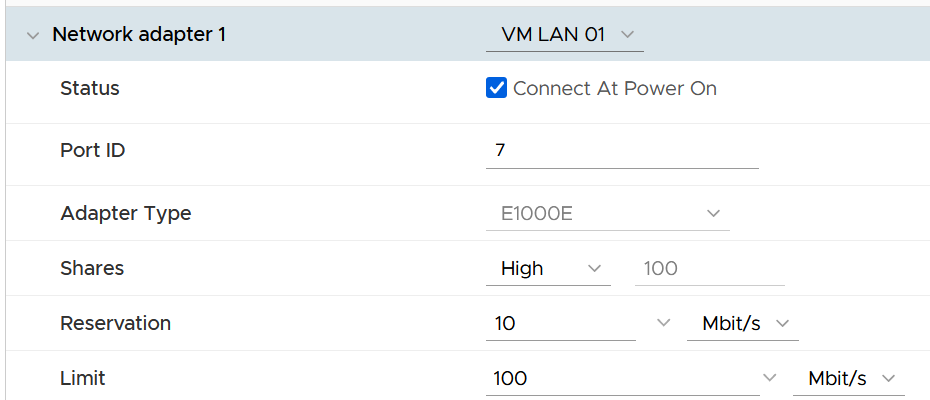
Just like compute, you can set on each VM network adapter the shares, reservation and limit.
| Control | Analyzis |
|---|---|
| Limit | Just like compute and storage, if you set limit you need to ensure it’s high enough for the VM, yet low enough for the ESXi physical NIC card. So what number do you set? I think it should be 8 Gb/s. That’s good for the VM, while giving some buffer at ESXi assuming it sports 2 x 25 Gb/s physical NICs. There is also management challenge, as the settings are buried deep and set in multiple places. So at the end of the day, it might not be practical. |
| Reservation | If you have plenty of bandwidth, consider setting 100 Mb/s per VM. Use the metric profiling technique to arrive at number specific to your environment. |
| Share | The main thing you need to check is actually between VM and non VM. The share should be larger for production VM network and development VM network. Regarding VMkernel, it’s tricky. Is vMotion more important than vSphere Replication? What if you’re replicating a mission critical VM but migrating a development VM? |
Solution
So what can you do to avoid it altogether, instead of just minimizing it?
Well, if you overcommit, the answer is it is not possible. It’s like the highway. You overcommit the lanes, so during peak hour there will be some congestion. You can minimize the impact by having the right capacity planning.
Start with the right pricing policy.
-
It should be a function of your overcommit ratio. In a nutshell, your message to your customer is “if you all want to pay half price, there will be 2x as many of you as I need to break even”.
-
Have progressive pricing tier, so a 64 vCPU VM is not simply 64x the price of 1 vCPU VM.
If you do not charge, then use Class of Service as the policy. The size of the VM or Container is less in the lower class of service, as the class has higher overcommit ratios.
Educate your customers, and communicate clearly the different quality of service. For example, the following shows the SLA for memory.
| Class of Service | Overcommit | Performance Threshold |
|:--:|:--:|----|
| Gold | 1 : 1 | VM contention is 0% for 100% of the time in the entire month |
| Silver | 1.5 : 1 | VM contention is <1% for 99.99% of the time in the entire month |
| Bronze | 2 : 1 | |
Maximum VM Size
The following table provide guidance on the maximum VM size.
| Overcommit | Maximum VM Size |
|---|---|
| 1 : 1 | Maximum size = ESXi logical CPU. Logical means HT enabled. An ESXi with 48 cores 96 threads means 96 logical CPUs. However, take note of CPU throughput degradation and CPU NUMA effect. |
| 2 : 1 | Maximum 0.5 of ESXi logical CPU As there can be 2 large VMs running, they will feel the 37.5% penalty as each of them actually want the entire physical core. To avoid that, reduce from 0.5x to say 0.4x, giving 20% headroom. |
| 4 : 1 | 0.25x Same as above. You can have 4 medium size VM, each of them taking up 1 entire socket in a 2 sockets ESXi host. So a pair of VMs compete for 1 physical socket. |
| 8 : 1 | 0.125x. This level of overcommit is generally only suitable for lab, dev or simple VDI (where the desktop is 2 vCPU each). It’s not suitable where a lot of VMs are 25% of entire cores. For example, if your ESXi has 48 cores total, then avoid doing 12 vCPU VM. Keep them at 4 – 6 vCPU instead, so they can be slotted more easily in the cluster |
Other Reference
By the way, the noisy neighbour problem happens in non-VMware environment too, as it’s a function of overcommitment on shared resources. Here is an article about noisy neighbours in Microsoft Azure.