PART 2
Consumption
How do you implement the concepts in Part 1 so they are consumable by various roles?\
That’s the goal of PART 2.
Proactive Operations
Part 2 Chapter 1
Proactive Operations is a complex concept. How does it work in real life?
System Engagement
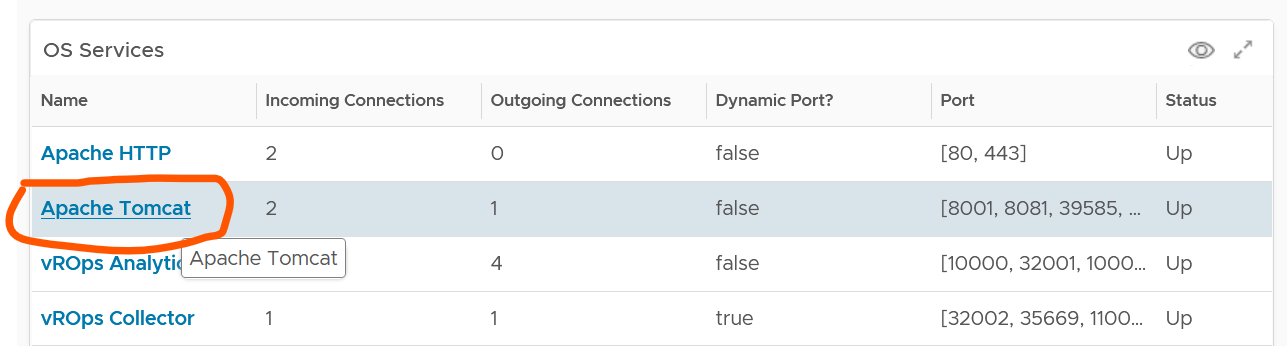
As a product, how does VCF Operations “communicates” to its users?
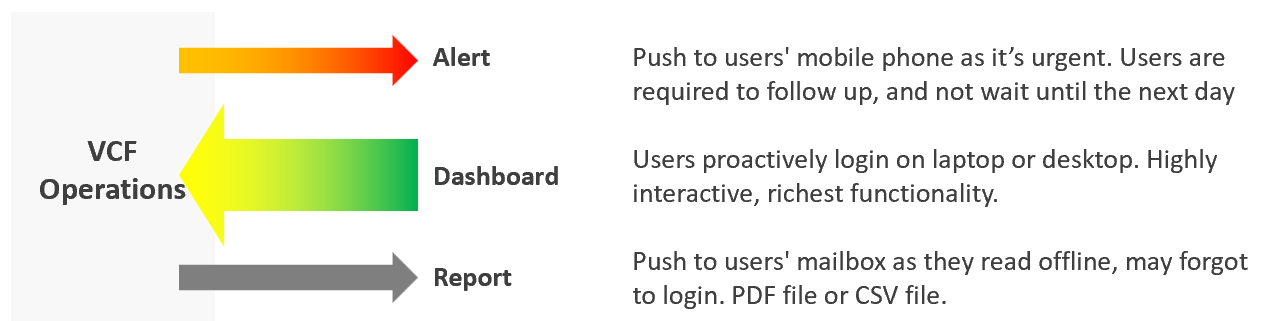
In terms of urgency, live screen is the most pressing, followed by alert. Report is suitable for long term review. Use dashboard as much as possible as it offers the richest functionality and interaction. That’s why the diagram above shows it with bigger arrow than the other 3 ways.
If you apply the above thinking, you will vrealize several benefits:
| Less reports | Encourage users to login as they get richer experience. Compliment with login-less dashboards, made available at user-friendly intranet website |
|----|----|
| Higher engagement | Higher engagement with IT Leadership Team. Take time to educate and demonstrate how dashboard meets their needs better. Use a login-less dashboard, displayed prominently near their office to encourage involvement. |
| Better telemetry | It’s not possible to track if users actually read your reports. With dashboard, you can even track how they interact with VCF Operations, using 3rd party website tracker software. |
| Flexible threshold | You can tailor the threshold (green – yellow – orange – red) accordingly, as each of the 4 way of communication have different level of urgency. |
Synergy
The following table details how the 3 ways of engaging are complementary. I’ve excluded screen as it has narrow usage.
| Alerts | Dashboard | Report | |
|---|---|---|---|
| Nature | Reactive | Proactive | Passive |
| Good For | Exception | Exception. Analysis | Exception. |
| Depth | Detail | Detail and Summary | Summary |
| Use Case | Troubleshooting | Troubleshooting. Monitoring. Optimizing | Export to spreadsheet or PowerPoint |
| Time | Minutes | Daily – Monthly. | Weekly onwards |
| Focus is “now” | Focus is days | Focus is weeks | |
| Roles | L1 | L1 onwards | IT Leadership |
| Architect Team | Finance Team | ||
| Capacity Team (Dashboard + Report work together) | |||
| Audit Team (Dashboard + Report work together) | |||
| Tenant (Dashboard + Report work together) | |||
Timeline
In VCF Operations, the following are implemented as dashboard:
-
NOC screen
-
Daily health check
-
Longer cadenced
However, they have diferent timeline. As a result, they have different purpose.
| Live NOC Screens | Daily Preventive Check | Longer Cadence | |
|---|---|---|---|
| Purpose | Real time visibility into the overall environment, so live fire is attended right away. | Prevent alerts of the day. Tomorrow is another day as it will be checked tomorrow morning. | Larger optimization and issue avoidance. Deep and broad analyzis of the whole environment. |
| Urgent (hopefully not important) | Important (hopefully not urgent) | Important (definitely not urgent) | |
| Timeframe | Focus: last 5 minutes | Focus: next 12 hours | Focus: Weekly – Quarterly |
| Data: 1 hour | Data: 1 week | Data: 1 year | |
| Usage and Interaction | Live. Always on and projected on the big screen. | 2x a day. Once at start of day, the other at end of day. | Less standard. Multiple usage throughout the week/month, depending on the persona and need. |
| Time spent to analyze: 10 seconds | Screentime: 10 minutes | ||
| User | L1 (first liner) | L2 (expert) | Auditor, Capacity Planner, Performance Specialist, Cost Specialist |
| Primary Content | Availability. Performance. Security. | Same area of concern, but the Daily Check is broader and deeper as it has much longer horizon. | Capacity (utilization, reclamation, optimization). Sustainability. |
How are their differences translating in the product UI?
| Live NOC Screens | Daily Preventive Check | Longer Cadence |
|---|---|---|
| Dashboard size matches the projector/TV. No scrolling. | Dashboard size is 1 -2 screen deep. | Dashboard size is >2 screen deep. |
Table not suitable. Hard to conclude by seeing many numbers. Easier to see trends + present number | Scoreboard is suitable, as L2 will click to do interactive filtering and analyzis | Table for export to spreadsheet for further analyzis |
| No interaction as there is no keyboard/mouse. See from a distance. It auto-refreshes and auto-rotate | Standard interaction process | Rich interaction. Flexible flow, depending on the need at that time |
Live Screen
The real-time nature of life inside the Network Operations Center room calls for a different type of visibility.
Collaborate with NOC Room team, as they are ultimately the consumer. What information do they need? What do you need from them? What’s the Exit Criteria and Entry Criteria?
The following diagram summarizes the key requirements and constraints. As a result, the dashboard needs to be designed accordingly.
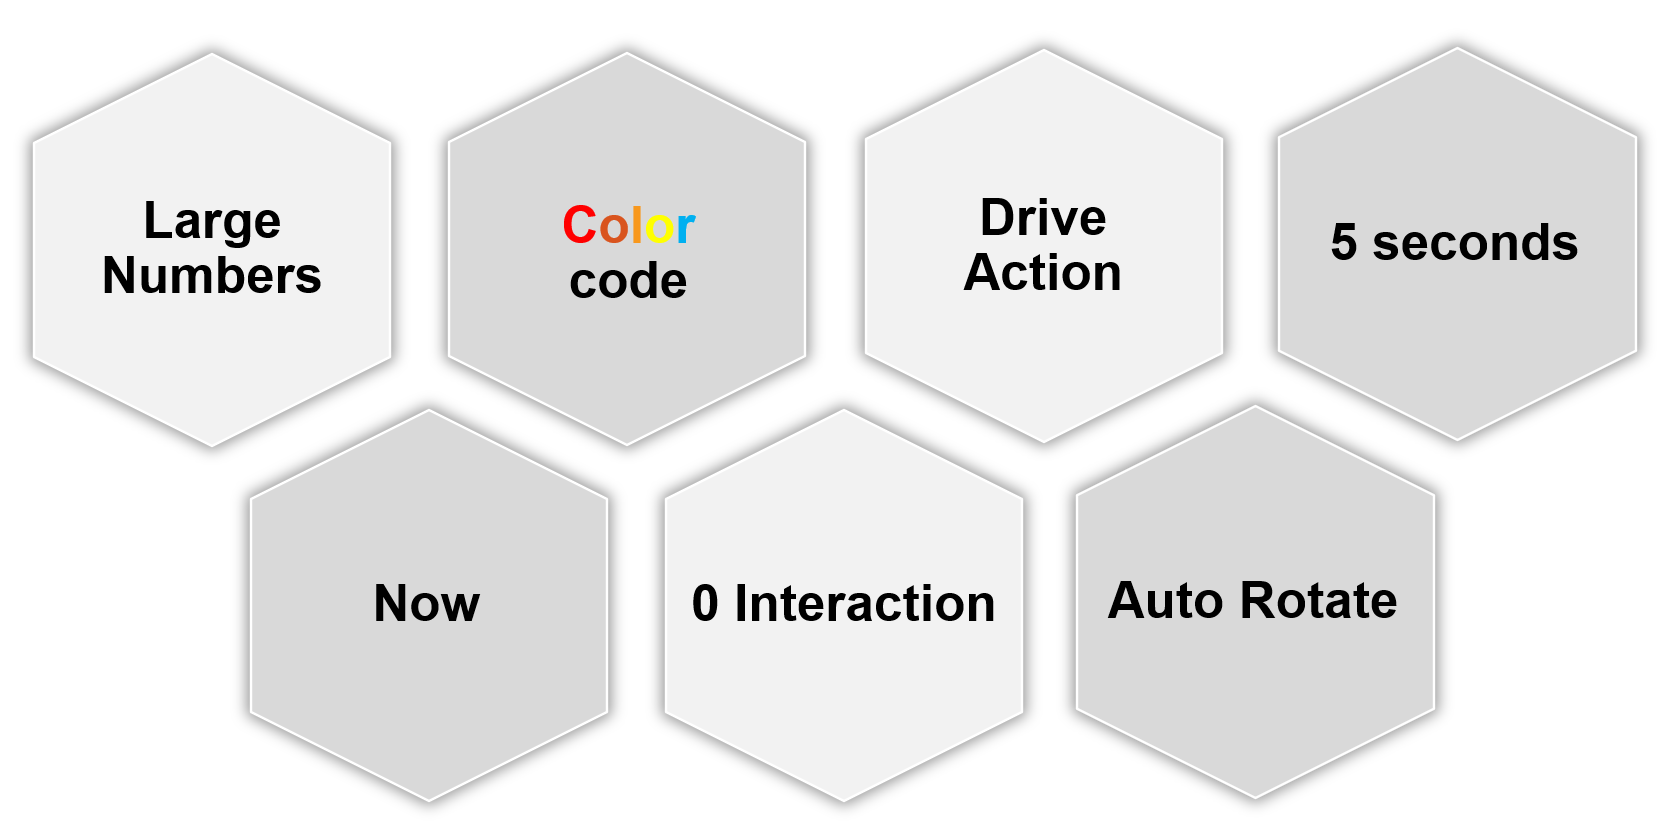
| 0 interaction | Think of TV, not monitor. NOC screen does not have keyboard and mouse for user to click and type. So the information is auto-refresh and auto-rotate. If your TV has a touch screen, that’s a bonus. This should not replace the basic need of being useful from afar. |
|---|---|
| Toolbars & buttons on screen should not be used. They add confusion, plus there is no way to use them from afar. | |
| Most widgets are not suitable as a result. | |
| Large Number | As the information is seen from a distance, the font used is much larger than the standard font used in laptop or desktop monitor. This also means the screen real estate is relatively less. When designing, use a 14” screen instead of 24” screen. |
| Now | It is placed strategically because it displays a time sensitive information. As such, many operational use cases are actually not suitable for these. For examples, Capacity, Cost, and Sustainability management are not highly time sensitive. They tend to stay static for hours, rendering them unsuitable for live screen. It’s showing the latest 5-minute data. The past is less relevant. Ideally, project the next 1 hour. The information auto-refresh frequently. Think 1 minute, not 10 minutes. If the display is static for 300 seconds, users will not be drawn into it. The information presented is more urgent in nature than alerts (otherwise you simply use alerts!) and is used to complement alerts. |
| Color | Heavy use of color. Color is easier to digest than text, as you don’t even need to read. Lots of text can confuse viewers. Text can be hard to read from afar. Use key colors (green, yellow, amber, and red) classify the severity of the issue. By default, all should be green. If you display something that is red most of the time, after a while the viewer will ignore it. This defeats the very purpose of displaying on the big screen. Use alerts for something less urgent. Ideally, all the numbers are in %, with 0 being bad and 100 being perfect. |
| 5 second | KISS (Keep It Simple Show). Remember the 5-second test. The screen should be easy to interpret, user friendly and do not require an explanation. |
The above principle applies to the part of the dashboard that is projected on the big screen. You can dual-purpose the same dashboard, to cater for the operators in the NOC room. These help desk administrators should have the same dashboard on their desktop or laptop. They can then use keyboard and mouse to interact with the dashboard, enabling them to drill down and find out more information.
I’m aware that other persona, especially IT leaders, may drop by to NOC room to check things out. This does not mean we design a NOC dashboard for them. For example, say CIO drops by every single day for 10 minutes. In this case, if it makes life easier, prepare a dashboard to facilitate the “check”. Only bring up during the visit. There is no need to have the dashboard on the wall for the remaining 23:50 hours.
Action
Action, not information. NOC show data for your action, not for your information.
Focuses on immediate remediation. Remediation action has to be immediate, as soon as possible if it’s red.
If something can’t be fixed within the same day, why show it live? Remediation that takes >1 day should not be shown, as the dashboard will be red for hours. Use alerts for longer remediation window.
Problems that don’t require immediate attention should be avoided, as they are distraction. Your NOC Screen is not your To Do List.
Examples of suitable actions: stop provisioning of new VM, take action on VMs that abuse the shared infrastructure.
Examples of not suitable actions: Increase supply of infrastructure, such as adding hardware.
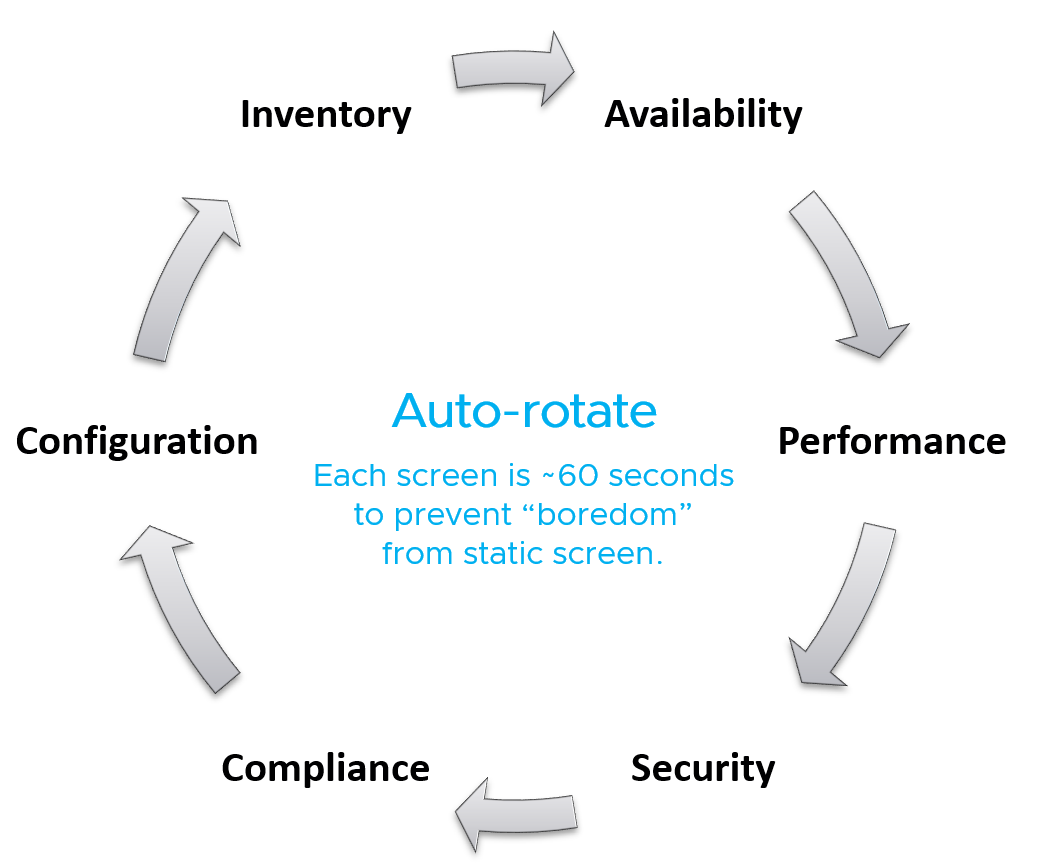
Auto Rotate
It’s not enough to auto-refresh due to the sheer amount of information. Auto-rotate enables you to show more content without scrolling the dashboard, and prevent human’s boredom from seeing the same screen for hours.
Configure the dashboards to auto-rotate in a logical flow. Explain the flow to the users as it can get overwhelming.
Implementation wise, you need to disable Guest OS screen saver, Aria Operations user time out and Guest OS going to sleep.
Full Screen
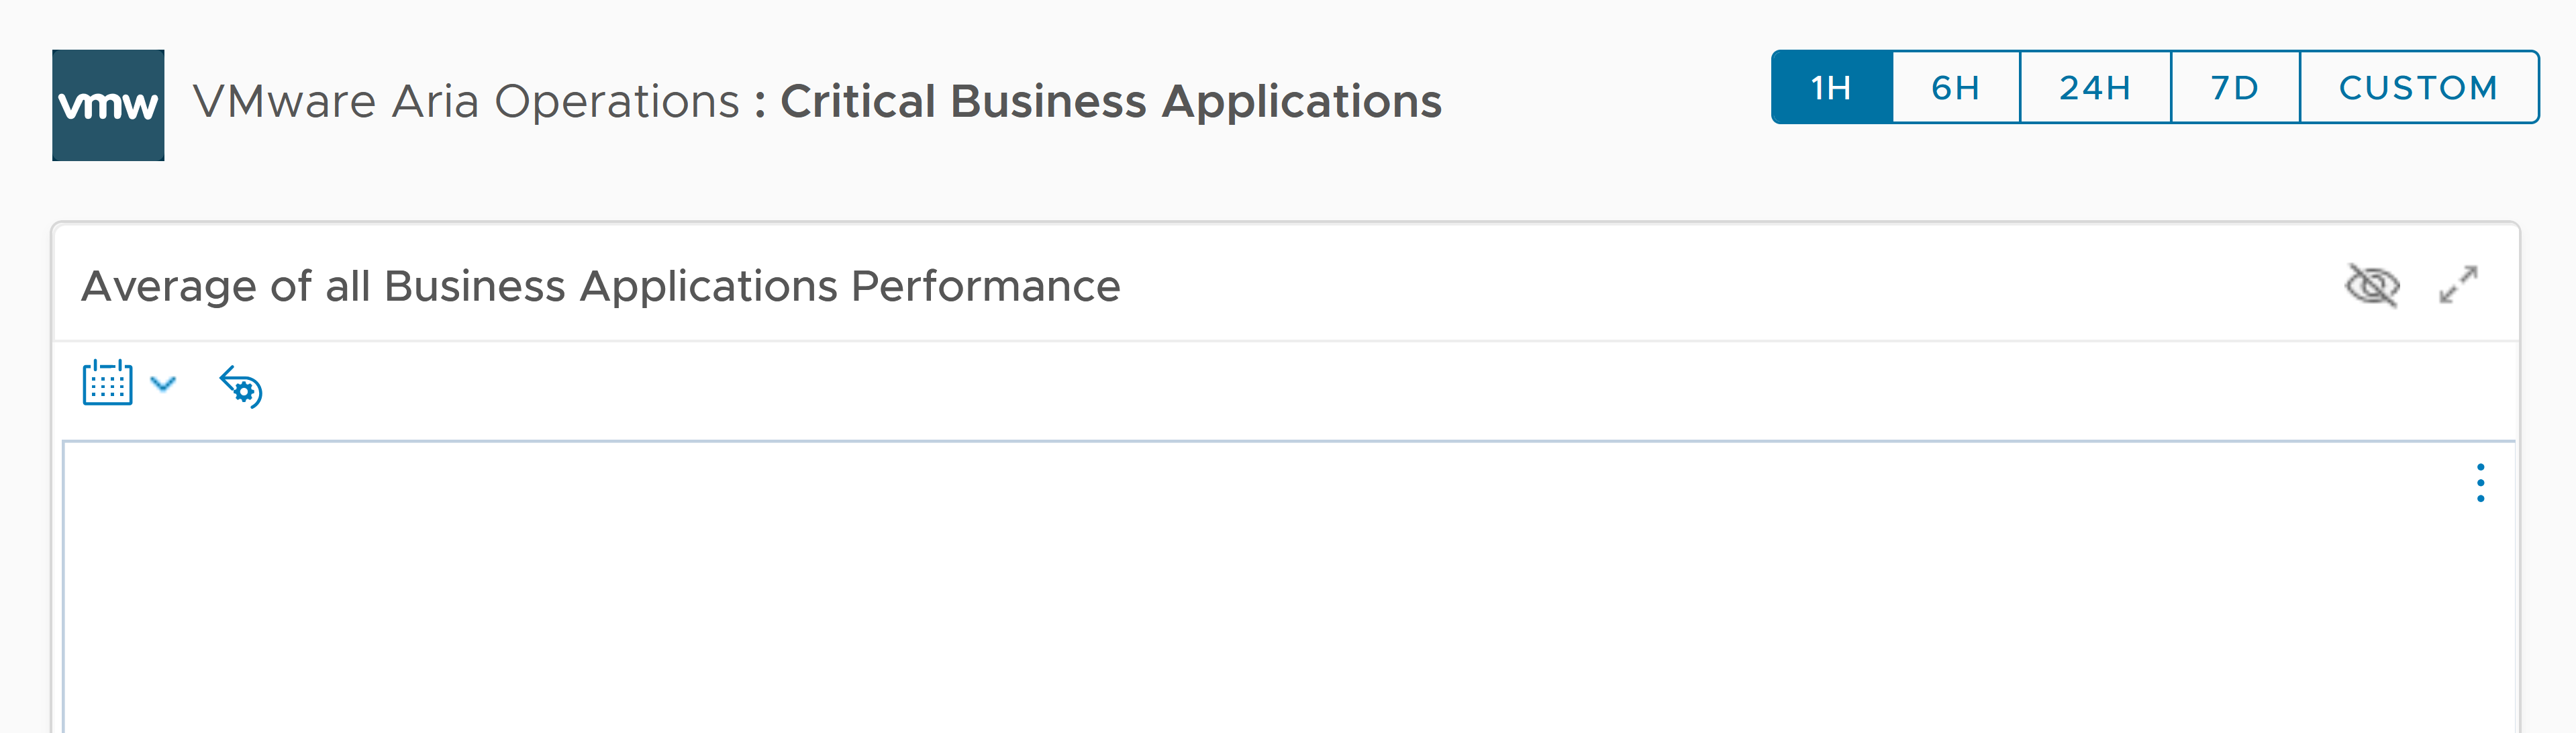
For improved focus, hide the menu and navigation by using a login-less dashboard. This will also maximise the screen real estate. Complement this by enabling the browser full screen, so viewers do not even see it’s a web page. The preceeding screenshot is the result.
Take note that viewers cannot leave the page and navigate out into other pages in vR Ops. The object link below does not work. Yes I agree the product should have removed the URL.
Daily Health Check
This daily, proactive health check forms the 2nd leg of your proactive operations.
Start each day with a proactive daily health check. Initially, this is done by both Level 2 and Level 1 team. As Level 1 gain confidence, they may even do it at the start of their shift. As there are 2-3 shifts in 24/7 operations, the dashboard gets used multiple times a day. The dashboard aims to minimize alerts by analysing underlying issues, hence it requires some expertise of how VCF performs. It also requires someone who knows the environment well, especially what is happening on that day.
Morning Routine
As the person responsible for the health of the overall environment, what do you check every morning, with your first cup of coffee?
If the answer is a list of alerts or complaints, how do you know the big picture?
By and large, your environment is good, otherwise you’re not reading this specific chapter 😊. If it is not good, you have some knowledge on the problems as you need to explain it to your management. On this assumption, this dashboard focuses on things that need attention.
It complements alerts by showing insights (situation that has not triggered an alert) and show the overall picture. The overall picture is also useful as before you troubleshoot something specific you should ensure the issue is not with the overall environment.
As insights complements alert, open the 2 screens side by side. Simply open 2 browser windows, as shown in the following screenshot.
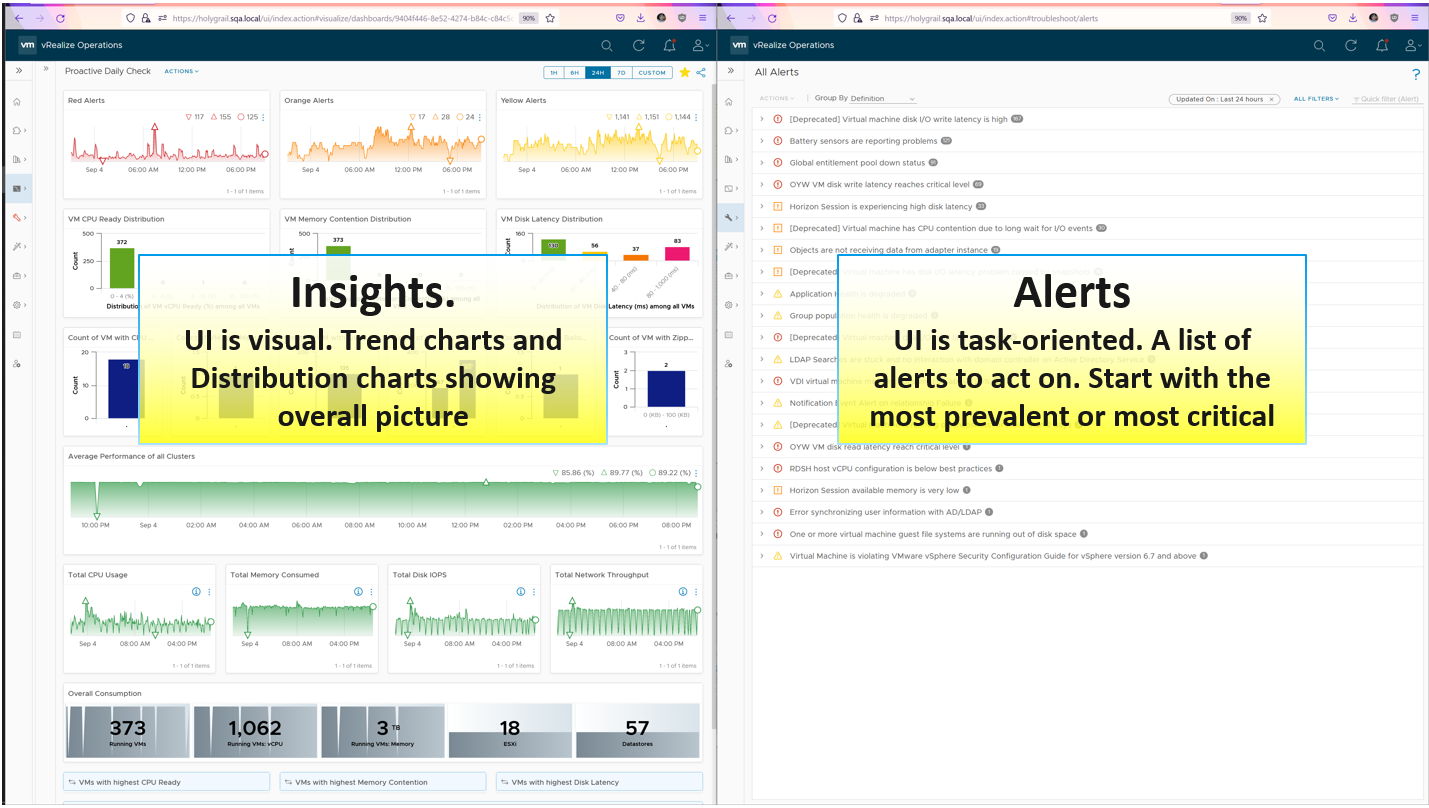
There are 2 dashboards, one from VCF Operations and one from Log Insight.
vSphere Daily Check
As part of our daily check, you’re after changes and unusual events. There are 4 types of changes:
-
Configuration changes.
-
Consumption changes. Both unexpected increase and drop are not desirable.
-
Supply changes. Focus is on unexpected drop, which could be due to a variety of reasons (e.g. maintenance taking longer than expected).
-
Dynamics: VM state change, VM location change, VM inventory change
The first thing to check is the trend of alerts. Since you’re checking this daily or even more, the number gives you a good indicator of what’s ahead of you.
Alarm can give insight when reviewed as a set and over the last 24 hours.
It cuts across objects, so we must be able to see ripple and correlation.
Check the patterns of alarms in the last 24 hours. Is that within expectation?
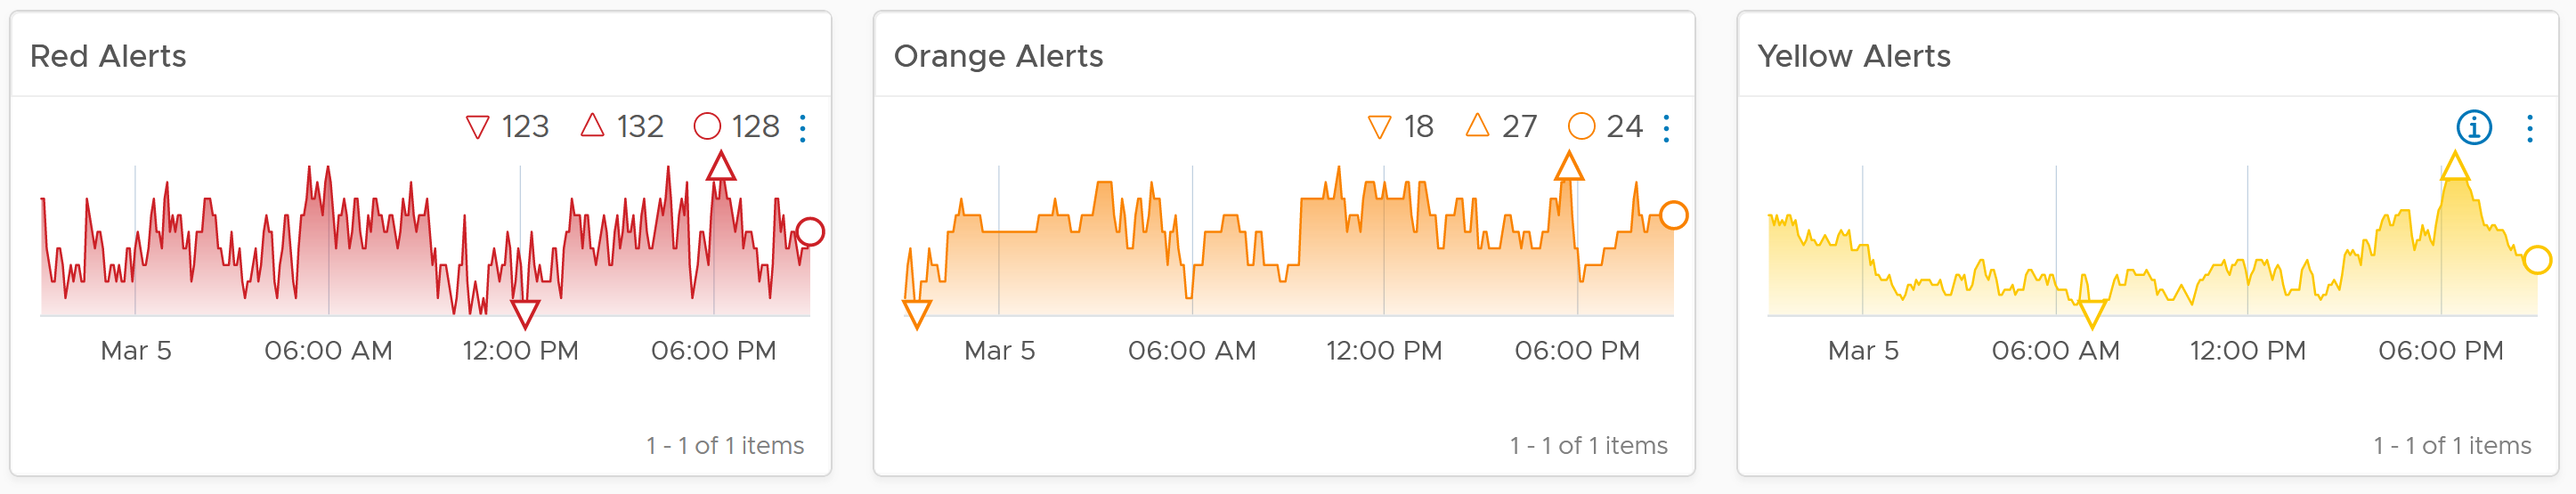
Check both the absolute amount and the pattern. Compare it with your expectation on that day. Is today a special date, where high demand is expected? Any relevant changes approved during last night change window that will impact supply and demand?
Is the trend unusual? Form an expectation of what’s normal for your environment as it develops pattern. Compare it with what’s happening (e.g. DC upgrade, public holiday).
List of Clusters

vSphere Cluster is a logical group where “similar” VMs live together.
The table is sorted by the overall performance, where the least performing cluster is shown at the top.
The columns sport leading indicators, as it uses worst() not average. It checks 9 key performance metrics. Adjust the threshold to your comfort level. 4 utilization metrics are shown to catch abnormal peak.
Performance Trends
What’s the overall IaaS performance among all the VMs? Is it a CPU, memory, disk problem? Expect the numbers to be within your expectations of that day.
What’s the overall IaaS performance among all the VMs? Is it a CPU, memory, disk problem? To do that, dive into a specific cluster. This section automatically shows its performance in the last 24 hours.
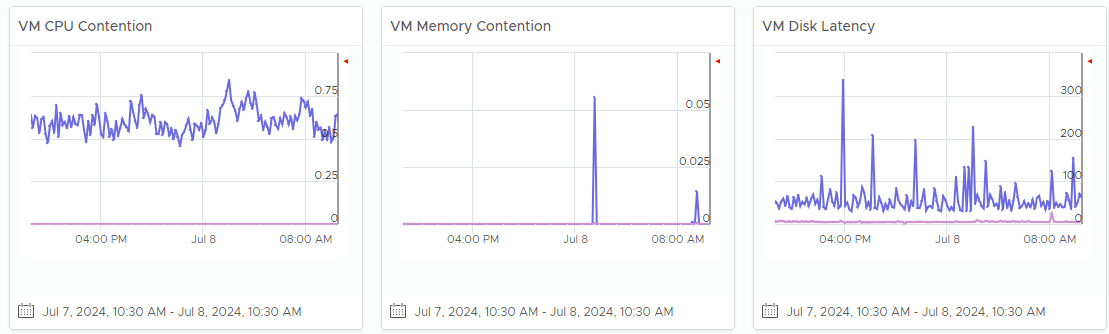
The 3 table covers CPU, memory and disk. Expect CPU contention to be higher and more volatile than memory contention. Add network drop packets if the issue exists in your environment.
Each table shows 2 lines (worst and average). Are they in line with your expectation, both the absolute amount and their pattern over time? Make sure the average is well below your comfort level.
If the worse is far higher, you have an isolated incident. If they are close and the average is not low, you have a widespread issue.
Affected VMs
The distribution charts place all the VMs in 4 levels of performance (green, yellow, orange, red). Attend to the red category first.
They are based on 20-second peak metric, not 5-minute average. This gives you a leading indicator. Each value is based on the highest in the last 24 hours, to enable daily comparison.
Add network drop packets if the issue exists in your environment.
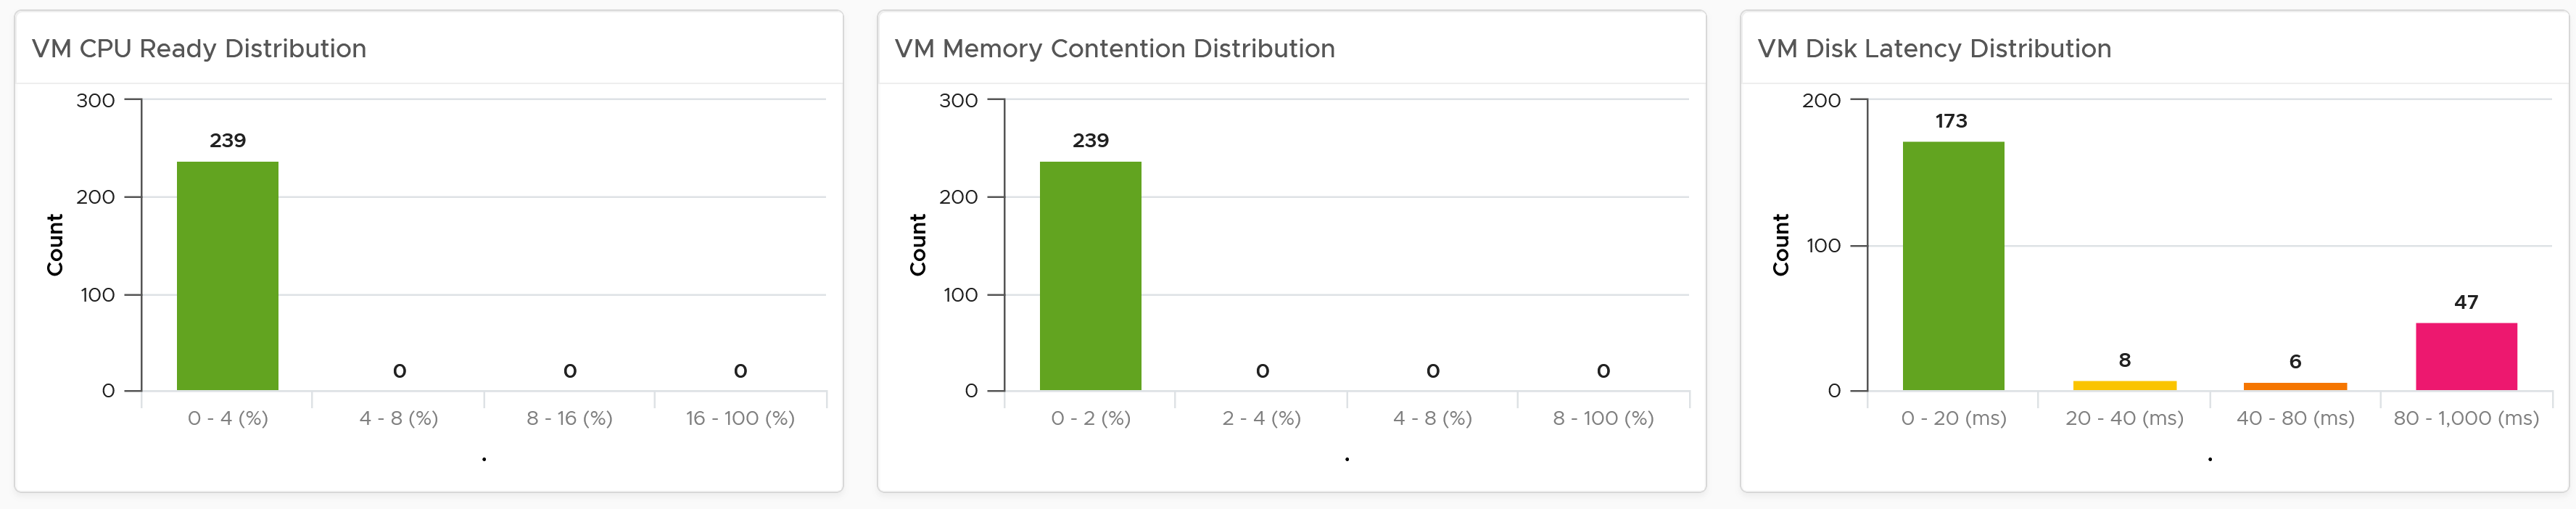
Configuration
Next is configuration. What are typical misconfiguration that cause performance problems?
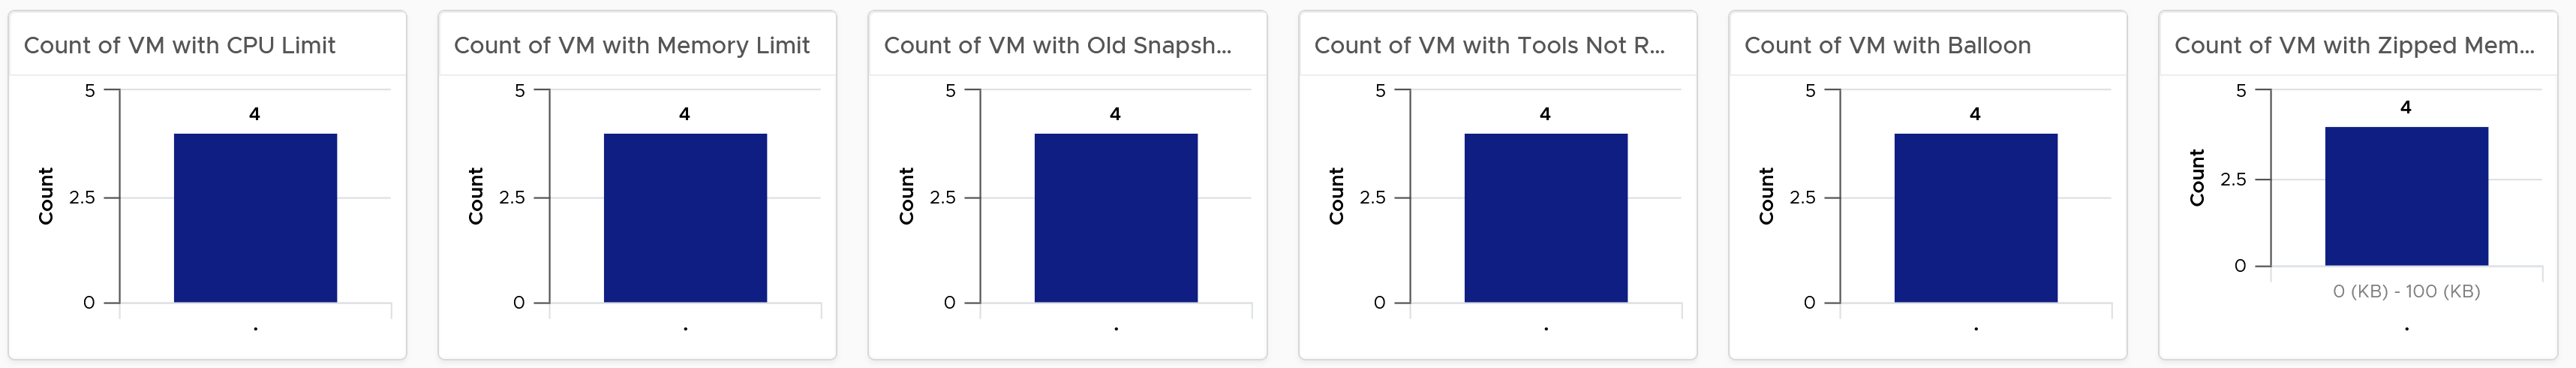
Ideally the above returns 0 VMs.
VM Changes
What are the important changes on VMs? Is the environment more volatile than expected? Ensure they match the expectation of the day.
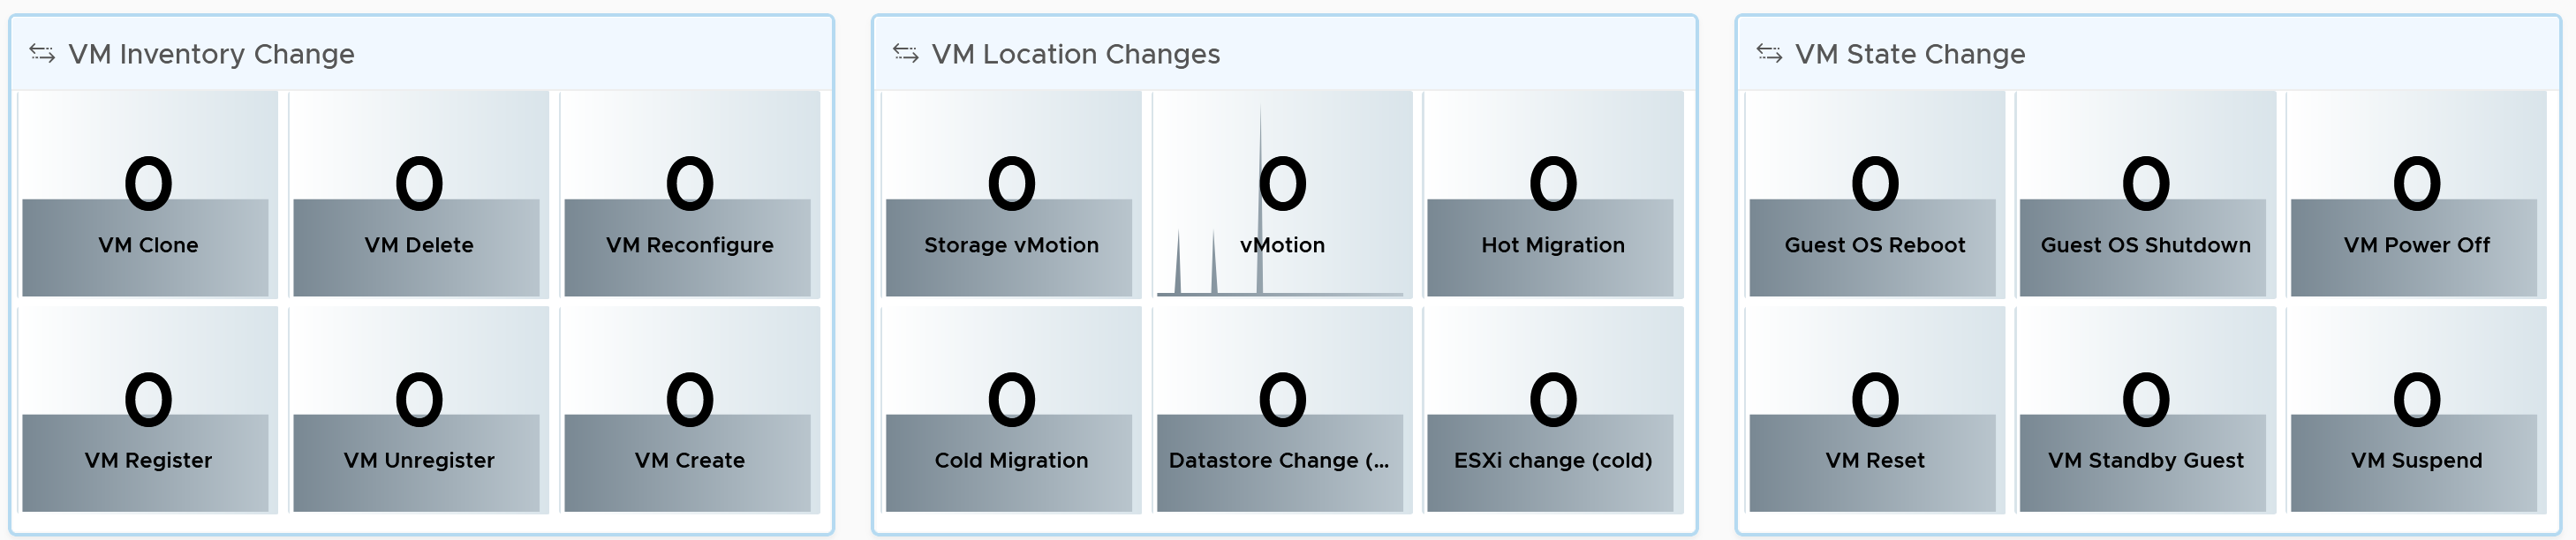
High volatility increases the chances of alerts.
There are 20 types of VM changes that can happen to a VM. They are grouped into 3 logical sets. For each set, the changes are shown in order of urgency, where the least desired changes are shown first.
Each of the 20 changes are unique. Ensure they match the approved change requests and expected changes of that day.
-
State = VMs power state change. Abnormal changes such as reset, suspend and power off are shown first.
-
Location = VMs are moved to another host or datastore. This can be hot or cold migration. Hot migration is shown first as it might impact performance.
-
Inventory = VMs are added or removed, hence impacting count of inventory.
Utilization
To complement the performance, we need to check utilization. Are they higher than expected? On the other hand, a big drop means the amount of work completed is less, which could indicate availability or performance issues.
We check the 4 elements of infrastructure. Since this is the overall utilization, it should be stable or cyclical overtime. Make sure both the pattern and the amount are in line with your expectation of that day.
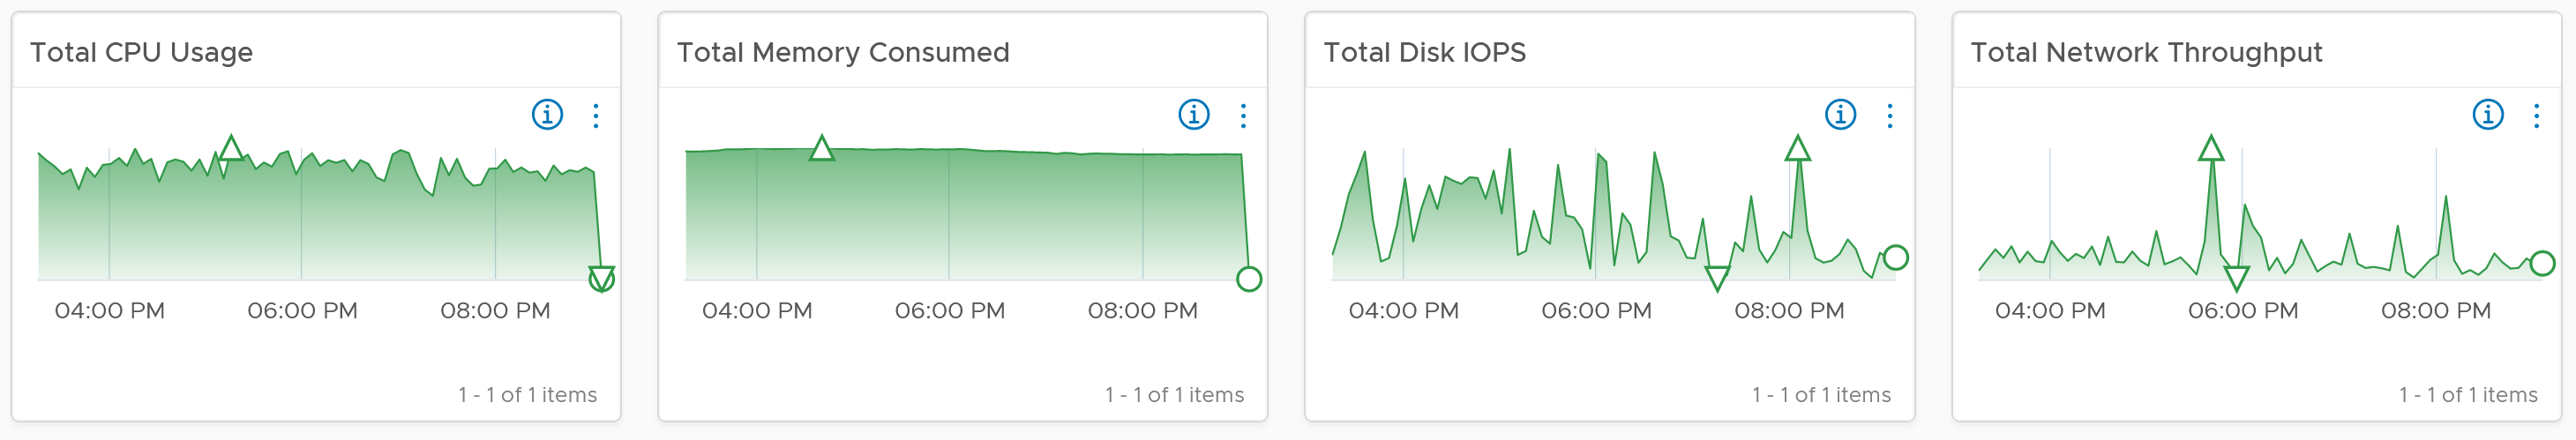
The CPU widget uses Usage metric as it is aware of CPU clock speed. The memory widget uses allocation as memory load is much more stable, reflecting its nature as cache of disk space.
If you have enough screen real estate, add the Memory Balloon and Compresed + Swapped.
Customization Tips
If you operate a large environment, you can add a table of data centers so you can zoom into specific DC. You can even add vSphere Clusters in the table, just take note the table will be longer.
One of the table rows has to be vSphere World object. This lets you see the overall picture.
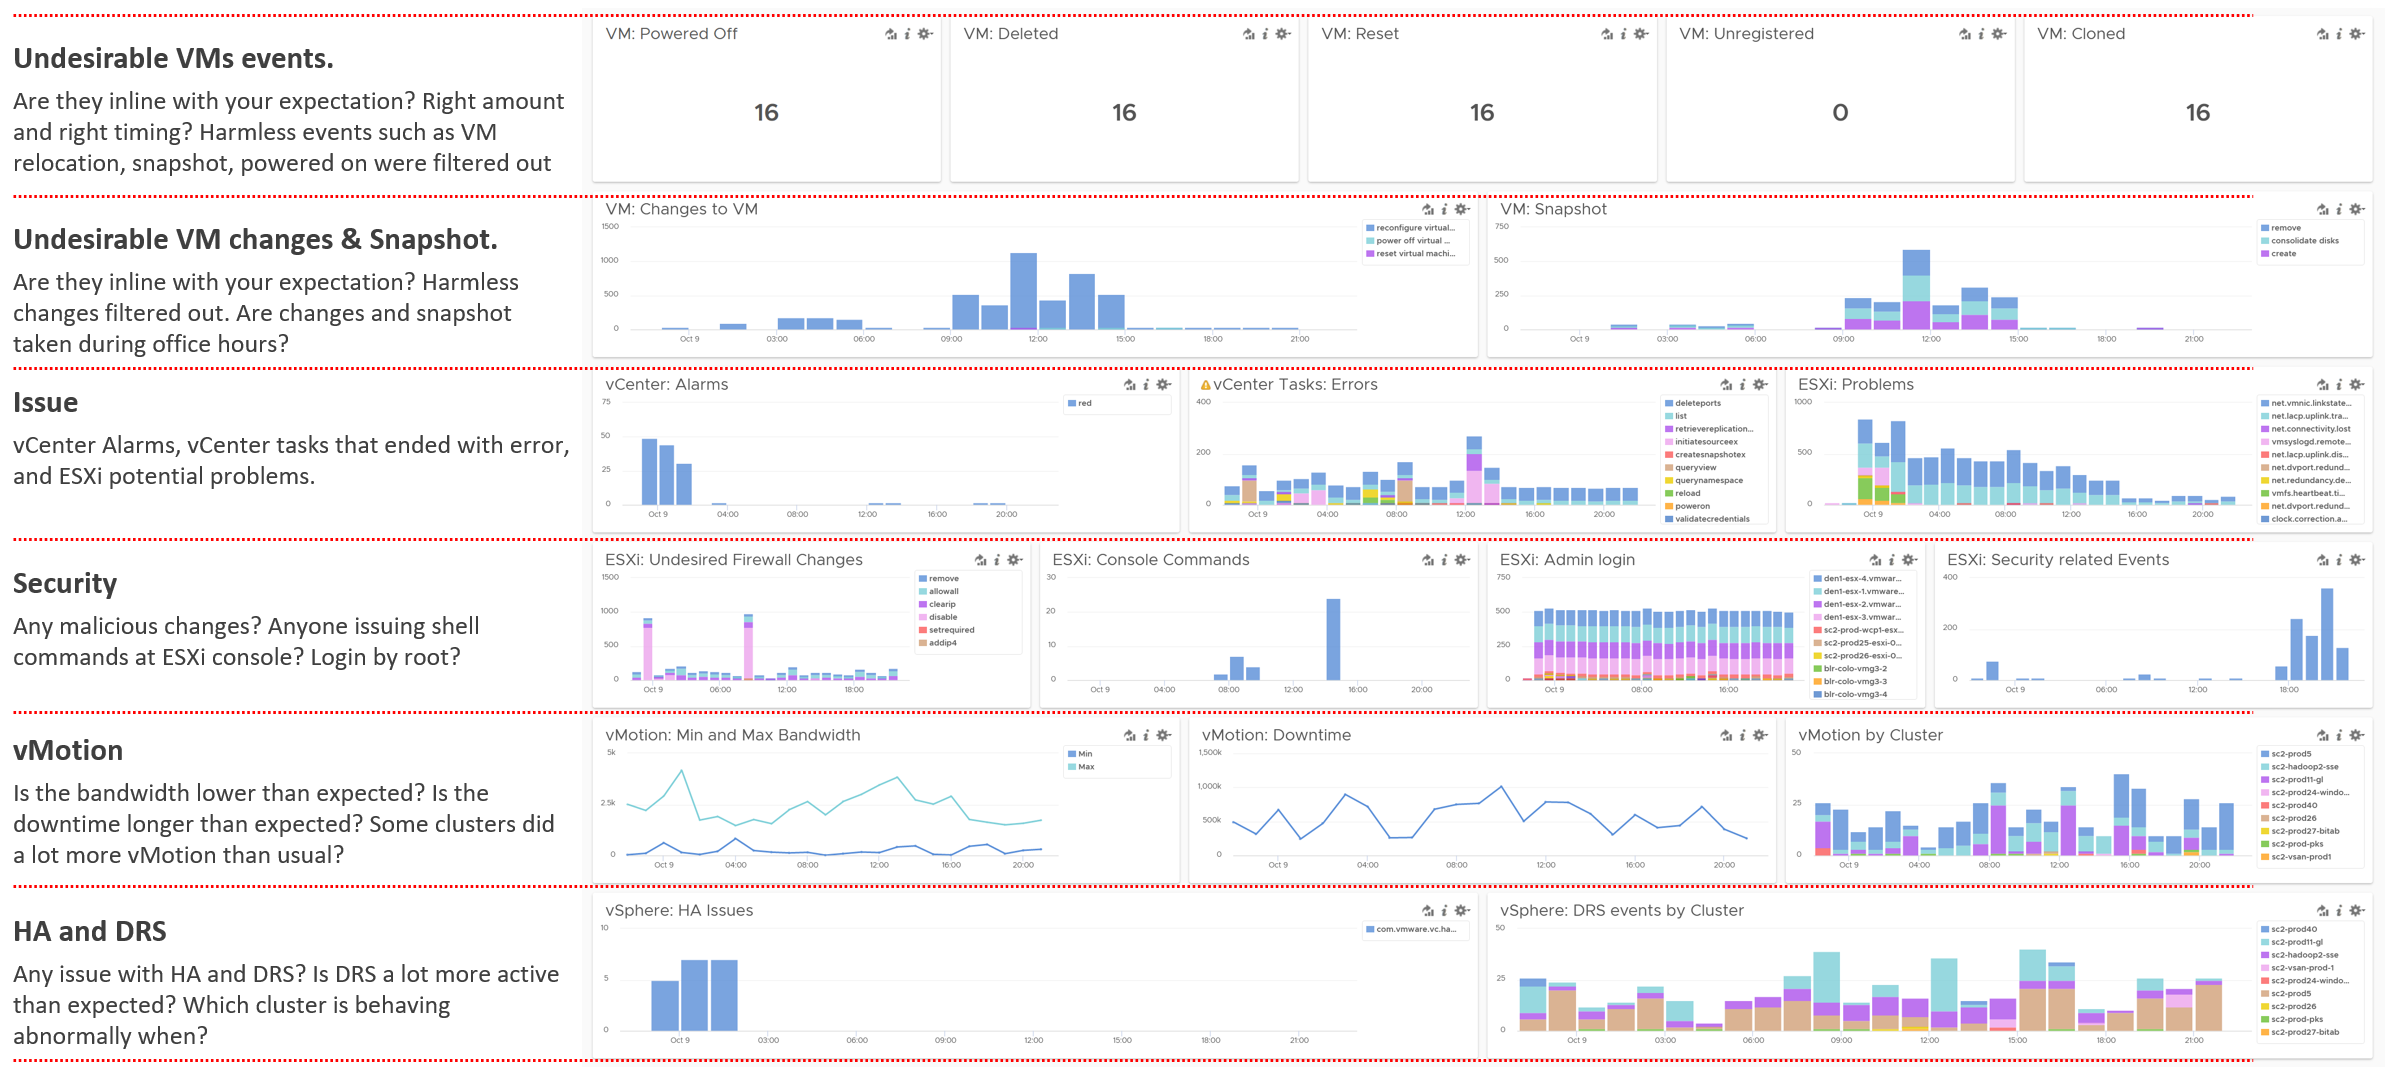
vSphere Daily Log Check
A lot of information is only available in the form of logs. Use a daily Log Insight dashboard to perform basic hygiene, such as:
-
Undesirable VMs events. Are they in line with your expectation? That means the correct amount and right timing. Harmless events such as VM relocation, snapshot, powered on were filtered out from the dashboard.
-
Undesirable VM changes & Snapshot. Are they in line with your expectation? Harmless changes filtered out. Are changes and snapshot taken during office hours?
-
Issue. vCenter Alarms, vCenter tasks that ended with error, and ESXi potential problems.
-
Security. Any malicious changes? Anyone issuing shell commands at ESXi console? Login by root?
-
vMotion. This is a leading indicator of a larger performance issue. Is the bandwidth lower than expected? Is the downtime longer than expected? Some clusters did a lot more vMotion than usual?
Business Applications
To be proactive, you need to know the critical business applications. They form a small percentage of your VM population. However, they are essential to the company revenue, profit or image. They are your crown jewel system.
Different industries have their own set of mission critical systems. If you are bank, it’s your Internet Banking. If you’re eCommerce, it’s your online portal.
In order to be proactive, you need to monitor these applications closely. Likely a few times a day, not just one time in the morning. The application team is watching their own system throughout the day, so you can’t afford to be blind to what’s happening from infrastructure viewpoint.
vSphere Folder Structure
The following structure shows Business Unit as the top folder. Each business unit can have 1 or more departments (Business Unit C spans 3 departments in the diagram below). Each department owns multiple business applications. A business application typically consists of multiple tiers (e.g. web tier, application tier, database tier). A tier is a group of VMs performing the same function, running the same set of software and have identical hardware configuration. You expect the VMs are either scale-out (farm) or active/passive.
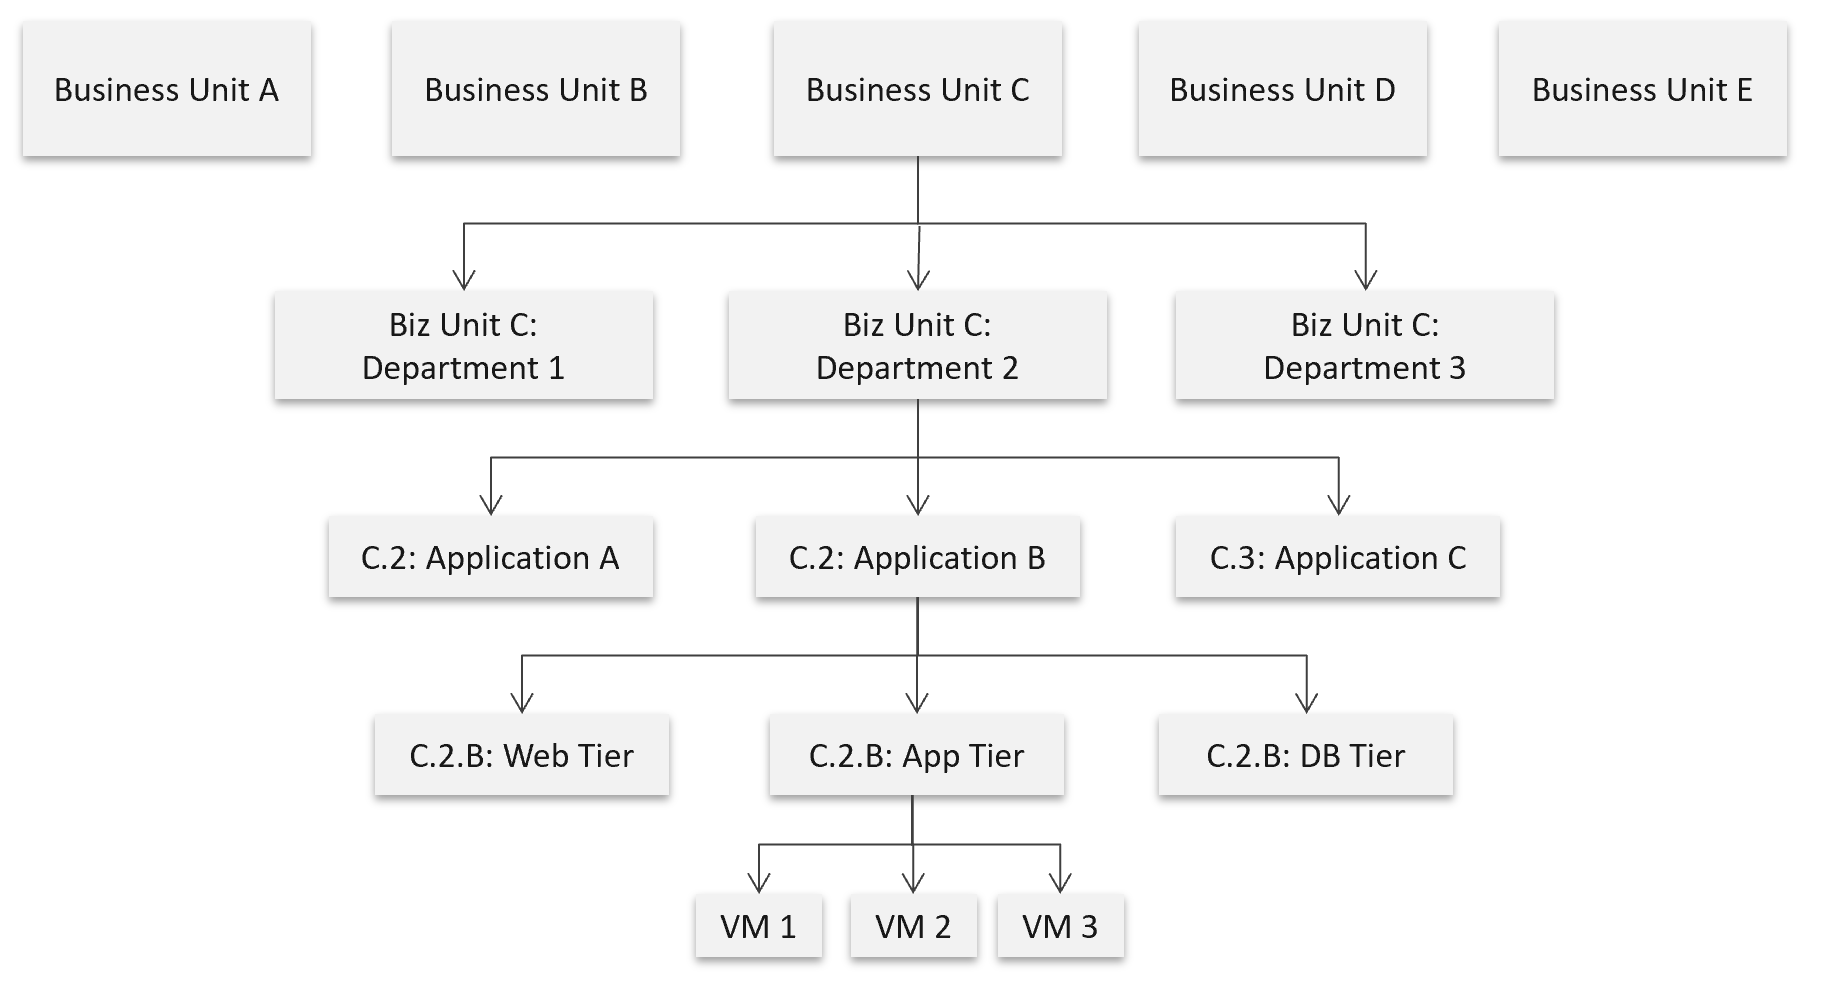
The limitation of the above is reorganisation. You will need to rename, move folders to the new parent folders, and delete folders that are no longer relevant. For example, if Business Unit B merges with Business Unit C and the combined entity has a new name, then you need to rename one of them, and delete the other. This is why I only have 2 levels of organisation in the above. Your goal is to have some level of context, not to replicate the entire organisation chart as that’s the job of HR department😊
The application name should be unique. If not, prefix with the department name.
The folder name needs to be unique, even across vCenter Servers. So, it’s paramount to have the application name as prefix.
If you have multiple vCenter servers, the name should be consistent across all of them.
Alert
What, exactly, is alert?
The 3R of alert:
| Rapid | The issue is urgent; hence you want to know the problem as soon as possible. If time is not an essence, then a daily SOP with dashboard is more effective as you can see the big picture. Avoid sending alerts to people that do not deal with day-to-day operations. Long term actions such as capacity management are best served with dashboard. Do not treat alert as To Do List. It is also not a Reminder |
|---|---|
| Real | Don’t confuse alert with symptom. If there is nothing wrong, there is no need to trigger an alert. That’s why in general you do not set up an alert on inventory changes, as inventory is merely an account of something. |
| Rare | If it happens too frequent, it will numb you. Alert focuses on exception, not the big picture. As a result, you want this to be minimal. If the whole house is on fire, it’s too late for an alert. |
What distinguish red criticality versus orange criticality versus yellow criticality?
The following diagram provides the answer:
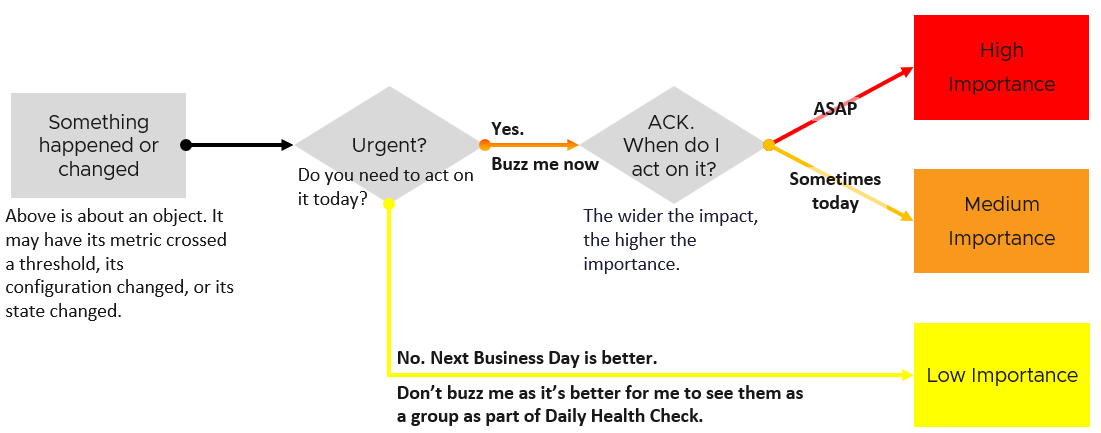
Let’s summarize how the colors translate into day-to-day operations:
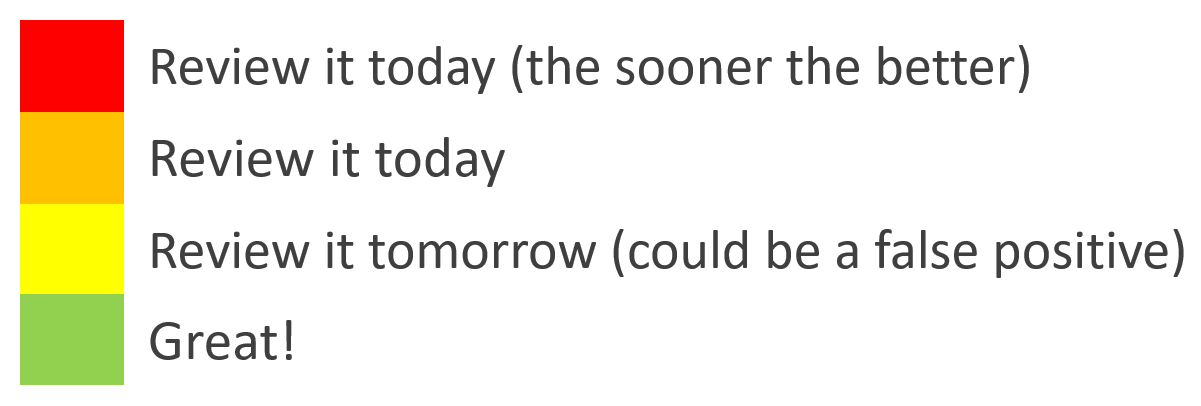
| Yellow | Symptom. Non urgent. Leading Indicators. Symptoms. Could be important, could also be false positive |
|---|---|
| Orange | Alert. Urgent, but importance is not high. Attend by end of day, do not delay until tomorrow. |
| Red | Alert. Urgent and important. However, it does not always mean you must drop everything you do and start firefighting in seconds. Attend within 1-2 hours. |
There is a subset of Red where you need to drop everything. Think of it as emergency. It may not be important, but it’s definitely urgent. If you get the alert at 0200 hours, you attend to it as you do not want to delay. An analogy we can relate in life is you accidently cut yourself. Even though it’s not life threatening, you want to stop the bleeding immediately, not 15 minutes later. The good part is such emergency situation rarely happens. There is no alert defined for it in VCF. |
Alerts Planning
Managing alerts is not the same as minimizing alerts. Managing is dealing with alerts that are already triggered. Minimizing takes us towards preventing alerts to begin with. Use insight to minimize alert definition, as alert should be reserved for urgent and important issue.
Your goal is to minimize alerts storm while providing the broadest coverage. This calls for a careful planning on the alert definition, symptom and threshold.
For each alert, ask yourself: what action must be taken, today, by the person seeing the alert?
-
If the answer is nothing, then why disturb the person today? He will be bombarded with early warnings. Dashboard gives better picture as it shows issues that are yet to breach the threshold.
-
If the answer is something, can that action be automated? If the answer is yes, then why do you want to be alerted? You should automate the response. Be careful of simplified logic as computer has no common sense. An automation that is not fool proof can result in a disaster.
If the answer is escalating to the next level (e.g. Level 2 support) after adding some context and initial analyzis, then it depends on the urgency. Generally speaking, L2 has longer timelines and need to see bigger picture. So the L1 frontliner may group the alerts into 1 instead of escalating each as isolated cases. If this is the case, help the L1 to see the big picture. A dashboard is more effective.
Target Persona: The Who
It is essential to design the alert for each persona. What is relevant for one may be irrelevant to others.
There are at least 3 main personas, with additional sub-personas:
-
Application team
-
Infrastructure team. This is the main persona, but it has at least the following sub-personas:
-
Network Team
-
Storage Team
-
-
Security team. They look at both, but purely from security perspective.
Class of Service: The What
Not all workloads are equal. The mission critical applications are certainly more important than its development version.
Classify your workload into 3:
-
Mission critical applications
-
Standard production
-
Test and Development
Having more than 3 can complicate operations.
Tailor the alerts according to the class of service. The higher the criticality, the lower the threshold. For example:
-
Mission Critical: VM Disk Latency > 30 ms for 5 minutes.
-
Standard Production: VM Disk Latency > 60 ms for 10 minutes.
-
Test and Development: VM Disk Latency > 120 ms for 10 minutes.
What to Alert
What areas do you want to monitor with alerts? What can you do to reduce the noise?
Define the types of problem for each pillar of operations. For each type, classify if an alert is needed or not.
| Availability | Proactive hardware replacement before reaching the manufacturing limit. For example, the SSD disk has limit of number of writes as each write introduces a wear and tear. The manufacturer has a number in mind for the endurance. If you have thousands of disks, you create a weekly dashboard just to track this limit and schedule proactive replacement for those disks nearing their limit. |
|---|---|
| Check the hardware temperature as heat is the #1 enemy of electronics. Okay, if you have water leakage you have a different problem | |
| Ensure software stack compatibility as versions incompatibility is known to cause outage. | |
| Have redundancy, so unplanned downtime triggers non-critical alerts so long it’s within the allowance set in the design. If you design N+1 availability, then a single downtime is not a red alert | |
| Trap soft errors. They are non-critical events that act as early warning. Treat them as insights. | |
| Performance | Minimize reactive operations not by using lower threshold as that will result in noise. Instead, track early warning metrics via insight. |
| For consumption type of alerts, only define red alert. Orange level is best covered by daily dashboard. | |
| For contention, suppress for low utilization, as likely the impact is not felt at the application level. Use CPU as the proxy for application. | |
| Daily check for sustained and high utilization, especially those trending upwards over time. | |
| Separate formal SLA (alert) with internal KPI (insight). | |
| Security | Security attack. If the attack is live, the alert screen needs to be accompanied by NOC screen. |
| Check for undesirable events | |
| Configuration | Only high-risk settings that cause urgent problems such as slow performance, outage, or security hacking. Non-urgent config issues are best managed via daily health check. |
| Compliance | Only the urgent one, where you cannot wait until tomorrow |
| Capacity | Only define red alert as it’s a guard rail. |
Alert should not replace operations best practices. For examples, you should ensure VMware Tools are up to date. If you set an alert for outdated VMware Tools, you become reactive and may get excessive alert. Since it’s not urgent, it’s better to have a daily SOP where you have a list of VMs with outdated VMware Tools. Make sure the list is empty.
Alert should be triggered on all affected objects, both the victims and the villain. It is common that a failure at the lowest ripples through the upper layers. For example, a physical disk failure in a vSAN cluster. This in turn can bring down an entire vSAN disk group. If the ESXi host has only 1 disk group, it can impact the host as it will have no storage.
What not to Alert
Do not set alert on issue that you can review the next day. You’re better off with a daily dashboard, as it lets you see the big picture.
| Availability | Backup failure. For example, you do nightly back up of 1000 VM and 1 fails. Since you still have the previous night backup, you don’t need to troubleshoot at night. The exception here is there are many VMs affected. |
|---|---|
| Cost | Nothing urgent. |
| Inventory | Since there is already a NOC screen tracking inventory volatility, you don’t need an alert here as inventory it’s merely an account of what you have. There is no good or bad. |
| Capacity | Reclamation and downsizing is best done via daily dashboard. This is often mistaken as performance problem, as high utilization is a common alert. |
| Configuration | Non-urgent issue, such as outdated VMware Tools. |
| Compliance | Non-urgent issue, such as non-security compliance to corporate standard. |
Examples of important but not urgent:
-
“Host is in maintenance mode for at least 72 hours” is not urgent as it’s been down for 3 full days. It’s important as that’s not normal.
-
“A recoverable memory error has occurred on the host” is not urgent as the issue has been recovered. You likely need to replace hardware. As the problem can spread, it’s an important one. You need to schedule a hardware scan, which may require a schedule downtime.
-
You notice vMotion has been taking 300% longer in the last 12 hours, going up from the usual 0.2s to 0.6x second in 10 large clusters, where a total of 10K production VMs are running. But it’s a low level issue that none of the app owners have not noticed. Not urgent, but important as it can potentially turn into a big problem.
-
You notice a performance problem that has happens randomly. It went away by itself within 5 minutes, so the owner kind of forgive your IaaS. But the problem hit VMs randomly, and it’s been going on a few times a day for a few days. Different owners are impacted so each does not really complain as each is rarely hit. You feel it’s risky to add more VMs.
Design
Design the alerts as a set.
-
Start with the 4 elements of infrastructure (CPU, memory, disk, and network). The reason is each has their own behaviour.
-
For each element, look at the entire set of objects being monitored, and design top down. Do both consumer objects and provider objects at the same time.
-
For each object, cover the 2 types of metrics: contention and consumption.
Once you have a list of alerts, validate with
-
Consistency check. Run through each object type, and review all the 4 elements of infrastructure to make sure they are correct.
-
Bottom-up scenarios. Ensure all the possibilities are captured.
Once you do the above, you will end up with an alert count for each.
The following shows the overall count of alerts for the top 5 objects in vSphere. The first 2 are consumer objects, and the last 3 are the primary provider objects.
Some objects have 2 alerts as we need to account for different problem (e.g. read vs write latency).
| Guest OS | VM | Res Pool | ESXi | Cluster | ||
|---|---|---|---|---|---|---|
| Contention | CPU | 1 | 1 | 1 | 1 | 1 |
| Memory | Not yet | 1 | 1 | 1 | 1 | |
| Disk | 1 | 2 | N/A | Not yet | Not yet | |
| Network | Not yet | 1 | N/A | 2 | Not yet | |
| Consumption | CPU | Not yet | 1 | N/A | 1 | 1 |
| Memory | Not yet | N/A (Guest OS) | N/A | 1 | 1 | |
| Disk | 1 | N/A | N/A | N/A | ||
| Network | Not yet | Not yet | N/A | Not yet | N/A |
Not yet = I’ve not implemented it yet. Some of the Guest OS alerts requires Telegraf agent.
N/A = alert is not applicable for this object as daily check or live NOC screen is better.
Let’s now add the last 4 objects in vSphere. They provide storage and network resources. Data Center is not included as it’s just a group from alerts design perspective.
| Type of Alerts | Datastore | Datastore Cluster | vSwitch | Port Group | |
|---|---|---|---|---|---|
| Contention | Disk | 0 | 2 | N/A | N/A |
| Network | N/A | N/A | N/A | 1 | |
| Consumption | Disk | 1 | Not yet | N/A | N/A |
| Network | N/A | N/A | N/A | N/A |
Alert Definition
There are 2 main approaches to define an alert.
| Generic Alert | Specific Alert | |
|---|---|---|
| What it is | It covers specific symptoms. The cause could be many. It’s symptom oriented. | It covers specific cause. It’s cause oriented. |
| Examples | VM did not get the CPU time it asked | VM had CPU contention due to CPU Co-stop caused by snapshots |
| VM had CPU contention due to CPU Co-stop caused by too many vCPUs | ||
| Strength | Alert name will be simpler | Alert name is more specific |
| Overall less alert definition | Action is clearer | |
| Weakness | Can’t tell the actual problem. For example, is it read or write latency? But do we need to know at this stage, since alert is just the tip of the iceberg? Can we pass this to Insight, where we can see more? | Very complex to design. It does not cover unknown cause. So we still need the catch all as the last resort. That means designing the alert is complex as the catch all typically contains certain traits. |
| Recommendation becomes a long list of possibilities. Can be solved by having a condition in recommendation itself, so it’s not a long list of irrelevant recommendation. The recommendation should contain live, clickable information instead of just plain text. | Most causes are not known, so this has limited use case. For example, we can’t prove that a snapshot is causing CPU contention or even disk latency. We only know probable cause, so we’re unable to prove the actual. We pray that we make some changes, and the problem goes away magically. | |
| Many known causes are due to misconfiguration. Why wait for an alert to address the incorrect config? Regular health checks should be provided. | ||
| Mostly only for Infrastructure Team. Not so suitable for VM Owner as she does not and should not care about underlying infrastructure problem. |
Threshold Design
Follow industry standard. For compliance, adhere to the relevant industry regulation.
Align with your promised SLA. If you do not have SLA with your customers, use your internal target.
Review the complaints (formal via ticket, or informal via your management chain).
Have many symptoms instead of a single and simple one.
- This sharpens the alert as it becomes narrower.
For contention, make sure the issue is both acute and sustained
-
Acute is sharp, lasting only 20 second but severe.
-
Sustained is average over 300 seconds.
-
Set the acute issue to be 4x higher over the sustained issue.
Make sure the contention alert does not occur at the point of very low utilisation, as there may not be meaningful business workload.
Design a consistent scaling within the context, so the relative urgency of red vs orange is maintained.
For example, Red is always 4x of orange. You can make red 2x as bad by modifying any 2 of the following:
-
2x the threshold. If orange uses 10 ms latency, then red is 20 ms.
-
2x the population. If orange impacts 10% of the VM, then red impacts 20%.
-
2x the time. If orange lasts for 5 minutes, then red is 10 minutes. I’m not in favour of this as I think it 0.5 hour makes more sense to operations team.
####### Wait Cycle
For contention, use 5 minutes. In cases where the metrics tend to have false positive, increase to 10 minutes.
For consumption, use 15 minutes.
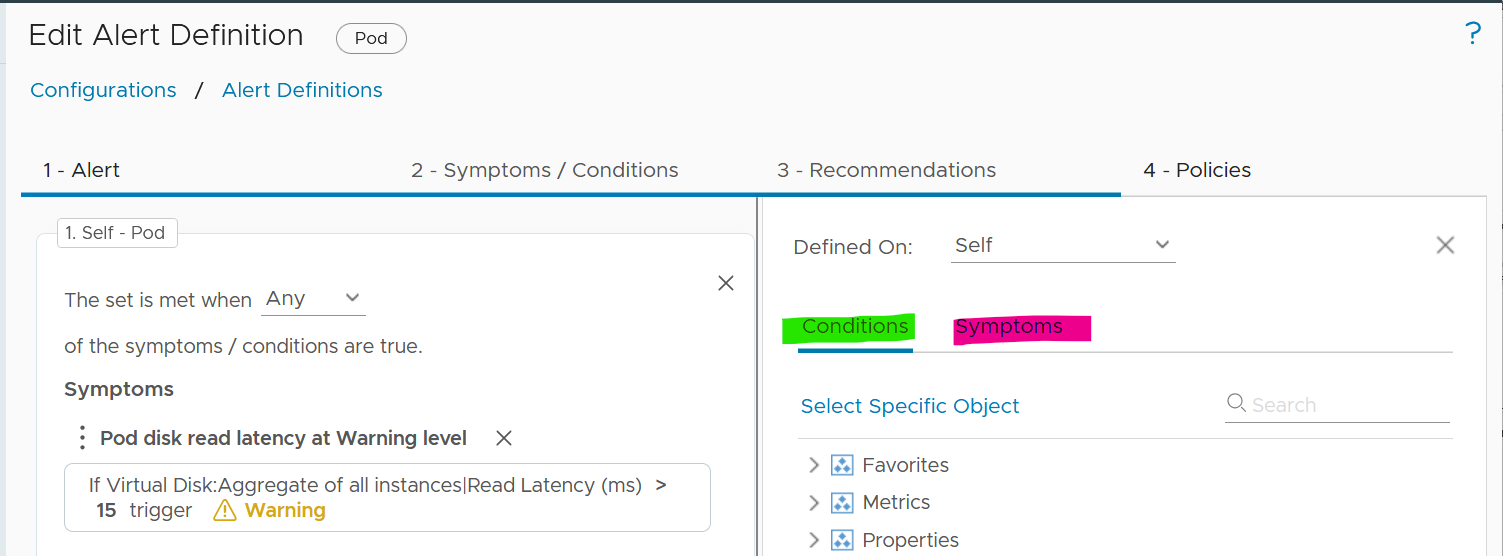
####### Conditions
Do not use Symptoms. Instead, use Conditions. Symptoms means lighter or small problems that do not warrant an alert. Think of it as you got a light body ache which would go away after resting.
Recommendation | Remediation
Recommendation is just a piece of advice. It does not have ability to change. Remediation, on the other hand, will execute change in your environment. Recommendation is safer as it’s not automated.
It’s hard to develop a great remediation, or complete-yet-concise recommendation. The reason is the root cause is typically far from the alert triggered. There are too many combinations. We need to stop thinking that IT products have good observability. IT systems actually have poor visibility into what happened. Can you troubleshoot when your web browser is slow even though your high-end laptop is fast and overall utilization is low?
No, you can’t. If you can’t troubleshoot a single PC, why do you expect we can troubleshoot something far more complex? Observability is always a second-class citizen in product development. Most products only have few meaningful metrics. Even if they do have the metrics, they don’t provide API. Even if they have, the metrics could be unreliable or buggy.
A good recommendation is clear. It needs to list its assumptions and explain the reason behind the recommendations.
In the ideal world, your alerts are fully automated. The problem is RCA today is largely an exercise of elimination. It is a process that requires human expertise on the architecture. For example, to troubleshoot Tanzu, you need to know K8 + vSphere + Tanzu specific implementation.
The reason why we have to resort to elimination exercise is the lower layer or stack does not carry information from upper stack. For example, ESXi SCSI commands can’t be traced to specific VM.
Maybe one day we can have AI-assisted troubleshooting. I envisage the human expert “records” the steps. This becomes the training dataset.
Application Team
We start with Guest OS as this is the closest layer to the application. This alert is for someone responsible for the application, running on top of Windows or Linux. It is not relevant to the infrastructure team.
Guest OS Alerts
Since performance problem can happen within Guest OS, independently of virtualization, you need to monitor within this layer. The goal is to proactively manage performance before business is affected. The challenge happens when there is no application level or user transaction level monitoring. Another word, the application team simply rely on complaint. The problem with complaint is it’s highly subjective. The correlation to technical counters is both weak and unpredictable.
CPU Contention
| Goal | The CPU Run Queue is relatively less known due to the focus on CPU Utilization. This alert is likely independent of the underlying virtualization layer due to the nature of some applications which spawn excessive threads. Demonstrate to application team or VM owner that the IaaS team has visibility into Windows or Linux. |
|---|---|
| Red Condition | All these conditions must be met for 15 minutes:
|
| Orange Condition | This is not provided to reduce noise. If you need to set, follow these:
|
| Design Consideration | As the CPU Queue counter is known to have false positives, we increase the wait cycle to 15 minutes, and add Net Run to ensure it only happens when there is sufficiently high workload. |
| The alert works together with the VM CPU Utilization alert and VM CPU Contention alert. Use these 3 alerts together. | |
| Remediation1 | If the alert of high VM CPU contention is also triggered, then follow the remediation for this alert. |
| If the alert of high VM CPU consumption is also triggered, then follow the remediation for this alert. | |
If the above 2 are false, look at the application on why it’s creating many threads. Compare the values with other software or code that are part of the larger business applications. Also, compare the value with the same software in other business applications. If the software is a commercial software from IT vendor, ask the vendor for their recommendation as the maker of that product. If you do not get the answer, exclude this application from this alert. |
Thanks Darren Farrer for the collaboration.↩︎
Disk Contention Alert
| Red Condition | All these conditions must be met for 5 minutes:
|
|---|---|
| Orange Condition | All these conditions must be met for 5 minutes:
|
| Design Consideration | There is no official guidance from either operating system. This alert is set at relatively high number, so adjust as you deem appropriate |
| If you have excessive false positive, disable the orange condition. |
Other Contention Alerts
What other performance problems can exist only within the Guest OS, which is not caused by underlying virtualization? There are many possibilities. I’m not creating alerts as their threshold vary wildly by applications.
You should create your own alerts for the following:
-
Check if CPU Context Switch is consistently high. Inform developers that this could cause application performance problem. If the VM CPU Net Run is low, and run queue is low, then reduced the vCPU size.
-
Heavy memory paging, coupled with high amount of page fault.
-
High number of outstanding disk operations.
-
Network dropped packet. Note this requires Telegraf agent.
Consumption
There is no alert defined, as it could result in false positive.
There are, however, proactive check you can do:
-
Check CPU Usage Disparity. If it’s consistently high, discuss with VM Owner on why application unable to use all vCPU equally. Reduce size if not required, especially if CPU Context Switch is high and run queue is low.
-
Check free memory. If it’s consistently near 0 MB, coupled with moderate or high amount of paging, discuss with VM Owner if this impacts performance. Do application-level benchmarking before and after as too much memory can negate performance.
-
Low disk space. Not yet implemented as certain partitions such as swap is always near 100%. This cannot be implemented at VM virtual disk layer.
VM Alerts
In overcommit environment, a VM can experience contention. How do you balance between application team catching this alert, and infrastructure team to address the issue first?
The balancing will minimize blamestorming. Some techniques:
-
Avoid using the orange alert. So it’s only red. You keep the orange for the infrastructure team, so they have a heads up.
-
Use a higher threshold. For example, you set CPU Ready > 8% for application team and > 6% for infrastructure team.
Alert at infrastructure level, such as ESXi, is not relevant.
CPU Alerts
Design the CPU alerts as a set. That means cover all objects, and for each object, cover both contention and consumption. The contention alert and utilization alert should be used together. Especially for consumer, where capacity can be increased at a moment notice, increasing capacity when there is contention will result in inferior performance.
Contention Alerts
VM and IaaS have different perspective. For the shared infrastructure, the alert should focus on population issue, as opposed to just a small subset of VMs. We use 25% of VM population as the overall threshold. As this can mean hundreds of VM, we choose a lower threshold per VM.
This means ESXi, Resource Pool and Cluster. Data Center is not added as it can consists of clusters of different purposes.
VM Contention
| Red Condition | All these conditions must be met:
|
|---|---|
| Orange Condition | All these conditions must be met:
|
| Design Consideration | An absolute unit is used for CPU utilization as opposed to relative (%) as a small percentage of a monster VM could still be sizable |
| Remediation | This is complex. See the diagram at the start of CPU Alert section. |
Infrastructure Contention
| Red Condition | All these conditions must be met:
|
|---|---|
| Orange Condition | All these conditions must be met:
|
| Design Consideration | For cluster, we measure directly at VM level so it’s closer to what we care, which is the application. Aggregating from ESXi is less accurate. |
| For resource pool, the symptom does not work with cascading RP. Stacking RP on top of RP complicates operations. | |
| Remediation | This is complex. See the diagram at the start of CPU Alert section. |
Consumption Alerts
Utilization alert is tricky to define as high utilization could mean good or bad.
VM Consumption
| Goal | High utilization could cause business performance, especially for online workload where end users expect a “real time” response time. |
|---|---|
| Red Condition | All these conditions must be met for 15 minutes:
|
| Orange Condition | There is no orange alert as it will create more false positives. |
| Design Consideration | 15 minutes is used instead of 5 to reduce false positive. Take note this means you will lose 15 minutes. |
| Added Guest OS CPU Queue to ensure that there is actual bottleneck, as opposed to running optimally. This should result in a more meaningful alert. | |
| Remediation | Find out the nature of the application. If it’s batch job, the CPU Net Run could be sustaining at >95% for the entire duration of the batch run. So long the job is completed within the expected window, this is a healthy behaviour. Exclude this application from this alert. |
Find out from application team what metrics at application-layer or business transaction layer are proving that there is queue and latency. If the pattern matches the number at the infrastructure layer, then add vCPU. In the event you decide to add CPU, make sure it’s NUMA compliant. |
Infrastructure Consumption
| Red Condition | All these conditions must be met for 10 minutes:
|
|---|---|
| Orange Condition | There is no orange alert as it will create more false positives. |
| Design Consideration | As this is a provider, the focus is on capacity management, not performance. Space, not speed. That’s why counter such as Usage is not used. |
The threshold is not that high as we need to consider HA. Ideally, we should add the HA buffer into the threshold dynamically. If this results in excessive noise, increase the threshold to 50% and 100%. | |
| It is not set for Resource Pool as its use case varies. | |
| For cluster, it’s simply based on > 25% of ESXi members of the cluster |
Memory Alerts
Design the memory alerts as a set. That means cover all objects, and for each object, cover both contention and consumption.
Contention Alerts
Memory performance is hard to trace. The memory contention can be come from different factors. We can’t distinguish how much each part contributes. For example, VM 001 has 51% memory contention. This could be due to:
-
5 MB was limited Limit.
-
1 MB was swapped.
-
2 MB was compressed.
-
Low shares setting played a part.
VM Contention
| Red Condition | All these conditions must be met:
|
|---|---|
| Orange Condition | All these conditions must be met:
|
| Design Consideration | An absolute unit is used for CPU utilization as opposed to relative (%) as a small percentage of a monster VM could still be sizable |
Infrastructure Contention
| Red Condition | All these conditions must be met:
|
|---|---|
| Orange Condition | All these conditions must be met:
|
| Design Consideration | For cluster, we measure directly at VM level so it’s closer to what we care, which is the application. Aggregating from ESXi is less accurate. |
| For resource pool, the symptom does not work with cascading RP. Stacking RP on top of RP complicates operations. |
Consumption Alerts
There is no alert set at VM level as VM is just a motherboard.
There is no alert set at Guest OS level as it varies per application.
Infrastructure Consumption
| Red Condition | All these conditions must be met:
|
|---|---|
| Orange Condition | There is no orange alert as it will create more false positives. |
| Design Consideration | 10 minutes is used instead of 5 to reduce false positive. Take note this means you get notified later. |
| Balloon is set in an absolute term (10 MB) and not relative to the ESXi memory consumed so the impact is standardized. | |
| Swap and Compressed are not included so that alerts are triggered earlier, as remediation action, such as reducing demand, can take hours or days to complete. | |
| It’s set at 50% of host members as clusters are mostly <20 hosts, and memory functions as cache (so more does not mean it’s slow) |
Storage Alerts
Design the storage alerts as a set. That means cover all objects, and for each object, cover both contention and consumption.
Contention Alerts
Read latency and write latency are separated as their causes are typically different. The remediation actions likely differ as a result.
VM Contention
| Red Condition | For read latency, all these conditions must be met:
|
|---|---|
For write latency, all these conditions must be met:
| |
| Orange Condition | For read latency, all these conditions must be met:
|
For write latency, all these conditions must be met:
| |
| Design Consideration | Due to difference between vendor best practice and reality in customer environment, we set the wait cycle to 10 minutes and increase the threshold. In theory I agree we should pick a lower number, but in reality, there is hardly any complaint. Try to convince your boss to invest when there is no complaint 😉 |
| The 20-second peak cover both read and write. Yes, this is a known limitation. | |
| CPU Usage and Disk IOPS are added to reduce the alerts during low activity. The idea is business impact could be negligible during low disk activity. |
Infrastructure Contention
Not yet implemented. The reason is the many:many relationship between VM and datastore makes it impossible for us to set condition at VM level.
If you create, use these as a guide:
>25% of VM population has latency > 10 ms AND highest VM latency > 40 ms AND Overall Datastore Latency > 5 ms.
Consumption Alerts
Storage consumption covers both capacity (disk space) and performance (IOPS and throughput). Performance is hard to quantify due to the lack of “100%”. The ceiling is hard to define.
| Object | Threshold for Red level |
|----|----|
| Datastore | Used space > 90%. |
| Datastore Cluster | Not yet implemented. It needs to trigger when a member datastore has > 90% used. The remediation is to trigger storage DRS. |
Network Alerts
Consumption alert is hard to quantify due to the lack of “100%”. The ceiling is hard to define.
Contention Alerts
| Object | Threshold for Red level |
|---|---|
| VM | Transmitted packet drop > 4% and |
| In future the threshold should be relative to packets transmitted. 4% is a high threshold as that means 1 in 40 packets were dropped. However, since it happens within a 20-second period, it is set high. | |
| Orange alert is not set to minimize alert storm. Dropped packets are typically retransmitted, so users do not experience problem. So the ratio is always 100%. | |
| ESXi | Transmitted packet drop > 50 packets for virtual network |
| Transmitted packet drop > 50 packets for physical network | |
| Distributed Port Group | Red alert: Dropped packet > 10% Orange alert is not implemented due to false positive. In future I will change to transmit only. |
| Distributed Switch | Likely not applicable, as it’s just a group of ESXi and port groups. |