Configuration
Part 2 Chapter 6
The configuration dashboards aims to implement the concept covered in Configuration Management chapter.
Overall Design
Use the Configuration dashboards to view the key configuration in your VCF environment, especially for areas that need attention.
The suite of dashboards works together as one integrated set. They also have similar design.
| Goals | Address configuration issues before they cause impact |
|---|---|
| In the event of issues, check configuration to see if it plays a part. | |
| Questions | Are the configuration matching best practices? |
| Are the settings consistent when they have and up to date as per our plan? | |
| Do we have undesirable drifts? | |
| Assumptions | You have the enterprise standard and policy documented. |
| Target Users | Platform Team |
| Usage frequency | Daily, for urgent settings |
| Weekly, for non-urgent settings. | |
| Features | Show the configuration that needs attention first, before showing overall configuration. The idea is to drive action towards optimizing configuration. |
| Balance ease of use, performance (loading time of the dashboard page) and completeness of configuration check. As a result, you may not be able to show all settings of desired objects. Lack of screen real estate is another consideration behind the design |
The current dashboards are:
| VM Configuration | These 2 dashboards work together. The 2nd dashboard is created as the dashboard was simply too large, impacting usability. |
|---|---|
| VM Storage Configuration | |
| ESXi Configuration | These 2 dashboards work together. The 2nd one is prefixed with vSphere as the word cluster is a generic English word. Ideally, there is a drill down from cluster dashboard to ESXi. However, that will increase complexity in the user interface. |
| vSphere Cluster Configuration | |
| vSphere Resource Management | This needs to be a separate dashboard as the configuration spans VM, resource pool and clusters. The flexibility and complexity warrant a dedicated dashboard to help you optimize. |
| vSphere Network Configuration | These are basic dashboards. In future, I’d enhance them. |
| vSAN Configuration |
In some dashboards, there are simply too many configuration items to check than the screen real estate provides. If you have a larger screen, add the additional check as you deem fit, or add legends to the pie-charts.
In a large environment, create a filter for this dashboard. Group by the class of services such as, Gold, silver, and bronze. Default the selection to Gold. In this way, your monitoring is not cluttered with less critical workloads.
Resource Management
[e1: this section is draft]
Consumer Dashboards
The VM Configuration dashboard and the VM Storage Configuration dashboard were designed to highlight the settings that you need to fix or improve. To balance usability, it does not show every single setting.
How to Use
Select a data center from the Data center table
-
In a large environment, loading thousands of VMs increase the web page loading time. As a result, the VM is grouped by data center. In addition, it may make sense to review the VM configuration per data center.
-
For a small environment, the vSphere World is provided so you can see all the VMs in the environment.
The dashboard is organized into 3 sections for ease of use.
- All 3 sections will automatically display the VM configuration in the selected data center
The first section covers limit, share and reservation
- Limit should not be used, as explained previously here.
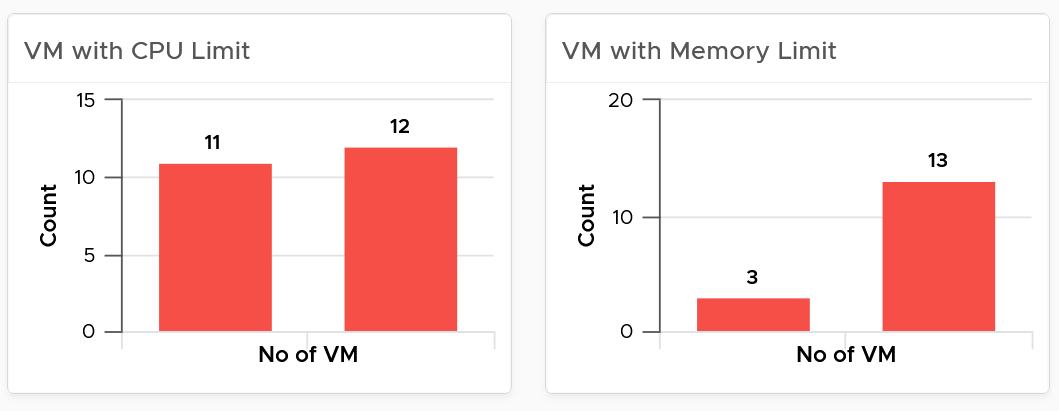
- Their share and reservation values can easily become inconsistent among VMs, especially in an environment with multiple vCenter Servers. The following shows an environment with far too many variations in shares.
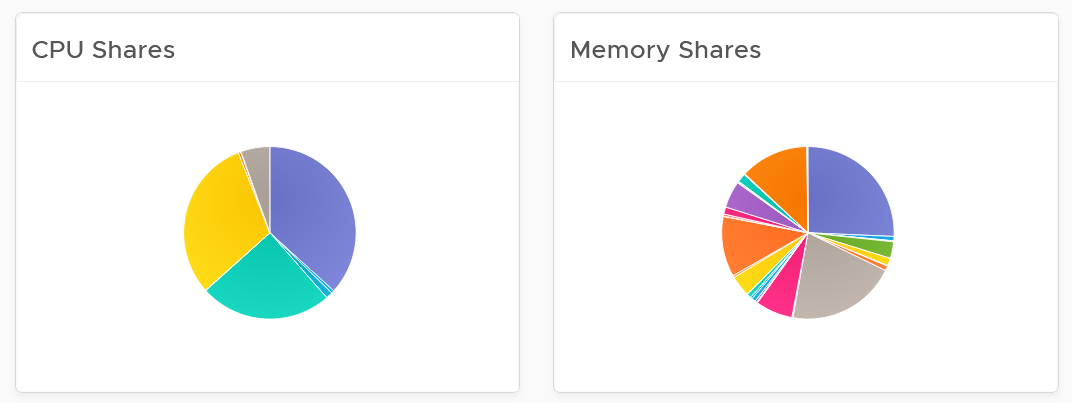
-
Shares should be mapped to a service level, to provide a larger proportion of shared resources to those VMs who pay more. This means that you should only have as many shares as your service levels. If your IaaS provides Gold, silver, and bronze, then you should have only three types of shares.
-
The value of share is relative. If you move a VM from one cluster to another (be it in the same or different vCenter Server), you may have to adjust the shares.
-
Reservation impacts your capacity. Memory reservation works differently from CPU reservation, it’s more permanent.
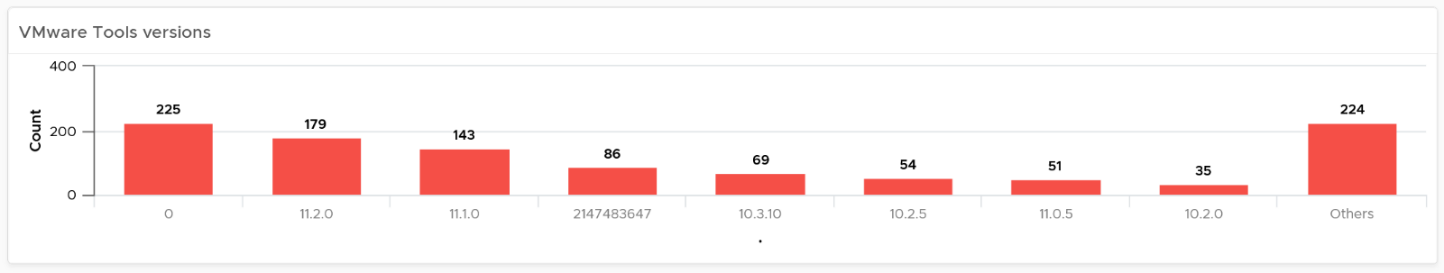
The second section covers VMware Tools
-
Tools is a key component of any VM, and should be kept running and up to date.
-
The distribution chart shows the various versions. You should keep them minimal
The third section covers other VM key configuration
-
Keep the configuration consistent by minimizing variants. This helps to reduce complexity.
-
Pay attention to VMs with many virtual disks or many virtual network cards.
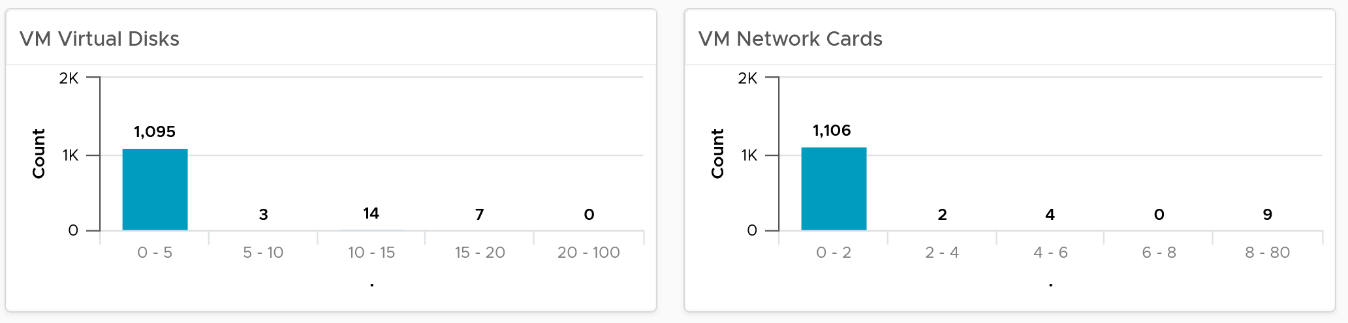
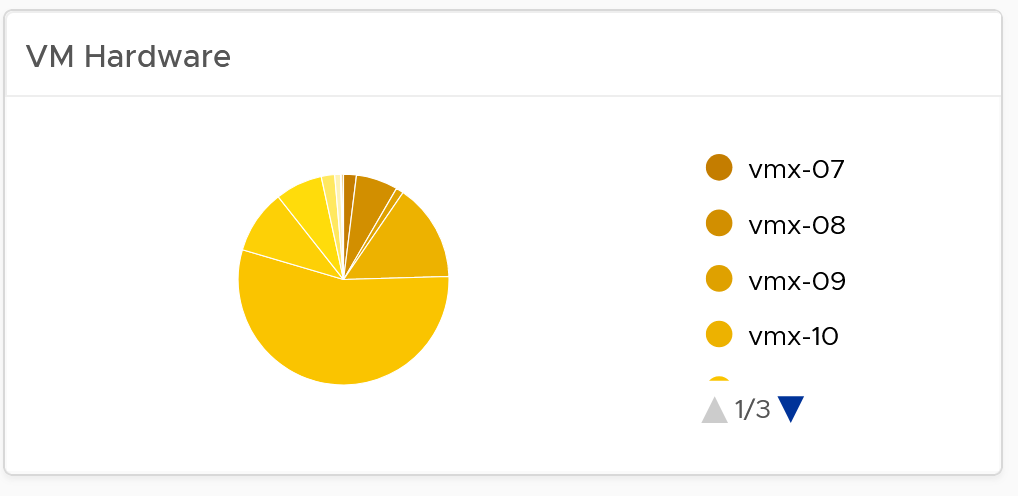
- Keep the number of VM hardware versions minimal, and keep them current.
- VM Network Card widget. It you suspect your environment may have VM with no NIC card, consider adding it as dedicated bucket.
The last part of the dashboard is collapsed by default.
-
It shows all the VMs with their key configuration.
-
You can sort the columns and export the result into spreadsheet for further analyzis.
ESXi Configuration
The dashboard is organized into sections for ease of use.
The upper part of the dashboard displays basic ESXi configurations that should be standardized for ease of operations.
-
There are six pie-charts that are displayed as one set because there is a relationship in their values. There should be a correlation between them. Ideally, the ESXi version, the ESXi build, and the BIOS should be identical across all ESXi hosts in a cluster”. Keep the variations of hardware model, NIC speed, and storage path minimal. The more complex the pie chart, the more variants you have. This results in complex operations, potentially resulting in increased OPEX.
-
The configurations should reflect your current architecture standard. Each pie-chart counts the occurrence of a particular value. A large slice signifies that the value is the most common value, and if that is not your current standard, then you must address it.
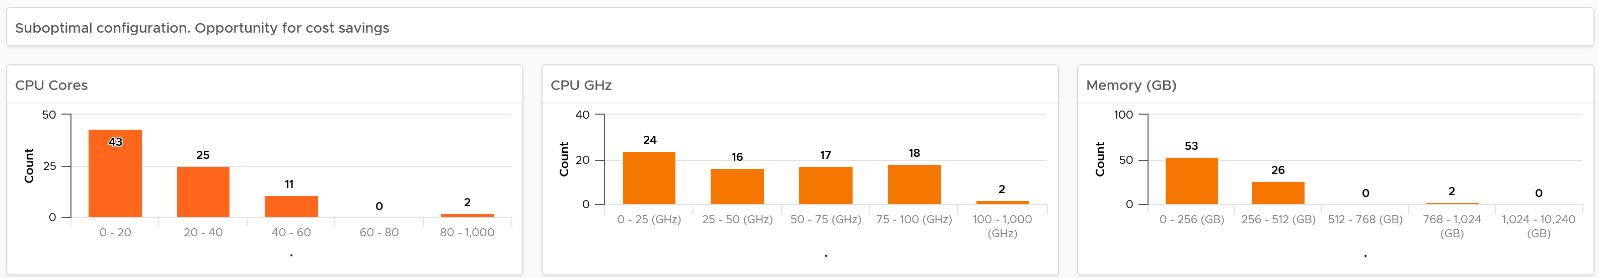
The second section of the dashboard displays configurations that are potentially suboptimal.
-
The three bar-charts display various size dimensions of the ESXi hosts. The bar-charts are designed to be seen as one set. Ensure minimal number of variations to reduce complexity.
-
Smaller ESXi hosts have a relatively higher overhead, and are limited in running larger VMs. If they have a low core count, they could be using outdated CPU. Small ESXi hosts are more expensive on a per core, per GB, per rack unit basis than larger ones if they occupy the same space. On the other hand, a 4-CPU socket ESXi host is likely to be too large, resulting in a concentration risk (too many VMs in a single ESXi host). Maintain a good balance that balance your budget and risk constraints . You should adjust the distribution chart bucket size to fit your environment.
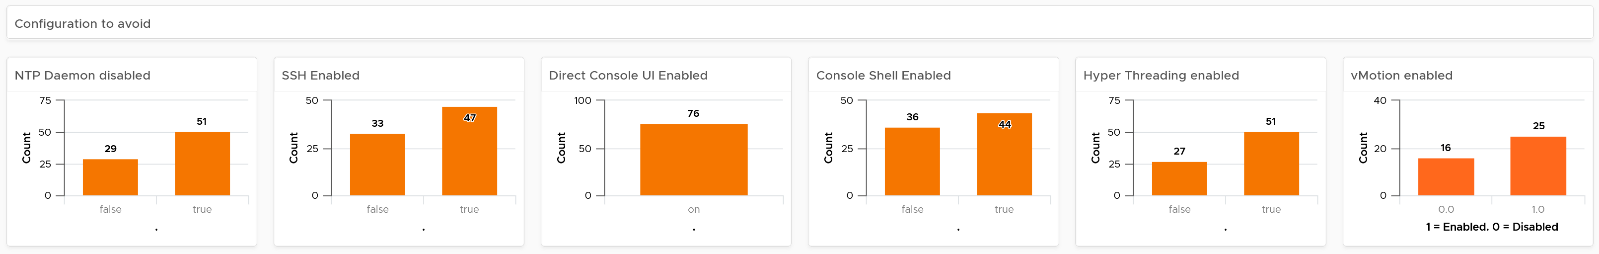
The third section of the dashboard displays configurations that you may want to avoid.
-
The six bar-charts focus on security, availability, and capacity settings that you can set as a standard. For example, you should consider enabling the NTP daemon for consistent time, which is critical for logging and troubleshooting.
-
The three tables list the actual ESXi hosts that are in a non-productive state. They can be in maintenance mode, powered off, or in a disconnected state.
-
BTW, I’ve modified the last one to show information, to show an example if that makes sense for your operations. I do not do it for the out of the box version as visually it will look awkward as the first 5 charts do not need it 😊
The last part displays all the ESXi hosts in your environment.
-
You can sort the columns and export the result into spreadsheet for further analyzis.
-
Some of the columns are color coded to facilitate quick reviews. Adjust their threshold to either reflect your current situation or your desired ideal state
Cluster Configuration
The dashboard is organized into sections for ease of use.
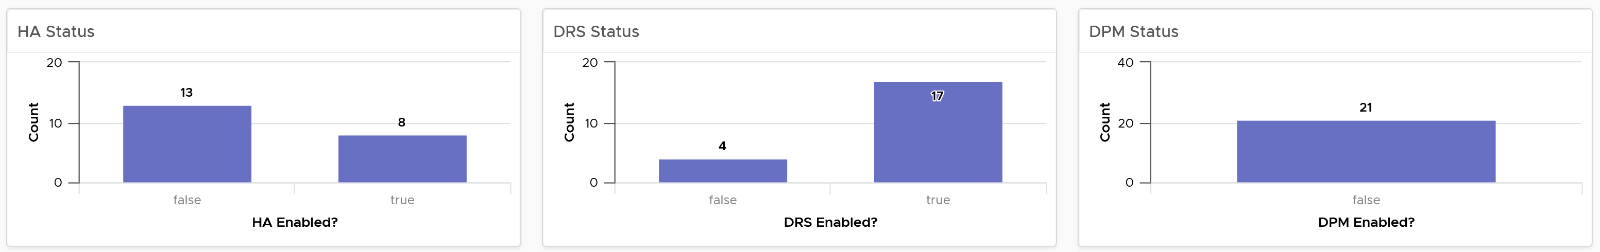
The first section shows 3 bar charts. They correspond to the 3 main features of vSphere clusters, namely High Availability HA, Dynamic Resource Scheduler DRS and Distributed Power Management DPM.
-
HA: The best practice is to enable HA admission control. You can specify the Admission Control Policy in vCenter and the threshold for failover shares.
-
DRS: The best practice is to have DRS enabled. Think of a vSphere cluster as a single logical computer that balance within itself.
-
DPM: The best practice is to enable DPM in an environment where environmental concern is the top priority or the high peak rarely occurs (most of the time You are running very low utilization).
The second section of the dashboard shows 8 pie charts. They show the relative distribution of key configurations.
-
2 bar charts cover Admission Control. You should enable admission control. The pie chart displays the policy code instead of the policy name, as it is based on the property Cluster Configuration | Das Configuration | Active Admission Control Policy.
-
2 bar charts cover the HA Failover Share, one for CPU and one for memory.
-
2 bar charts cover DRS setting. Generally speaking, you want to have DRS fully automated, meaning no operator intervention is required for both initial VM placement and subsequent load balancing, but with a moderate migration threshold (value = 3.0). The value range from 1.0 to 5.0.
-
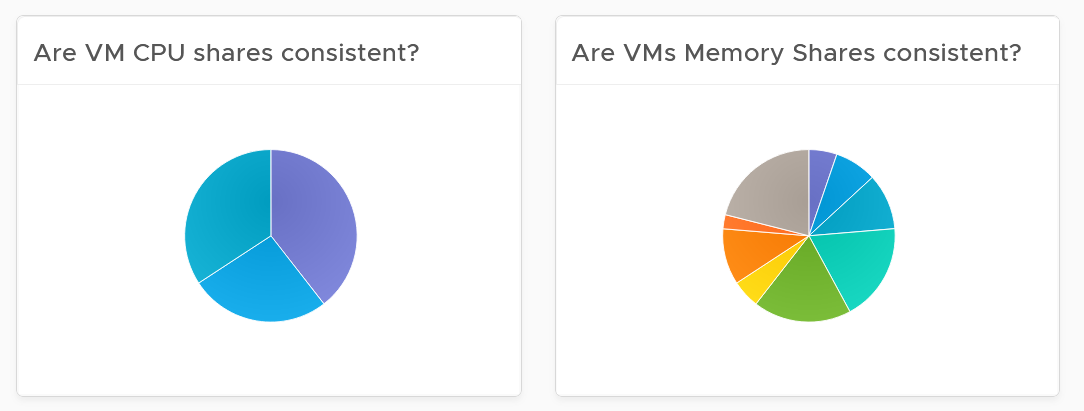
There are 2 pie charts showing reservation, one for CPU and one for memory. Minimize the total reservation value as it prevents overcommit of resources and hence results in a less optimal utilization. Memory reservation can remain and occupy the memory space of the ESXi host even though the VM does not use the memory anymore. Consider the analogy of unused files that you have not opened for months in your laptop c:\ drive. They still take up space of the hard disk. Keep the number of distinct shares below three (or at a minimum), matching the distinct classes of service.
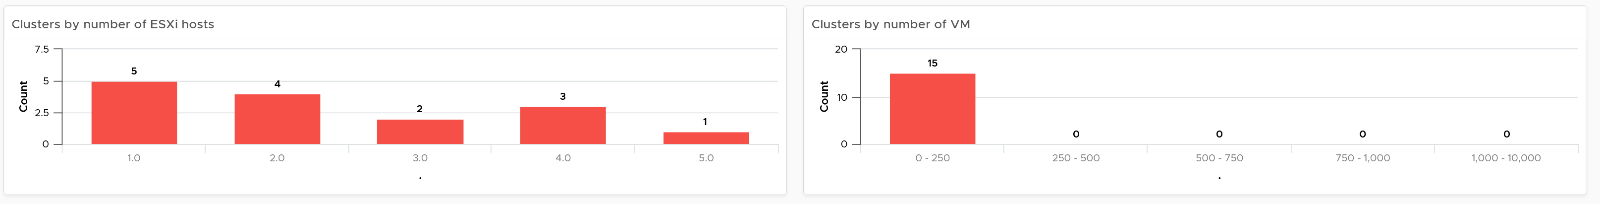
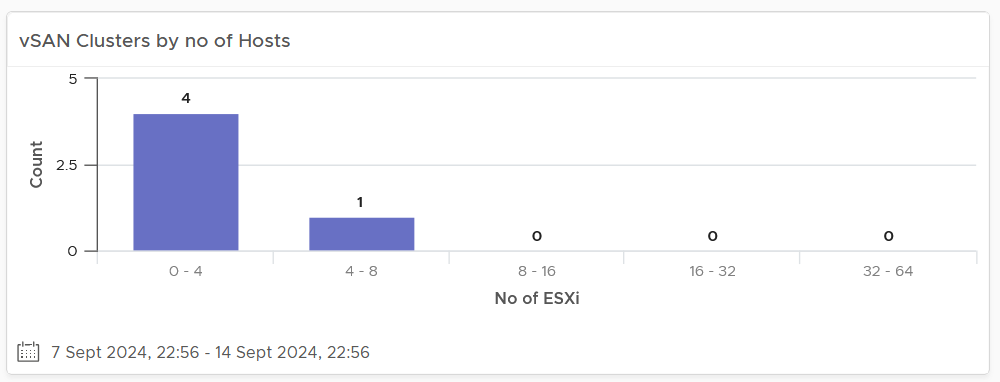
The third section of the dashboard shows 2 bar charts. They show the absolute distribution of cluster.
-
The first shows the cluster grouped by the number of ESXi Hosts. Ensure this matches your plan and cluster sizing standards.
-
Small clusters (defined as having less ESXi hosts) have higher overhead while large clusters have a higher risk in case of cluster-wide outages. For large cluster, have a disaster recovery plan an unexpected cluster-wide outage can impact many VMs.
-
Performance risk is lower in large clusters partly because there are more nodes that DRS can tap on, but if there is an actual problem troubleshooting can be harder (because there are more nodes to analyze).
-
In large environment, small clusters can result in cluster sprawl.
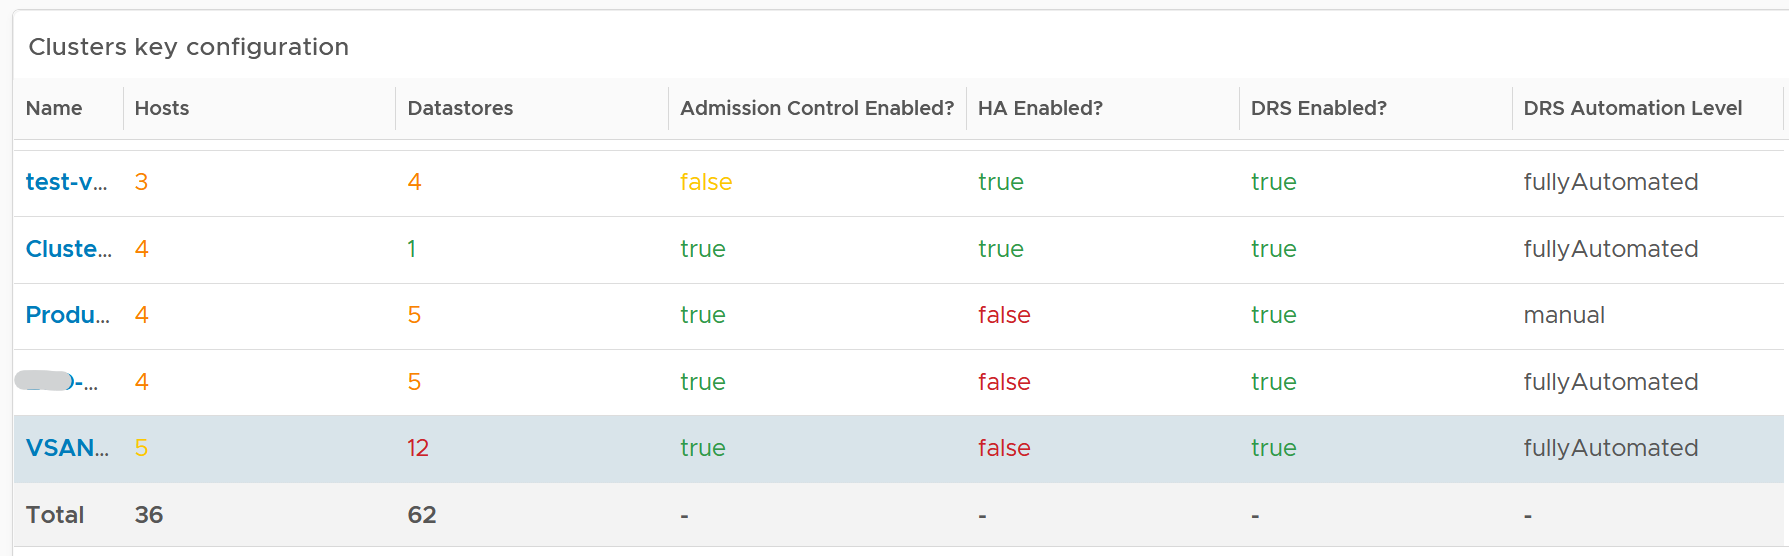
The fourth section of the dashboard lets you drill down into individual cluster.
-
It begins with a table listing all the clusters with their key configuration. You can export this list as a spreadsheet for further analyzis or reporting.
-
Select a cluster. The list of ESXi Hosts under the cluster, along with shares and resource pools information, is automatically filled up. Ensure as all its ESXi Hosts have identical configuration.
-
Keep the number of distinct shares below three (or at minimum), matching the distinct classes of service. You should avoid giving different service level to individual VMs as that increase the complexity of the cluster performance.
-
Verify that Shares are used consistently throughout your entire vSphere environment. Do note that they are relative numbers, not absolute. Ideally, avoid using it altogether as it's easy to overlook. When you move VM to another cluster or vCenter, you may forget to set the new share appropriately.
-
Keep the number of resource pools minimal. Resource Pools can impact performance, if the number of VMs in the pool do not match its intended shares. The new Scalable Shares feature in vSphere 7 automates this adjustment, which has to be done in older version. More about it here.
-
Some of the columns are color coded to facilitate quick reviews. Adjust their threshold to either reflect your current situation or your desired ideal state
Points to Note
-
You might notice that the DRS Migration Threshold widget is using the property DRS vMotion Rate. This is the correct property. We will correct the property name so it’s less confusing.
-
The HA Memory Failover Shares widget should be named HA Memory Failover percentage. This is a known typo.
-
The HA CPU Failover Shares widget should be named HA CPU Failover percentage. This is a known typo.
Network Configuration
For a more complete visibility, consider adding physical network device monitoring by using the appropriate management pack. More info here.
The dashboard is organized into 2 sections for ease of use.
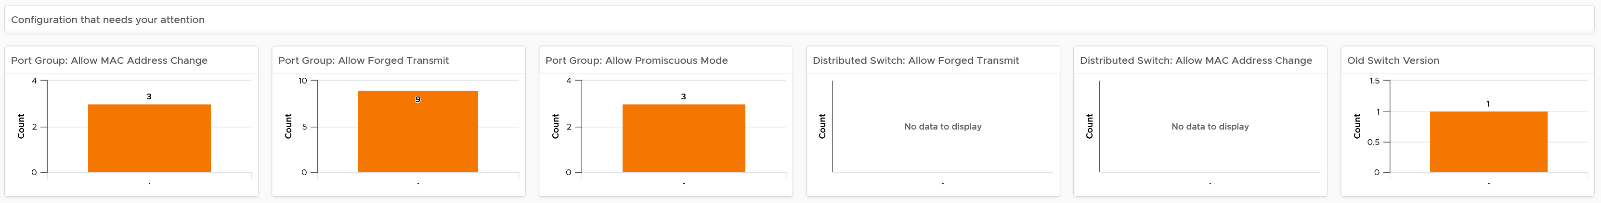
The first section displays network configurations that needs your attention
-
There are 5 bar charts that focuses on critical security settings.
-
The last bar chat shows the version of the vSphere Distribution Switch. Aim to keep the version current, or matching your vSphere version.
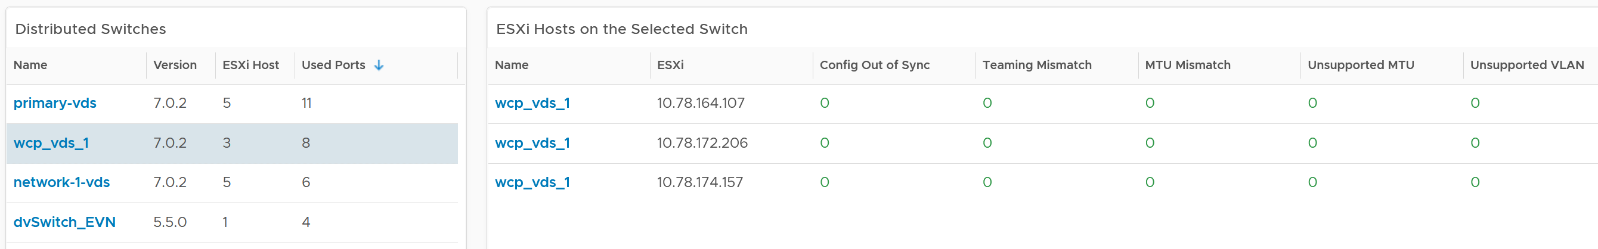
The second section provides overall configuration, with ability to drill down into a particular switch
-
Start by selecting a switch from the list.
-
The ESXi Hosts, port groups and VMs on the switch will automatically be shown.
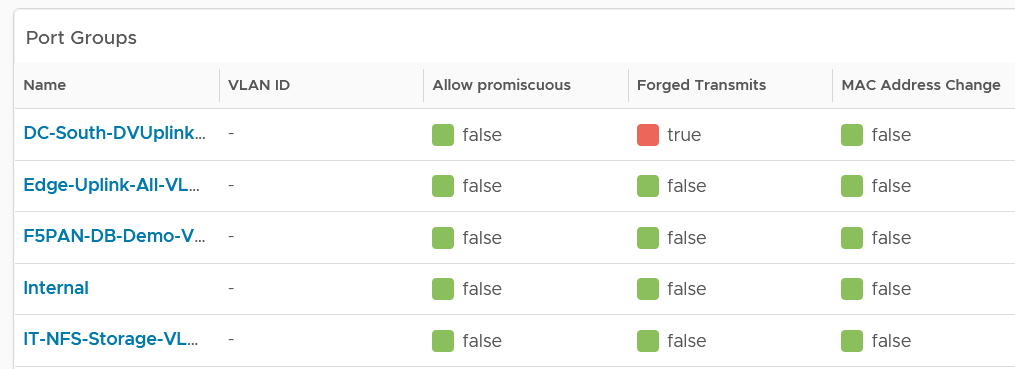
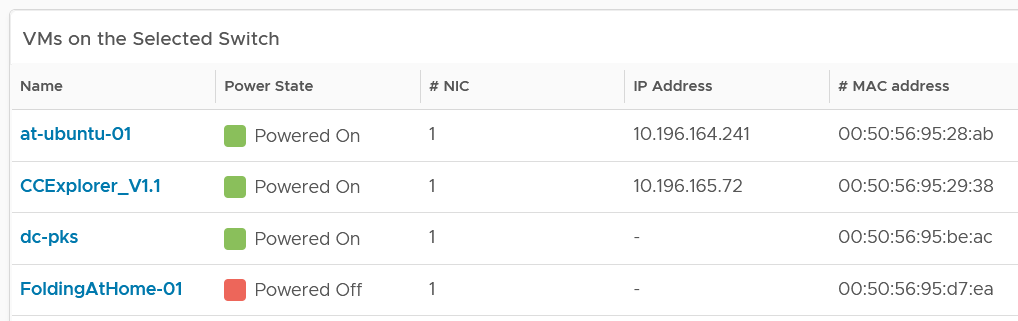
Review each of the tables. For the ESXi Host table, ensure their settings are consistent.
Some of the columns are color coded to facilitate quick reviews. Adjust their threshold to either reflect your current situation or your desired ideal state.
You can sort the columns and export the result into spreadsheet for further analyzis.
Storage Configuration
The dashboard covers both vSAN and non vSAN.
The dashboard is organized into 3 sections for ease of use.
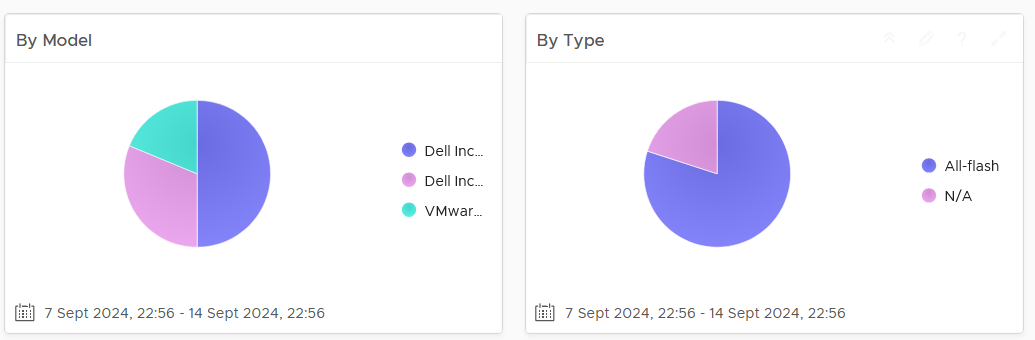
The first section displays 6 pie charts
-
There are 5 bar charts that focuses on critical security settings. Their values should match your security policy.
-
The last bar chat shows the version of the vSphere Distribution Switch. Aim to keep the version current, or matching your vSphere version.
The second section displays 3 bar charts
- Together, they provide good overview of the vSAN key capacity configuration. By seeing the distribution, you can see if you have capacity configuration that is outside your expectation.
The last part of the dashboard shows all the vSAN clusters with their key configuration.
-
Some of the columns are color coded to facilitate quick reviews. Adjust their threshold to either reflect your current situation or your desired ideal state
-
You can sort the columns and export the result into spreadsheet for further analyzis.