VM
VM is not an Operating System, so it has far less networking metric than Windows or Linux.
Overview
We will cover each metric in-depth, so let’s do an overview first.
As usual, we start with contention. All we have is the dropped packet metrics.
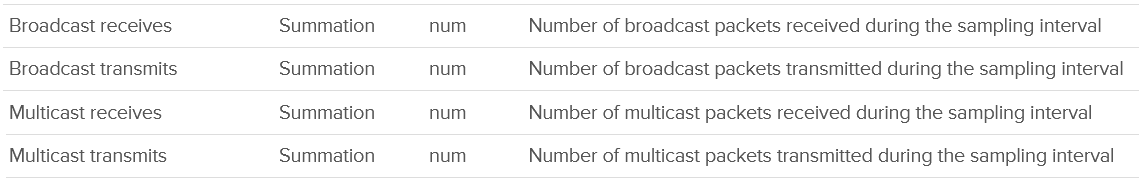
Next, you check if there are unusual traffic. Your network should be mostly unicast, so it’s good to track the broadcast and multicast packets. They might explain why you have many dropped packets. If packets are broadcast packets, it might be dropped by the network.
Next you check utilization. There are 6 metrics, but I think they are triplicate.
Each packet takes up CPU for processing, so it’s good to check if the packet per second becomes too high

The metrics are available at each individual vNIC level and at the VM level. Most VMs should only have 1 vNIC, so the data at VM level and vNIC level will be identical.
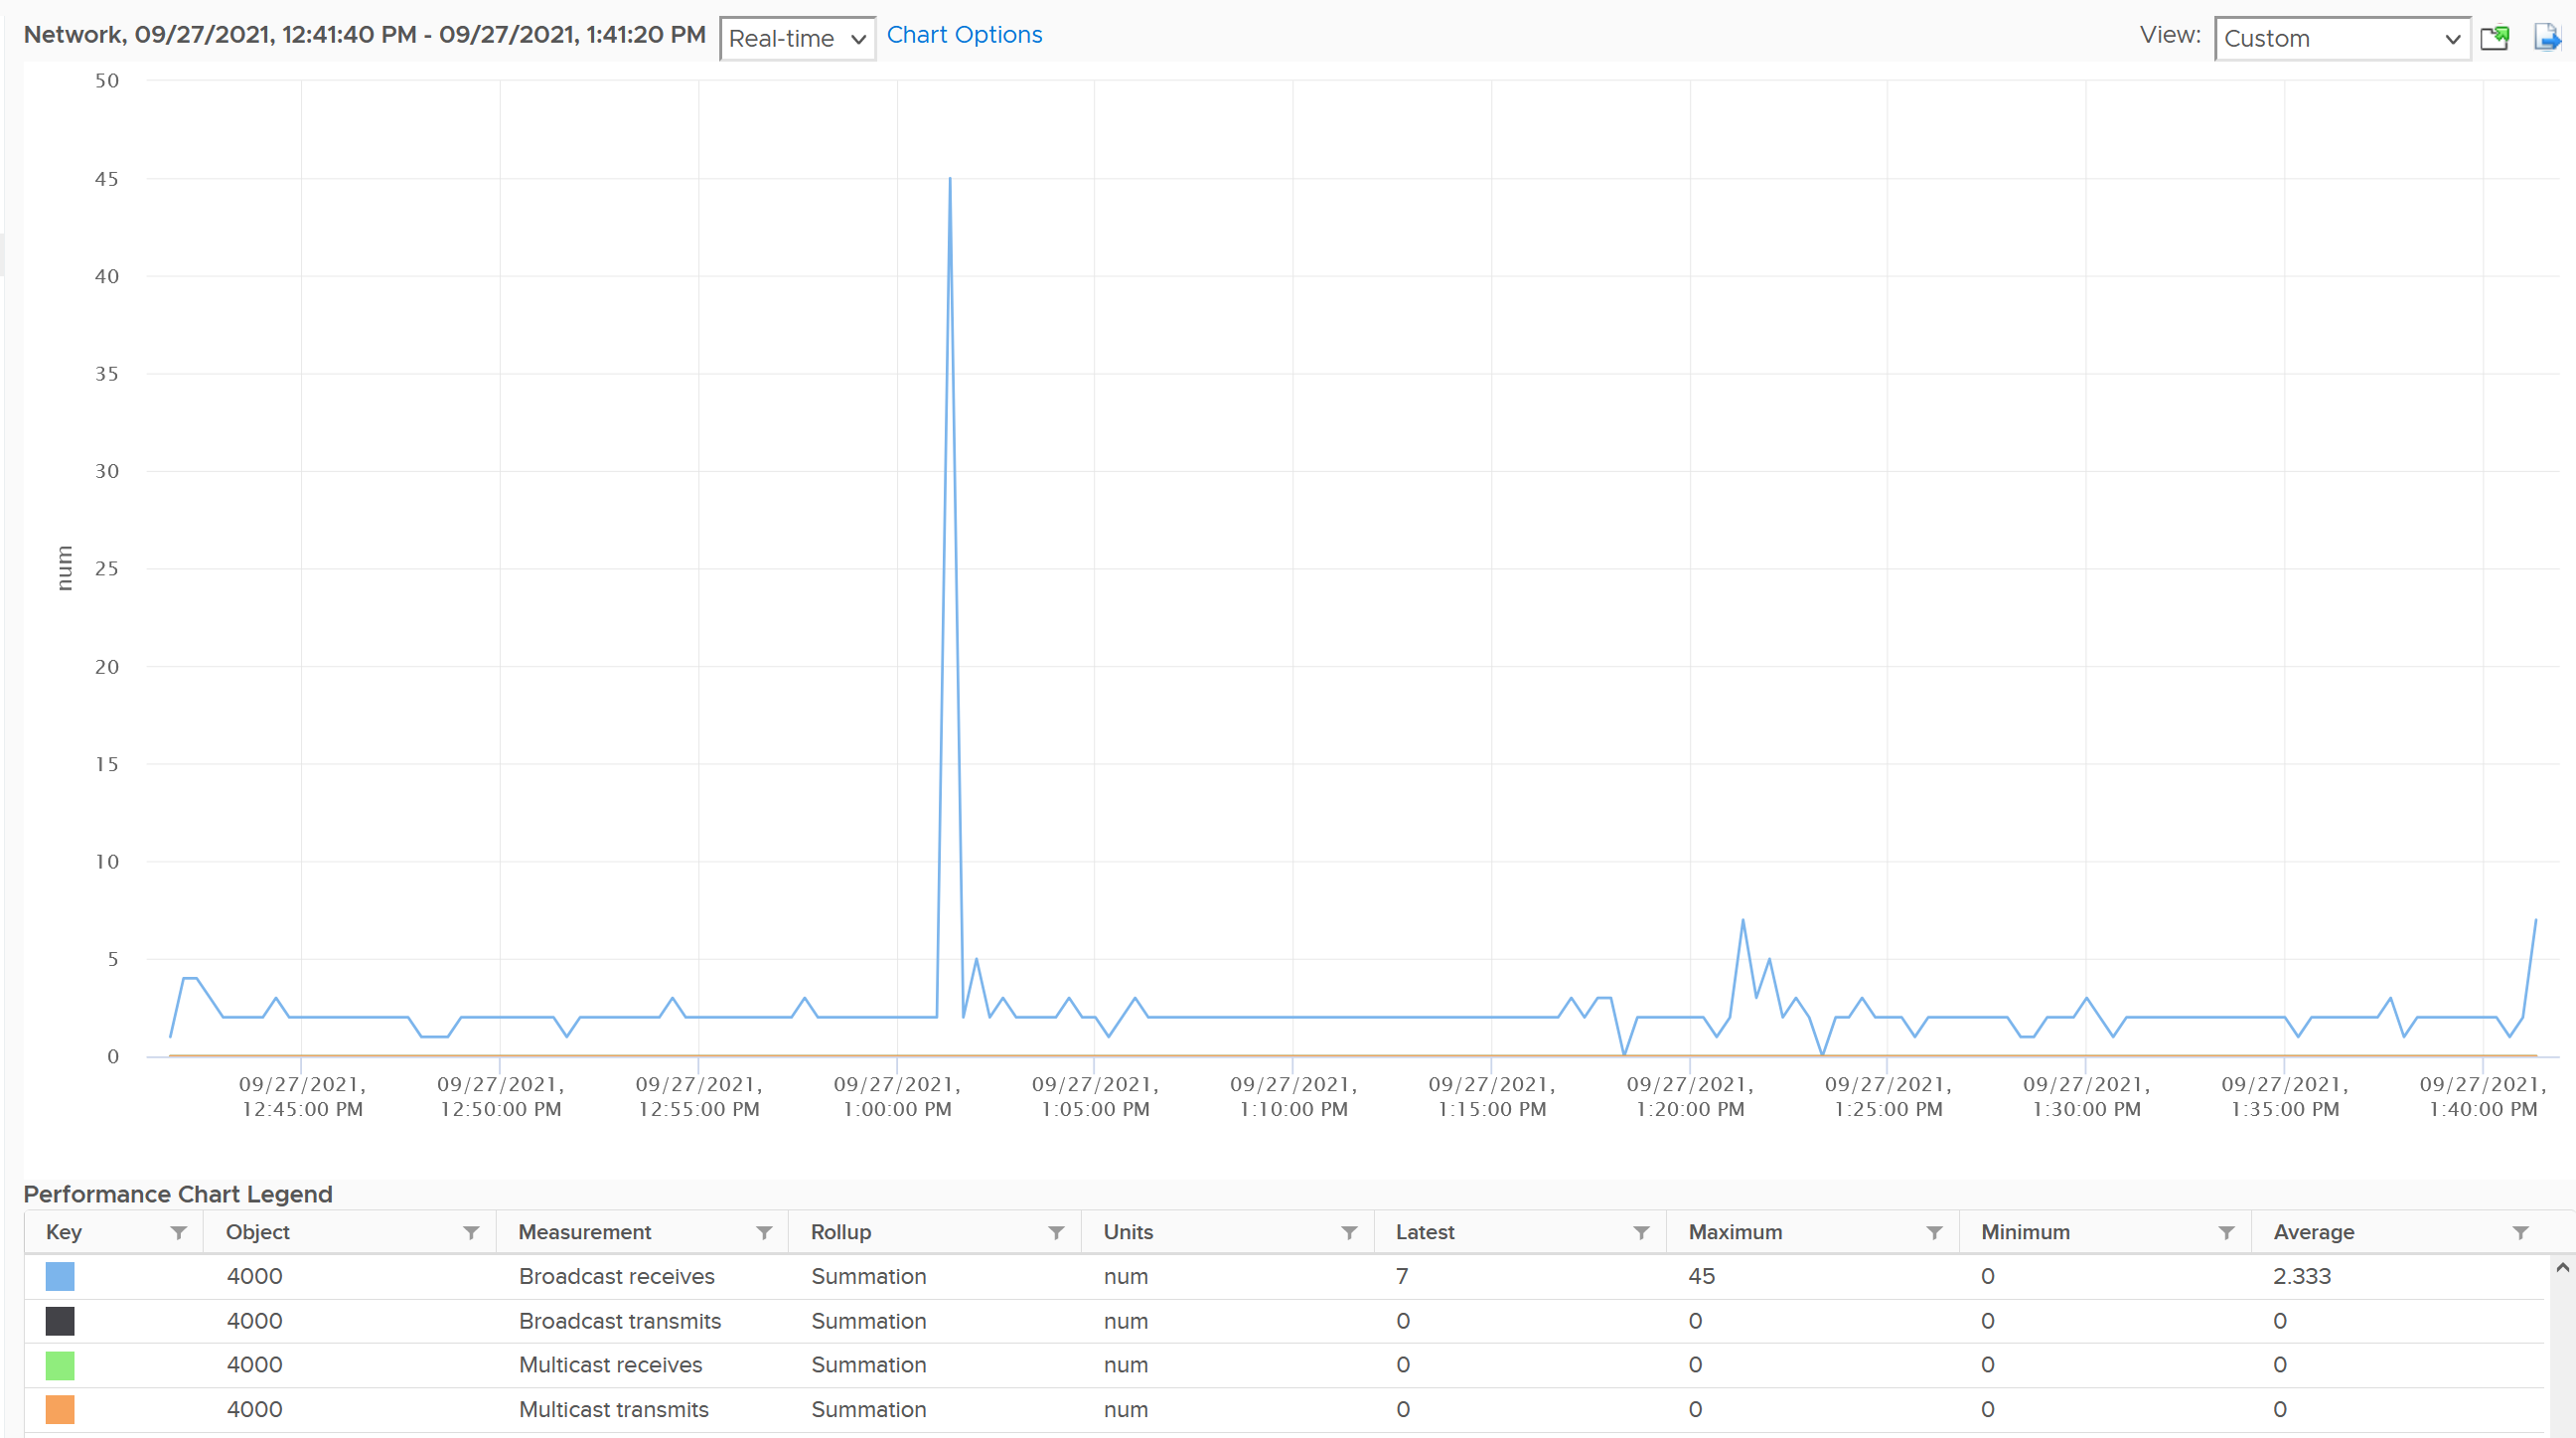
The vNICs are named using the convention "400x". That means the first vNIC is 4000, the second vNIC is 4001, and so on. The following is a vCenter VM. Notice it receives a few broadcast packets, but it’s not broadcasting (which is what you expect). It also does not participate in multicast, which is again expected.
The metrics are grouped into 2:
-
Transmit for outgoing
-
Receive for incoming.
For each group, the following metrics are provided:
| Broadcast packets | Count of packets. It is the sum during the sampling window, not the rate (which is packet/second). Multicast packet and broadcast packet are listed separately. This is handy as they are supposed to low for most VM. Understand the nature of the applications so you can check if the behaviour is normal or not. |
| Multicast packets | |
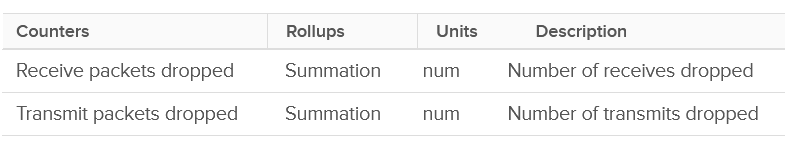
| Packet dropped | |
| Total packets | The total includes the broadcast and multicast, but not the dropped ones. |
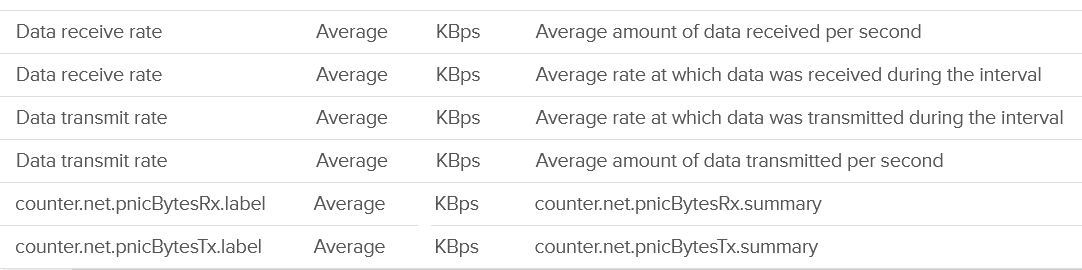
| Throughput per second | This is measured in kilobyte, as packet length is typically measured in bytes. While there are other packet sizes, the standard packet is 1500 bytes. BTW, esxtop measures in megabit. I assume this includes broadcast and multicast, but not the dropped packet. |
Guess what metrics are missing?
-
Retransmit. This can be useful in troubleshooting TCP packet. It naturally does not apply to UDP traffic.
-
Latency.\
A normalized latency would help, especially if it’s broken into internal network and external network. Network latency could be impacted by CPU. CPU might not fast enough to process the packet. In VM, this could also be due to the VM having CPU contention.\
If the latency is caused by too many hops and firewall, optimize the traffic using tools such as vRealize Network Insight.
-
Packets per second. This can be derived by packet count / sampling window. If you have 200 packets in 20 seconds, that means 10 packets per second.
-
Packet size. This can be computed by throughput / packet count. Expect this to be around 1500 byte.
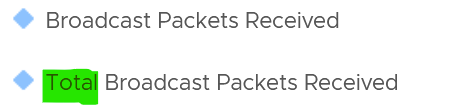
BTW, if you see a pair of metrics with identical name, but one of them is prefixed with “Total”, avoid the one without “Total.” They are averaged over 15 data points, so their value is 15x lower.
Contention Metrics
As usual, let’s approach the metrics starting with Contention. We covered earlier that the only contention metric is packet loss.
For TCP connection, dropped packet needs to be retransmitted and therefore increases network latency from application point of view. The counter will not match the values from Guest OS level. RX packets are dropped before it’s handed into Guest OS, and TX packets are dropped after it left the Guest OS. ESXi dropped the packet because it’s not for the Guest OS or it violates the security setting you set.
The following summary proves that receive packet gets dropped many more times than transmit packet. This is based on 3938 VMs. Each shows the last 1 month, so approximately 35 million data points in total. The average of 35 million data points show that dropped RX is significantly higher than dropped TX. This is why it’s not in the SLA.
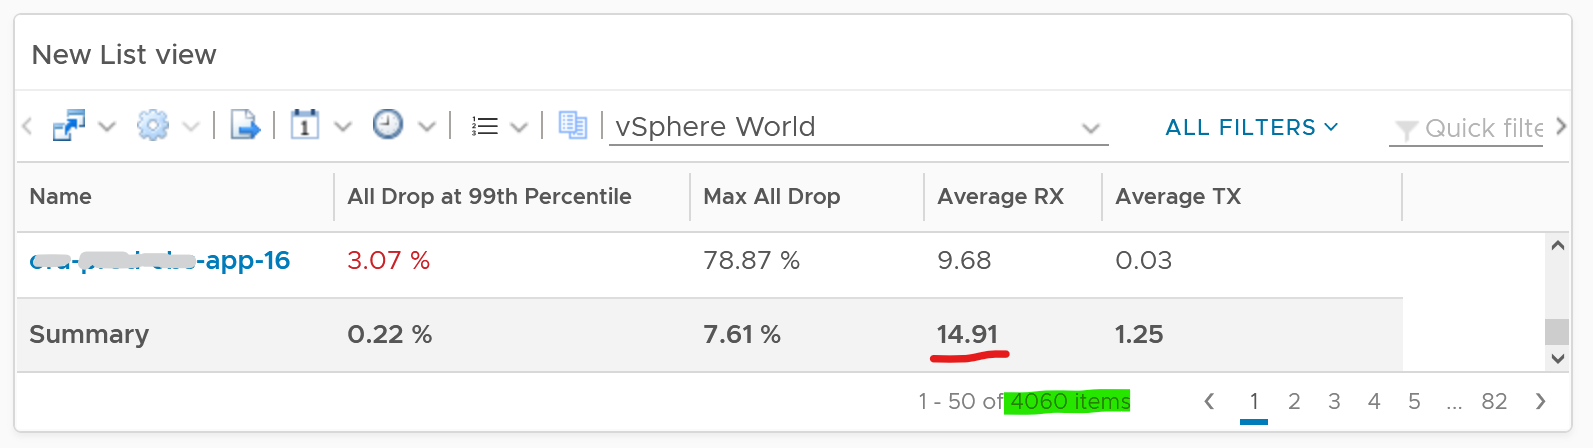
The following table shows that the drop is short and spiky, which is a good thing. The value at 99th percentile is 35x smaller than the value at 100th percentile.
The high value in receive can impact the overall packet dropped (%) counter, as it’s based on the following formula
dropped = Network|Received Packets Dropped + Network|Transmitted Packets Dropped
delivered = Network|Packets Received + Network|Packets Transmitted
Network|Packets Dropped (%) = dropped / (dropped + delivered) * 100
I’ve seen multiple occurrences where the packet dropped (%) jumps to well over 95%. That’s naturally worrying. They typically do not last beyond 15 minutes.
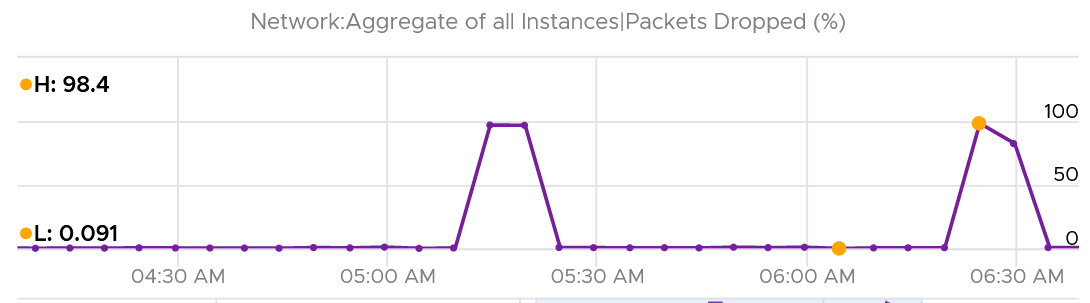
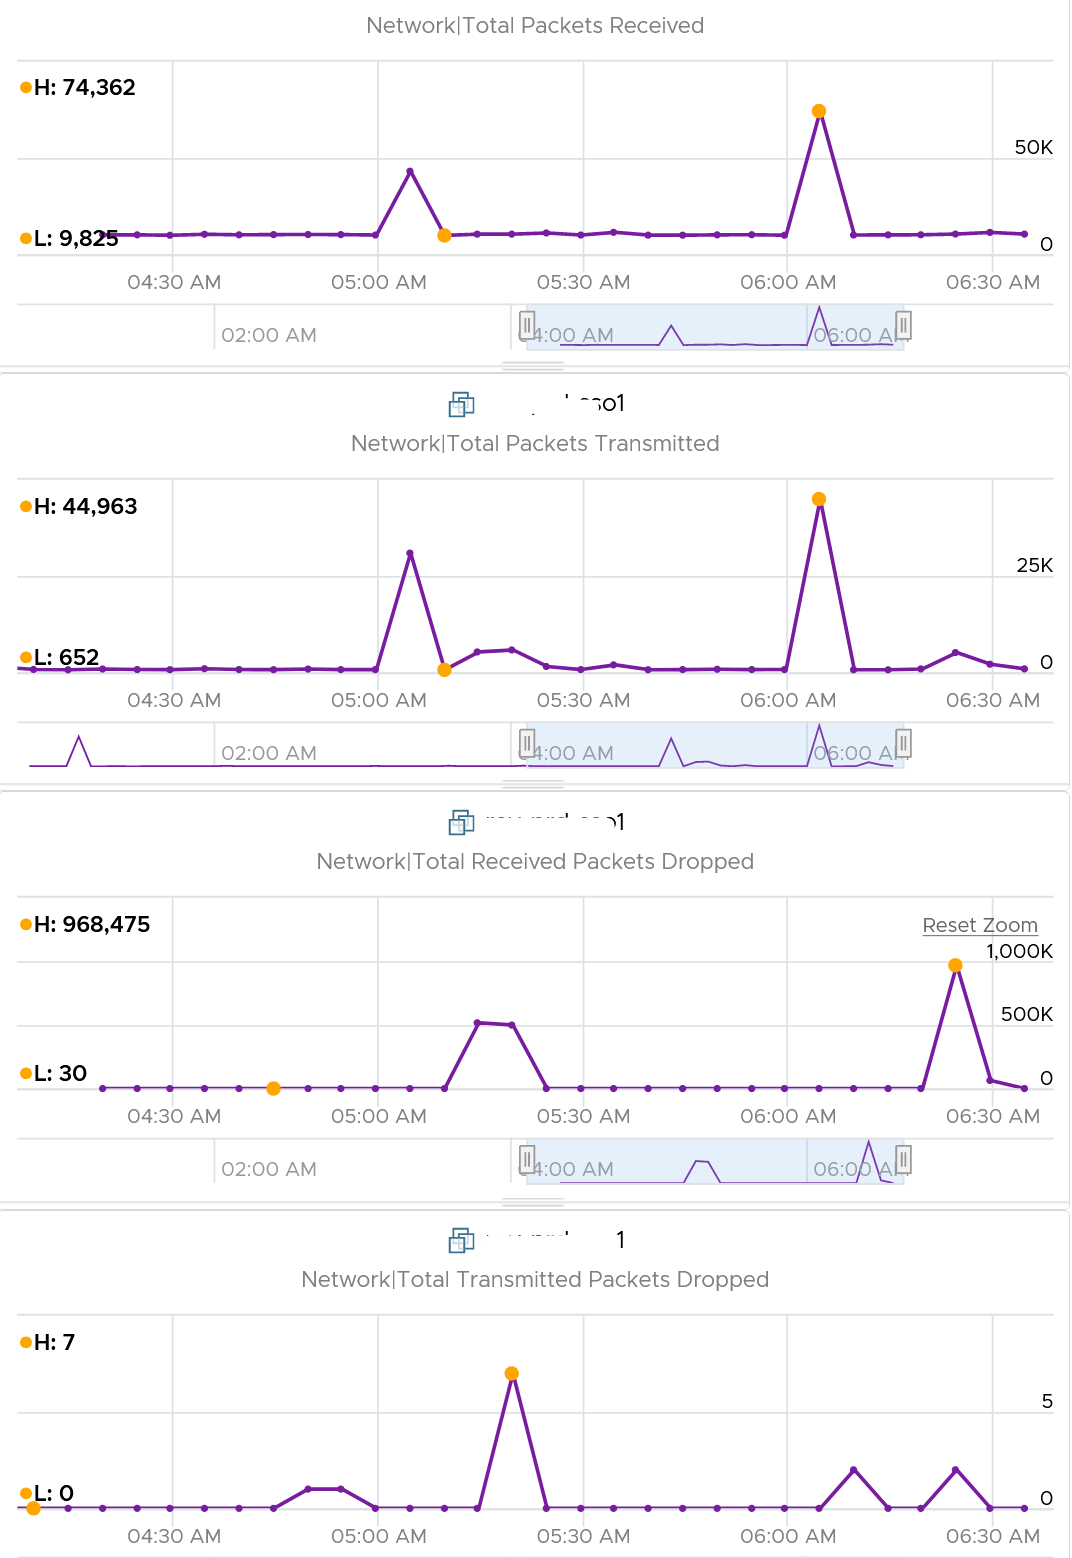
In this, plot the following 4 metrics. You will likely notice that the high spike is driven by low network throughput and high received packet dropped.
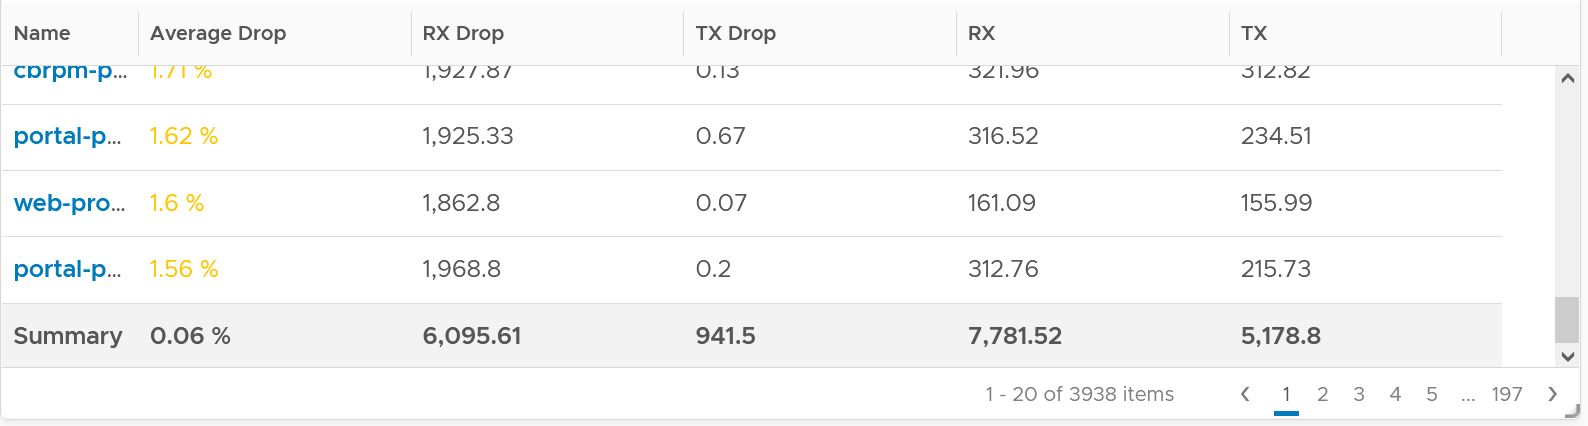
Because of the above problem, profile your VM dropped packets, focusing on the transmit packets. The following is one way to do it, giving surprising results like this:
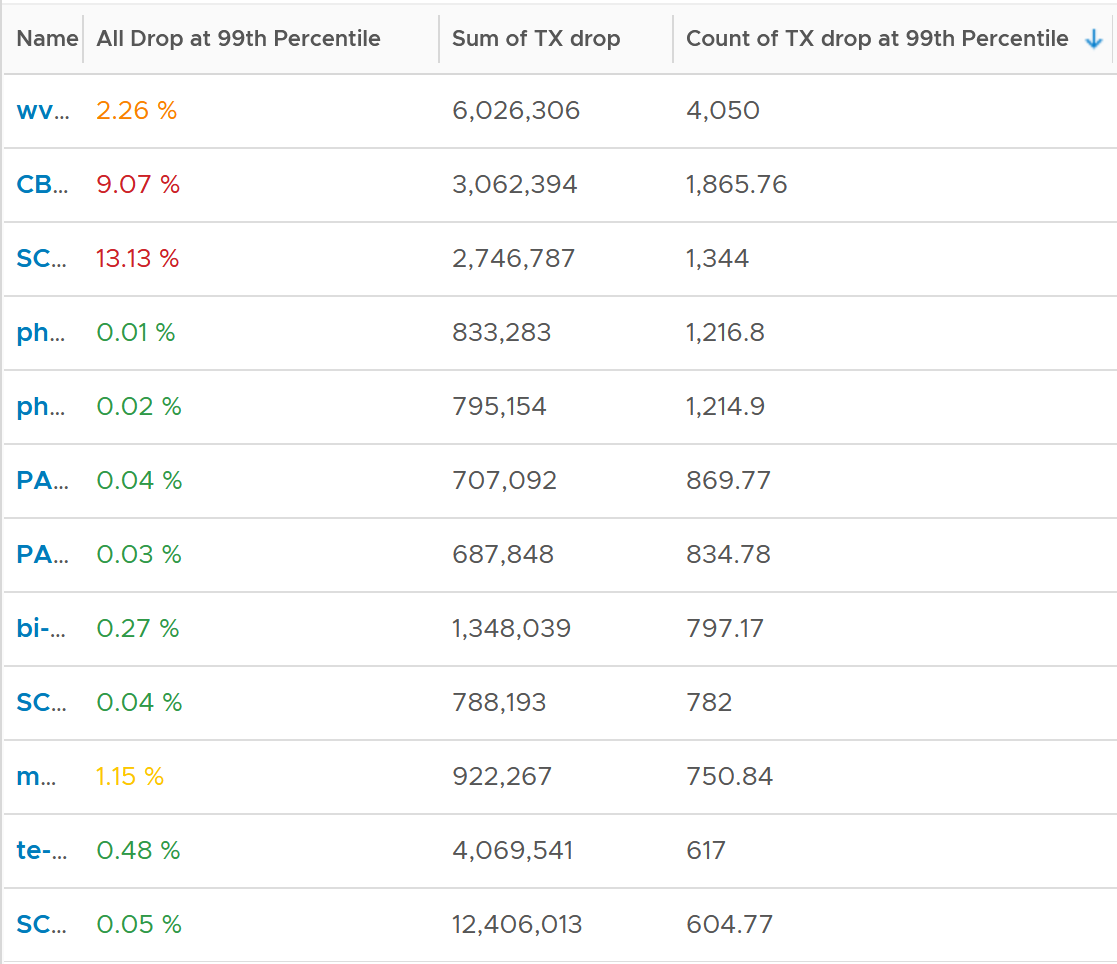
The design of the preceding table is:
-
First column calculates the percentage packets dropped. I took 99th percentile else many of the results will be 100%.
-
Second column sums all the transmitted dropped packets (actual packet counts).
-
Third column takes the 99th percentile maximum of dropped packet within any 300 seconds. Each network packet is typically 1500 bytes. Using 1.5 KB packet size, 1 thousand packets dropped = 1500 MB worth of packets within 300 seconds.
I don’t expect dropped packets in data center network, so to see millions of dropped packets over a month needs further investigation with network team. Moreover, those metrics are Transmit, not Received. So the VM sent them but they got dropped. No one seem to complain, because packets are automatically retransmitted.
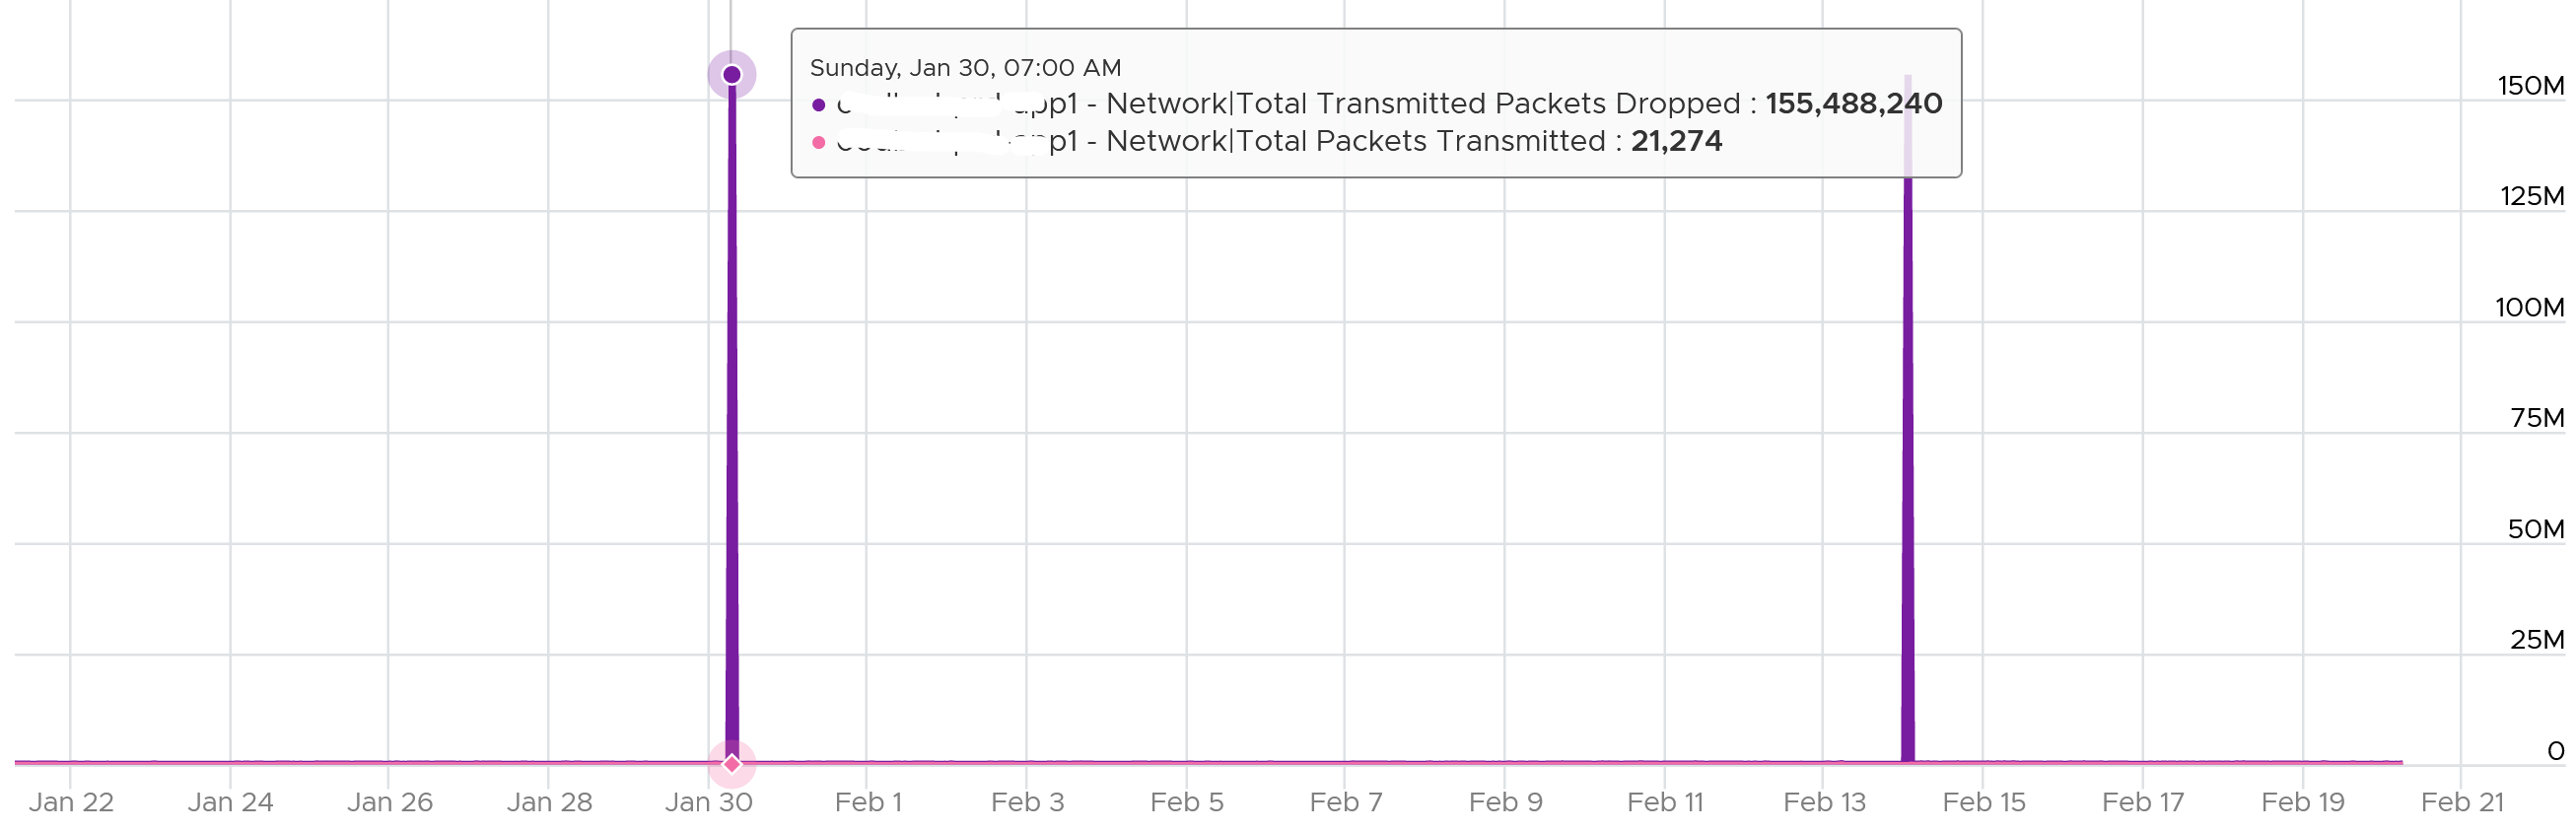
What I typically notice is the spike rarely happens. They look like an outlier, especially when the number is very high. The following is an example. I only showed in the last 1 month as the rest of the 6 months had similar pattern. The jump is well cover 100 million packets, and they were all dropped. Assuming each packet is 1 KB, since VCF Operations reports every 5 minutes, that’s 333 MB per second sustained for 300 seconds.
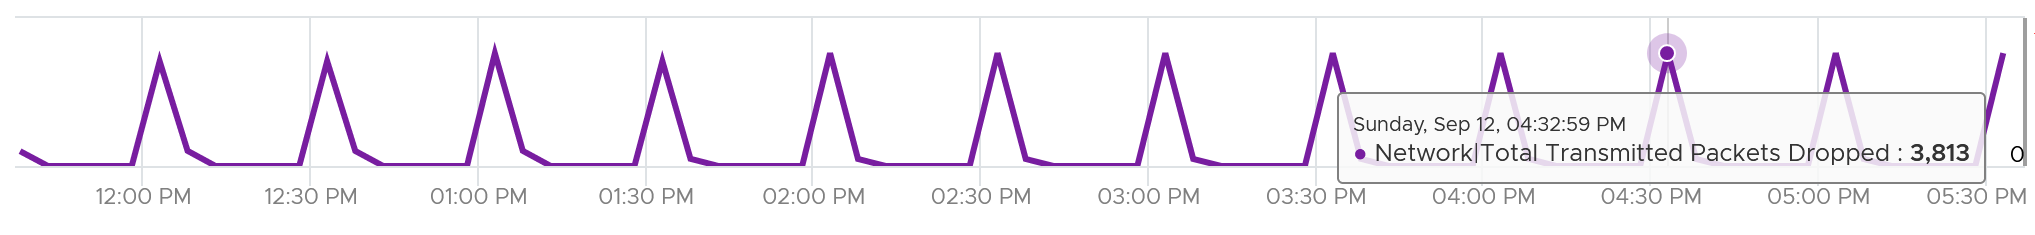
I also notice regular, predictable pattern like this. This is worth discussing with network team. It’s around 3800 packets each 5-minute, so it’s worth finding out.
False positive on TX dropped packet because NSX firewall reject the outgoing packet. See this KB article.
Packet loss in Guest OS using VMXNET3: When using the VMXNET3 driver, you may see significant packet loss during periods of very high traffic bursts. The VM may even freeze entirely. This issue occurs when packets are dropped during high traffic bursts. This can occur due to a lack of receive and transmit buffer space or when receive traffic which is speed constrained.
Consumption Metrics
There are 2 main metrics to measure utilization: throughput and packets.
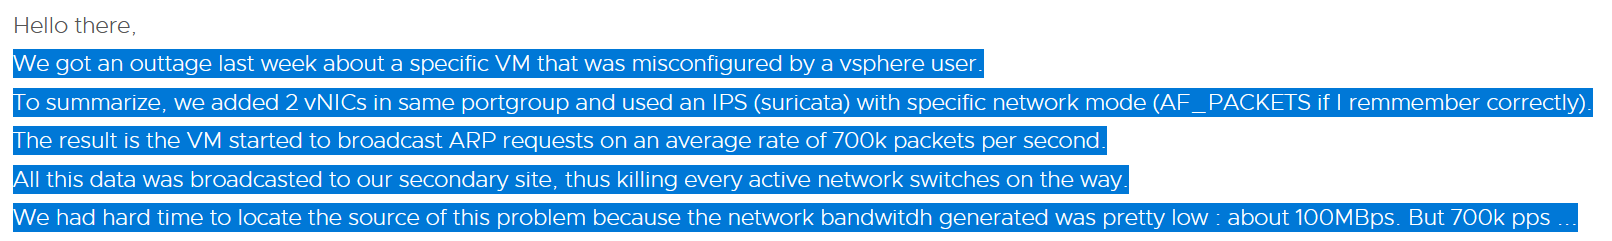
Both metrics matter as you may still have bandwidth but unable to process that many packets per second. This outage shows 700K packets per second that only consumes 800 Mbps as the packet is small. The broadcast packet is only 60 bytes long, instead of the usual 1500 bytes.
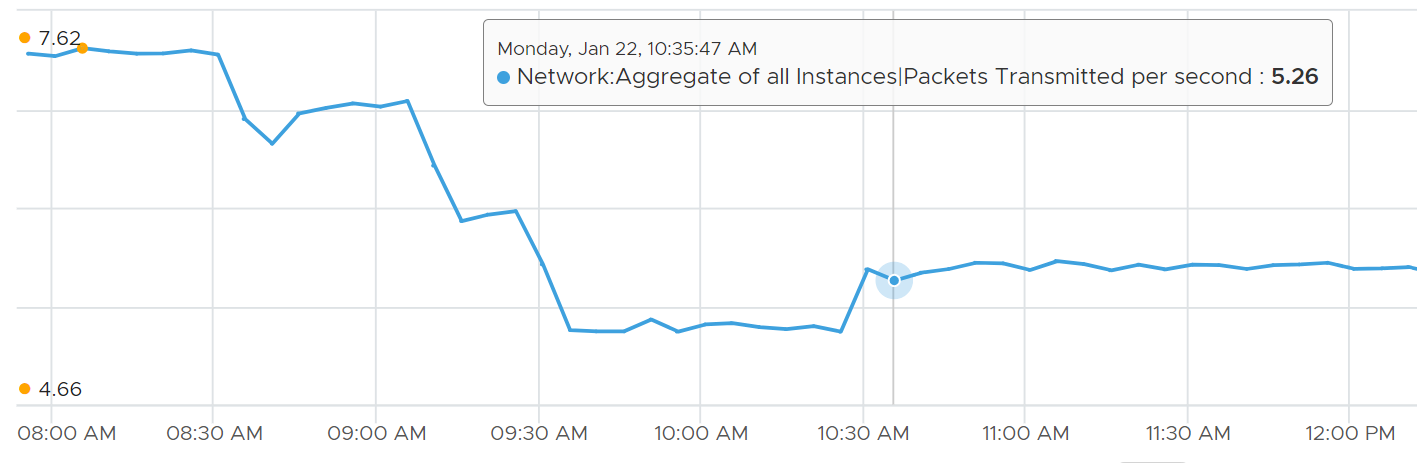
The packets transmitted does not include those dropped packets. Another word, it only counts packets that were successfully transmitted.
The following diagram proves the above relationship.
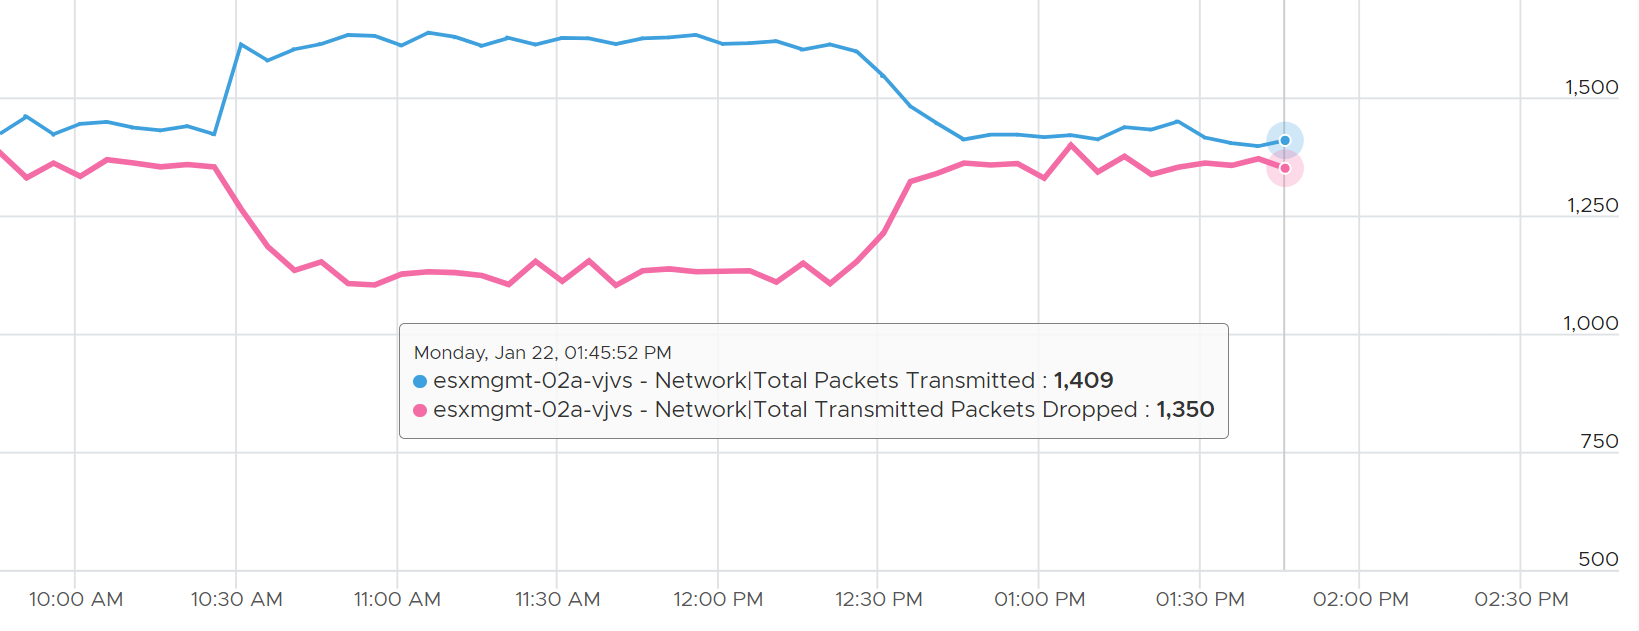
As a consequence, the packets transmitted per second = Total Packets Transmitted / 300 seconds.