ESXi
In vSphere Client, you can’t see the virtual network traffic. The following shows that you can only see the physical network card.
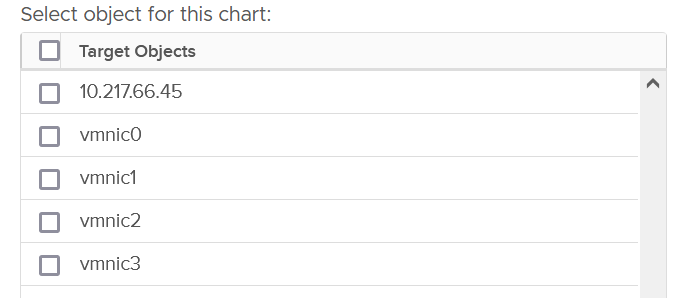
The metrics are provided at both physical NIC card and ESXi level. The counter at host level is basically the sum of all the vmnic instances. There could be small variance, which should be negligible.
Just like vCenter, VCF Operations also does not provide the metrics at the Standard Switch and its port groups. This means you cannot aggregate or analyze the data from these network objects point of view. You need to look at the parent ESXi one by one. Create a dashboard with interaction to cycle through the ESXi hosts.
Contention Metrics
In addition to the dropped packet, there are 2 other metrics tracking contention. They are error packets and unknown protocol frames.
Error Metrics
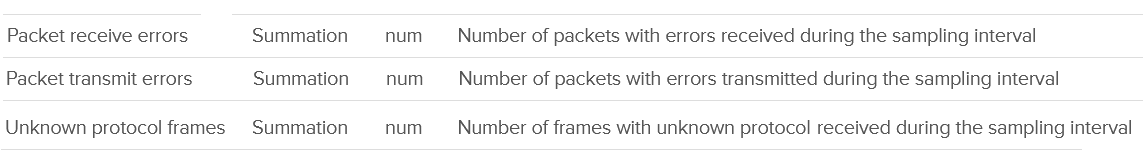
A packet is considered unknown if ESXi is unable to decode it and hence does not know what type of packet it is. You need to enable this metric in VCF Operations as it’s disabled by default.
Expect these error packets, unknown packets and dropped packets to be 0 at all times. The following shows from a single ESX:
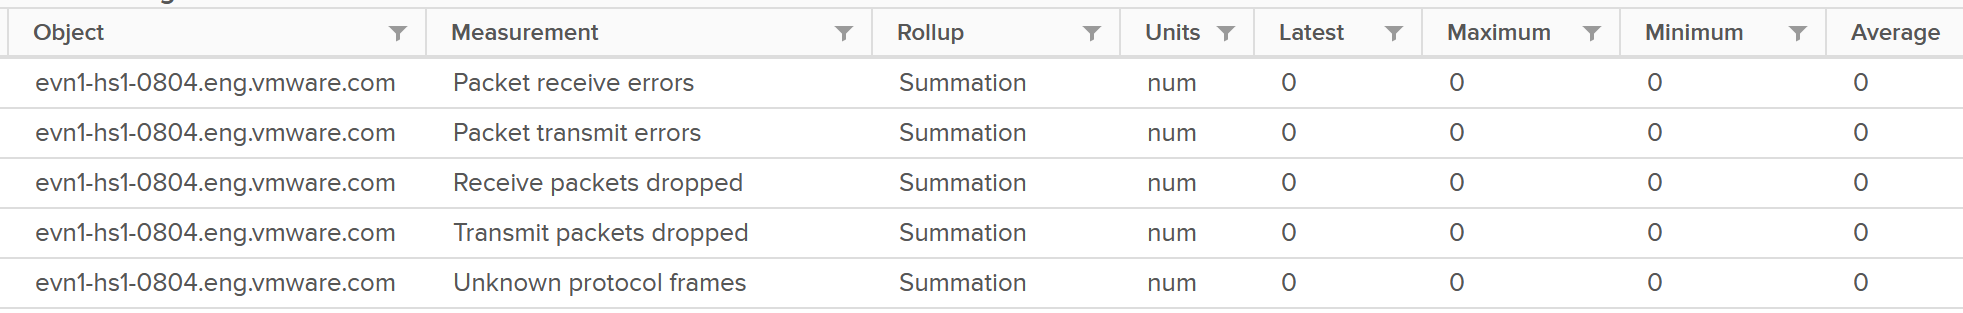
To see from all your ESXi, use the view “vSphere \ ESXi Bad Network Packets”.
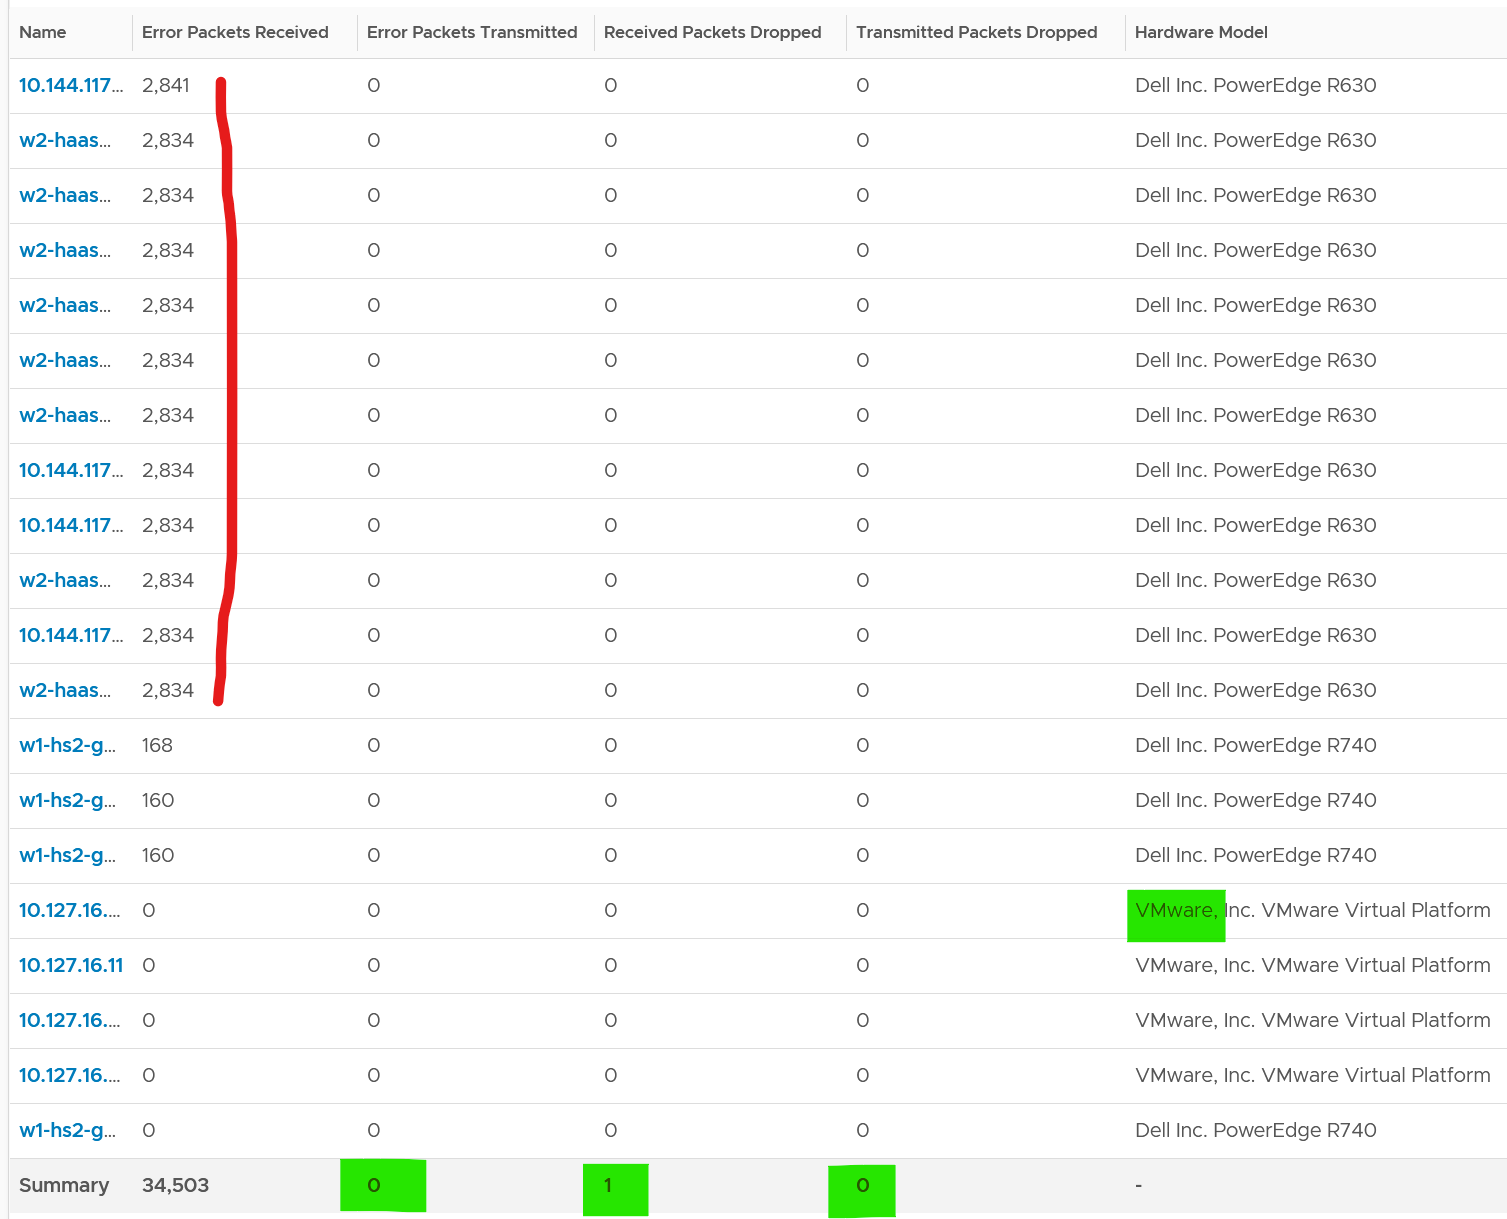
The hosts with error RX spans across different clusters, different hardware models and different ESXi build number. I can’t check if they belong to the same network.
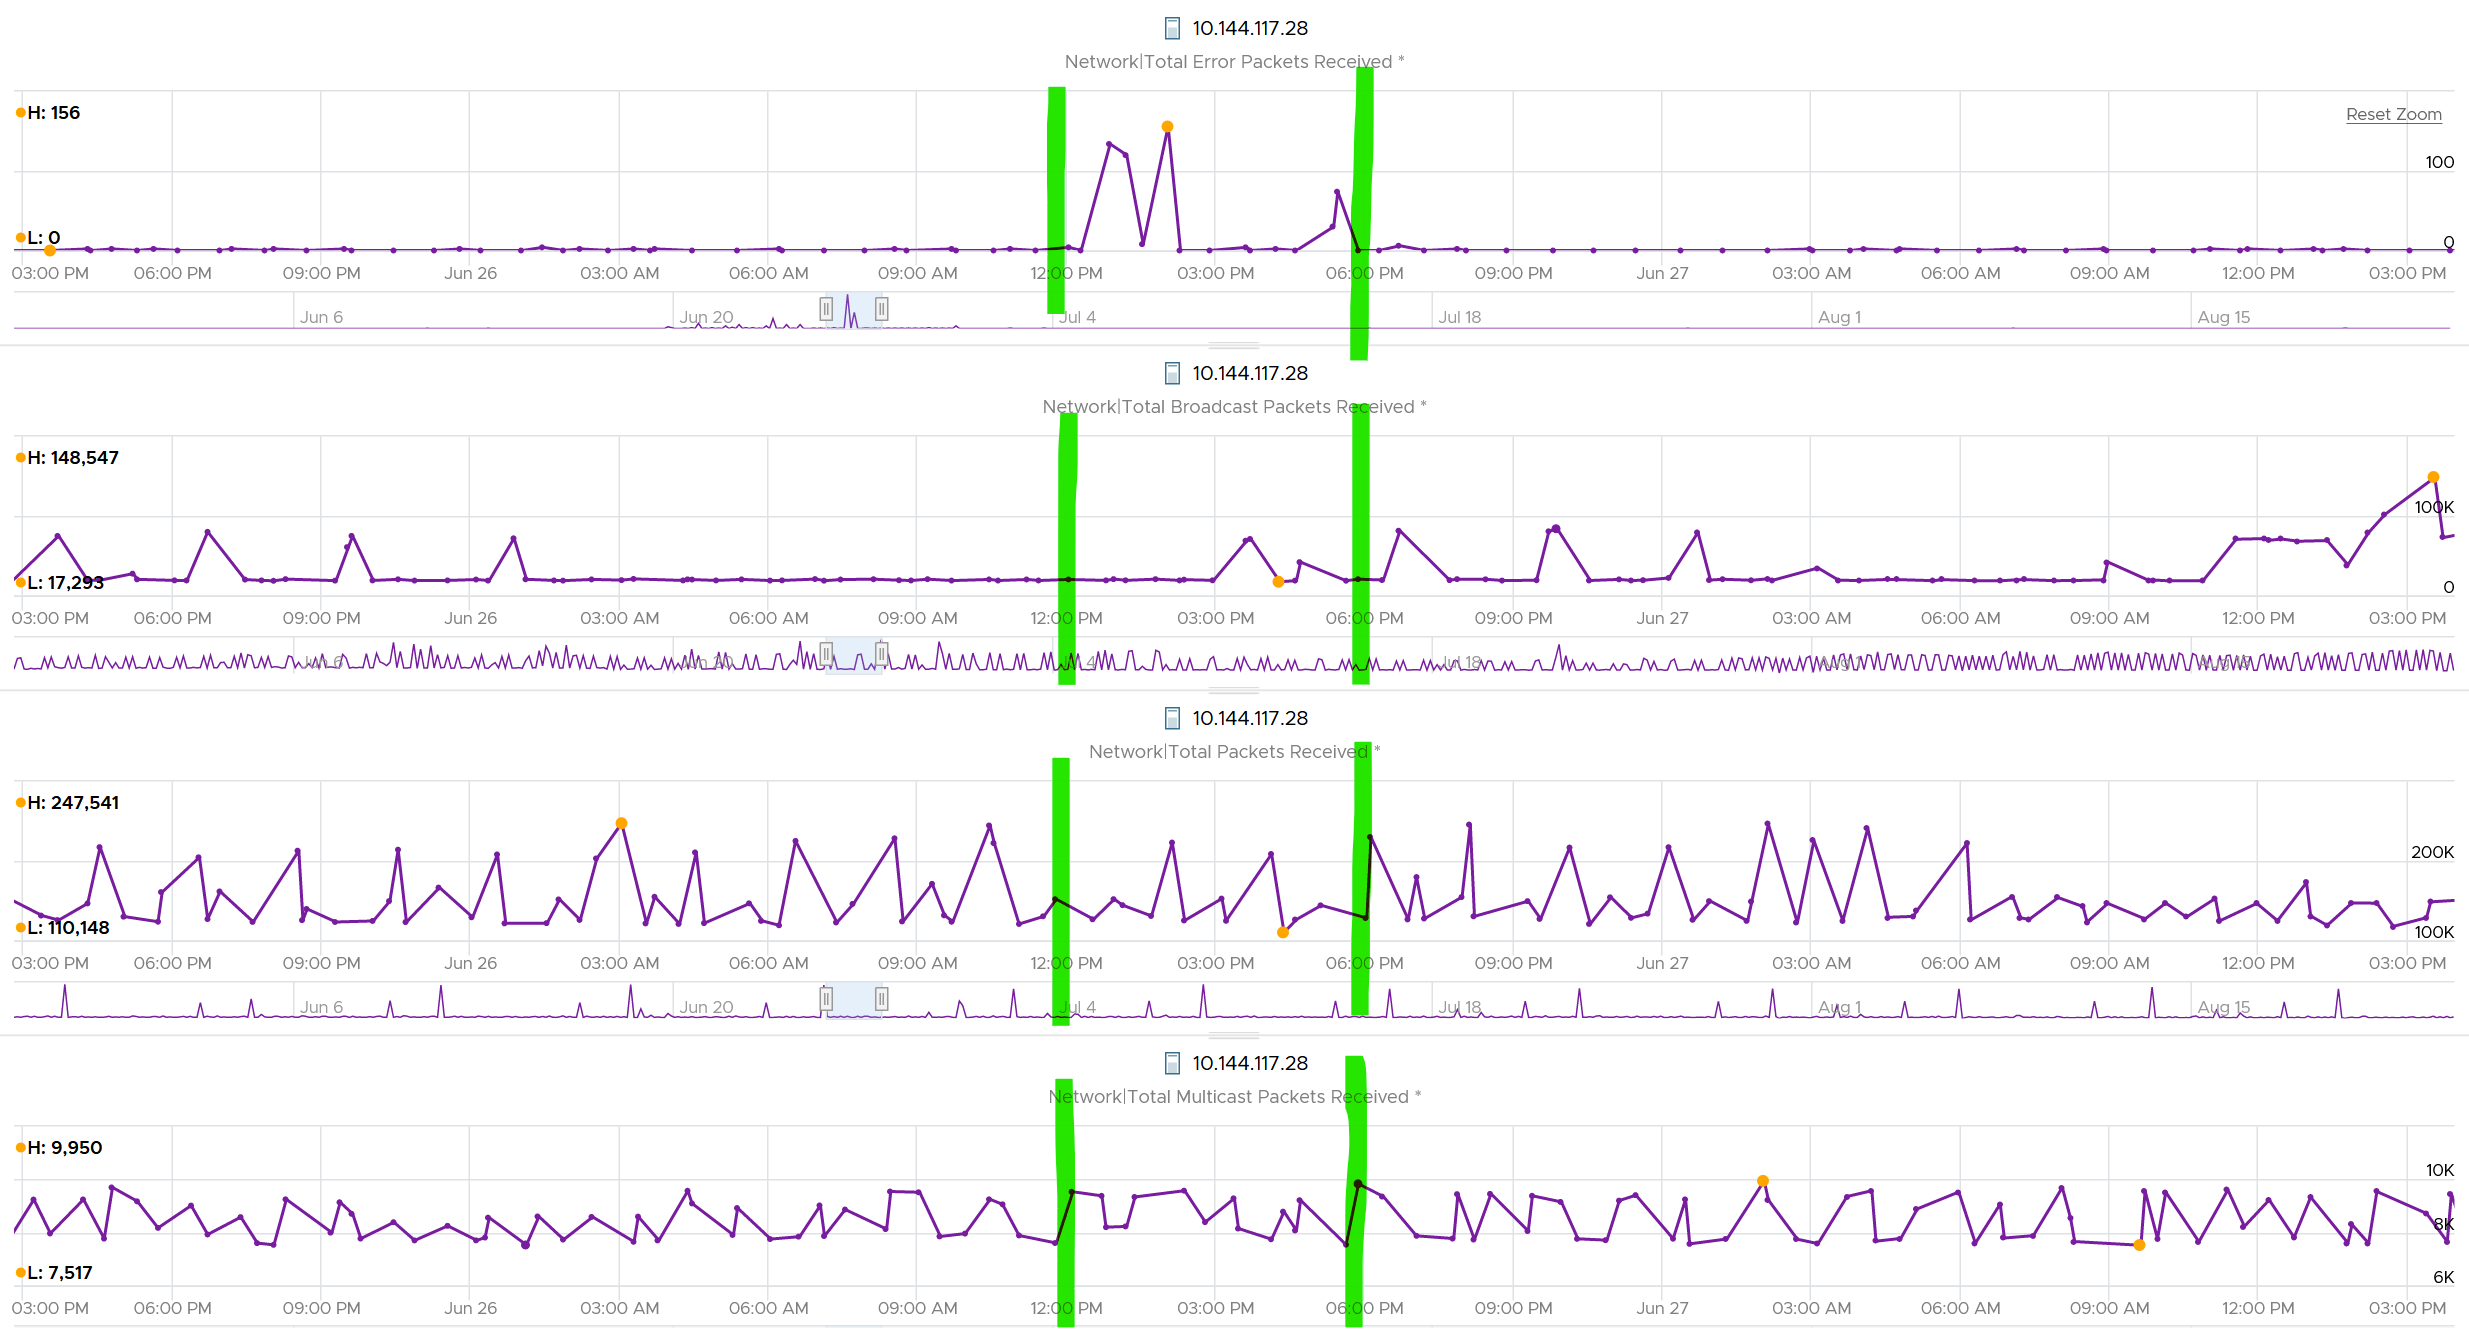
If you see a value, drill down to see if there is any correlation with other types of packets. In the following example, I do not see any correlation.
What I see though, is a lot of irregular collection. I marked with red dots some of the data collection.
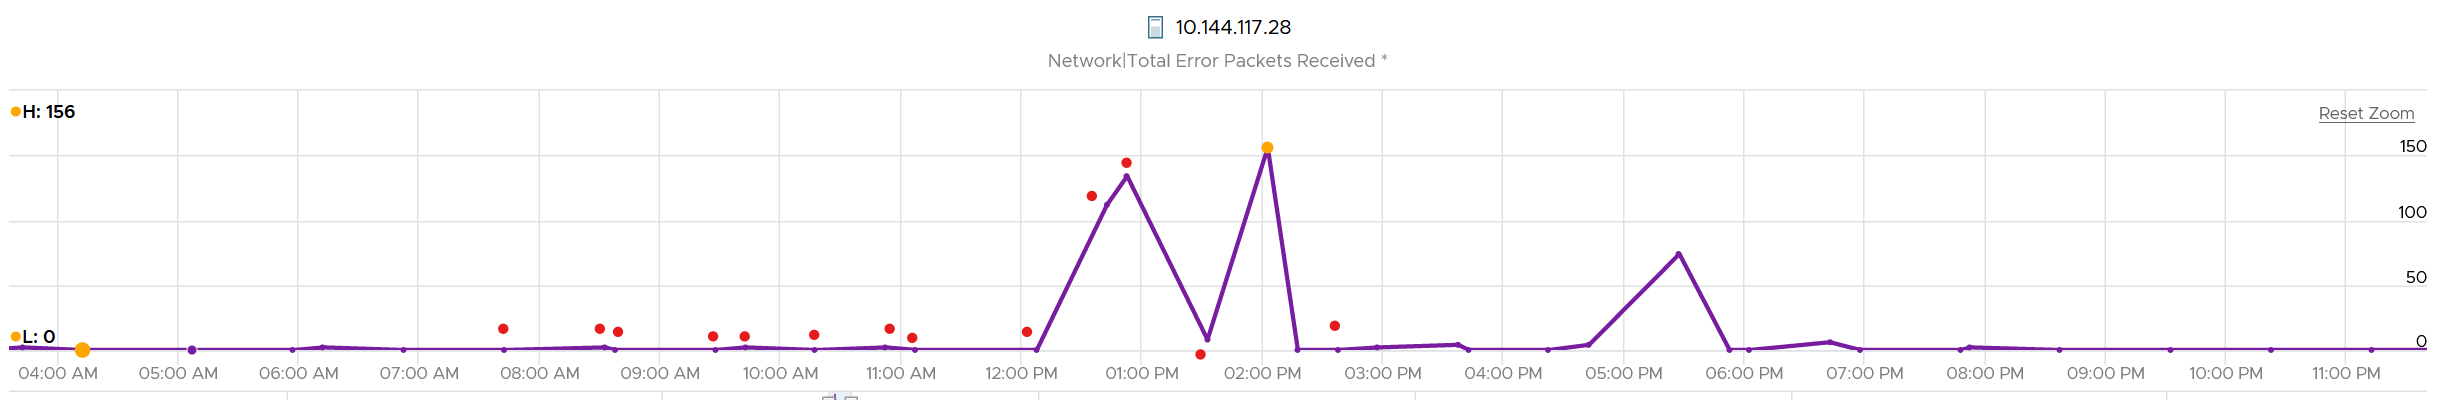
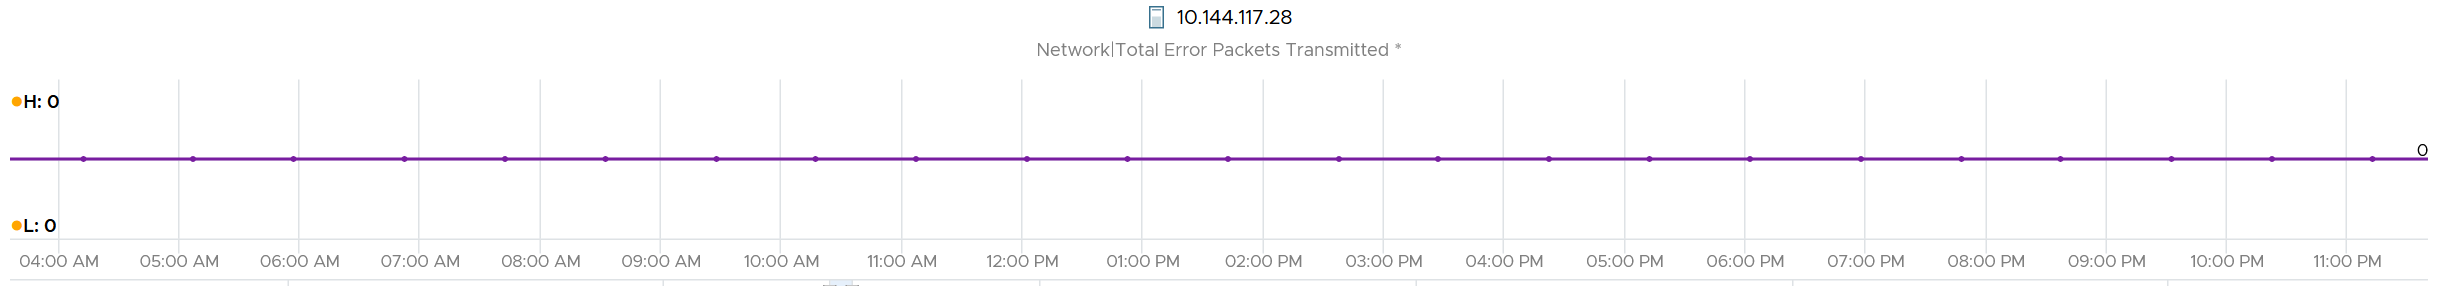
You can see they are irregular. Compare it with the Error Packet Transmit counter, which shows a regular collection.
esxcli
The metrics at vCenter UI only shows the total. If you want to see the details, go to ESXi host console and issue an esxcli command.
The syntax is:
$ watch esxcli network nic stats get -n vmnic#
Take note:
- The counter is accumulative. That means the issue could have happened in the past.
See this KB for details. I’d copy the summary for convenience.
The error counters are:
Total receive errors Total transmit errors | I think these 2 are what you see in the vCenter UI. It’s the summation of all the error below, including checksum error (which is not reported separately). |
Based on this KB article, the csumerr counter, available inside the driver’s private statistics, cover the following:
| |
| Receive length errors | The actual size of the packet does not match with the size of the packet being reported via the packet header |
| Receive over errors | Count the packets that are discarded by the hardware buffer of the card. This includes CRC error. |
| Receive CRC errors | The CRC value calculated by receiving ESXi does not match the value in the FCS field. If you’re unfamiliar with CRC, see this. |
| Receive frame errors | |
| Receive FIFO errors Transmit FIFO errors | The physical network card unable to process due to RX ring buffe size is full |
| Receive missed errors | The physical network card unable to store or process packets due to hardware limitations |
| Transmit aborted errors | |
| Transmit carrier errors | |
| Transmit heartbeat errors | |
| Transmit window errors |
Dropped Packet
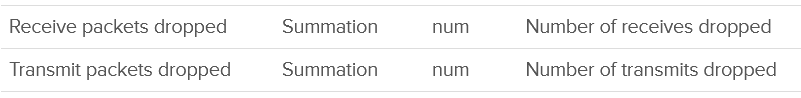
You’ve seen the dropped packet situation at VM. That’s a virtual layer, above the ESXi. What do you expect to see at ESXi layer, as it’s physically cabled to the physical top of rack switches? The counter tracks packets that are dropped prior to the packet reaching the ESXi kernel. According to this KB, “quite often this counter is a combination of the values from other counters that can be found in the Private Statistics section of the nicinfo.sh.txt file that is contained in the commands directory of ESXi host log bundles.”
I plotted 319 production ESXi hosts, and here is what I got for Transmit. What do you think?
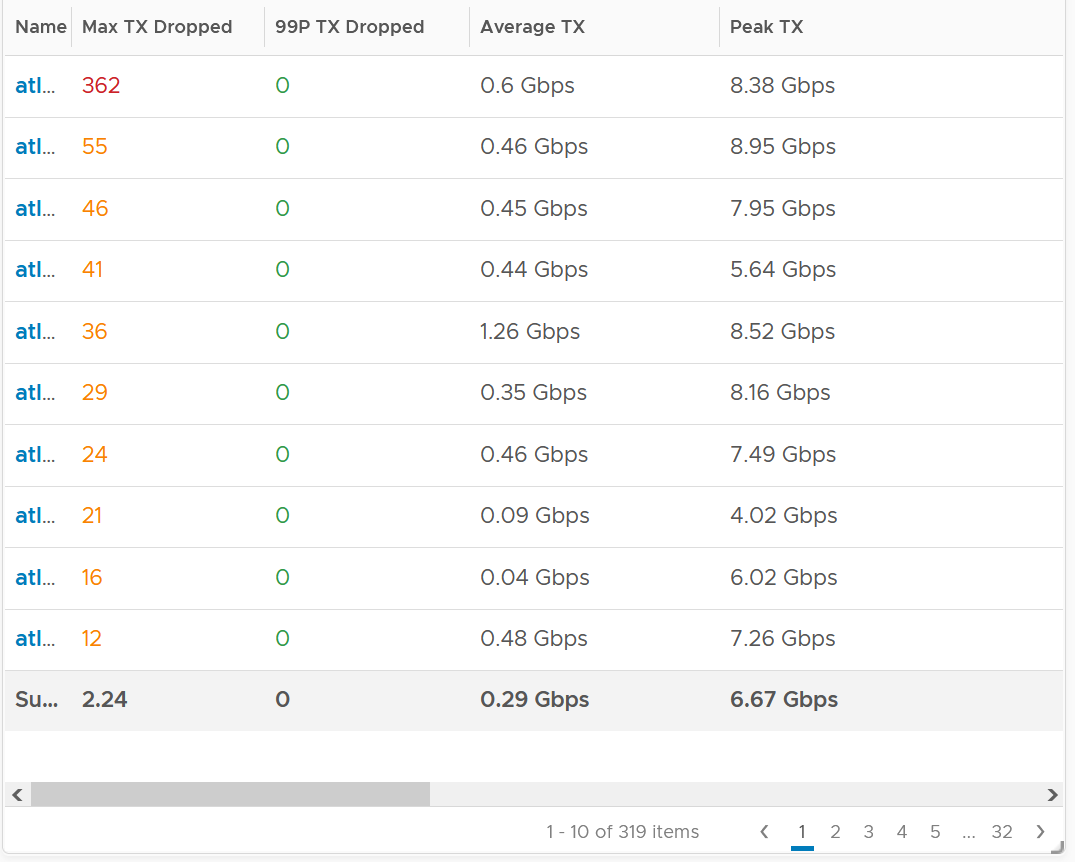
There are packet drops, although they are very minimal. Among 319 hosts, one has 362 dropped transmit packet in the last 3 months. That host was doing 0.6 Gbps on average and peaked at 8.38 Gbps.
As expected, the dropped packet rarely happened. At 99th percentile, the value is perfectly 0.
I tested with another set of ESXi hosts. Out of 123 servers, none of them has any dropped TX packet in the last 6 months. That’s in line with my expectation. However, a few of them experienced rather high dropped RX packets.
The dropped only happened since the ESXi had an increased load
If you see something like this, you should investigate which physical NIC card is dropping packet, and which VMK interface is experiencing it.
While the number is very low, many hosts have packet drops, so my take is I should discuss with network team as I expect data center network should be free of dropped packets.
Received
What do you think you will see for Received?
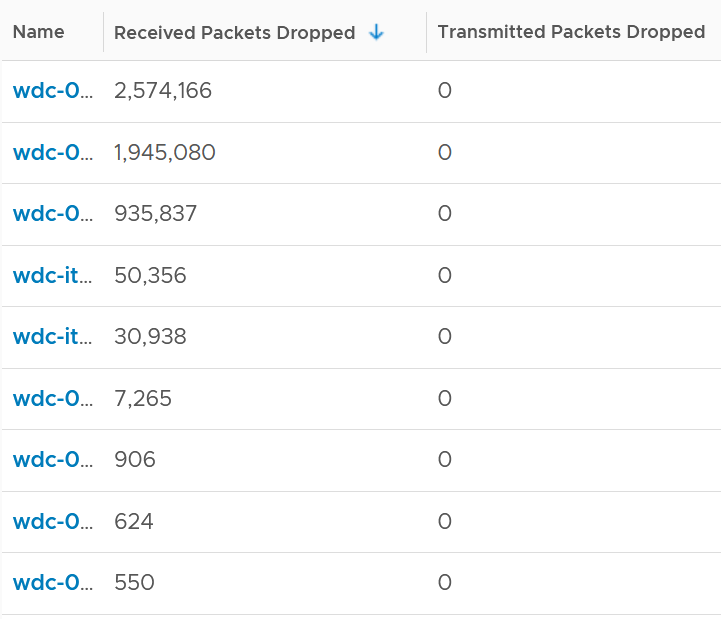
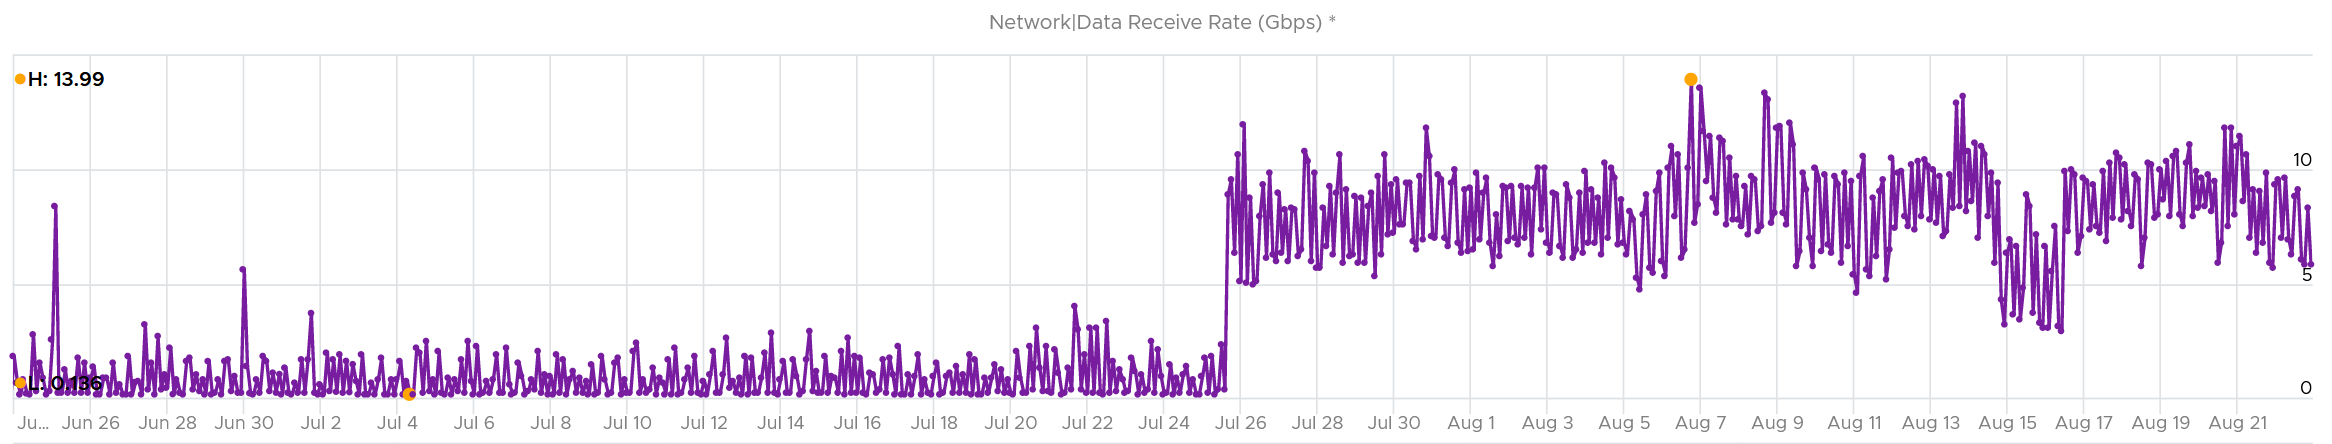
Remember how VM RX is much worse than VM TX? Here is what I got:
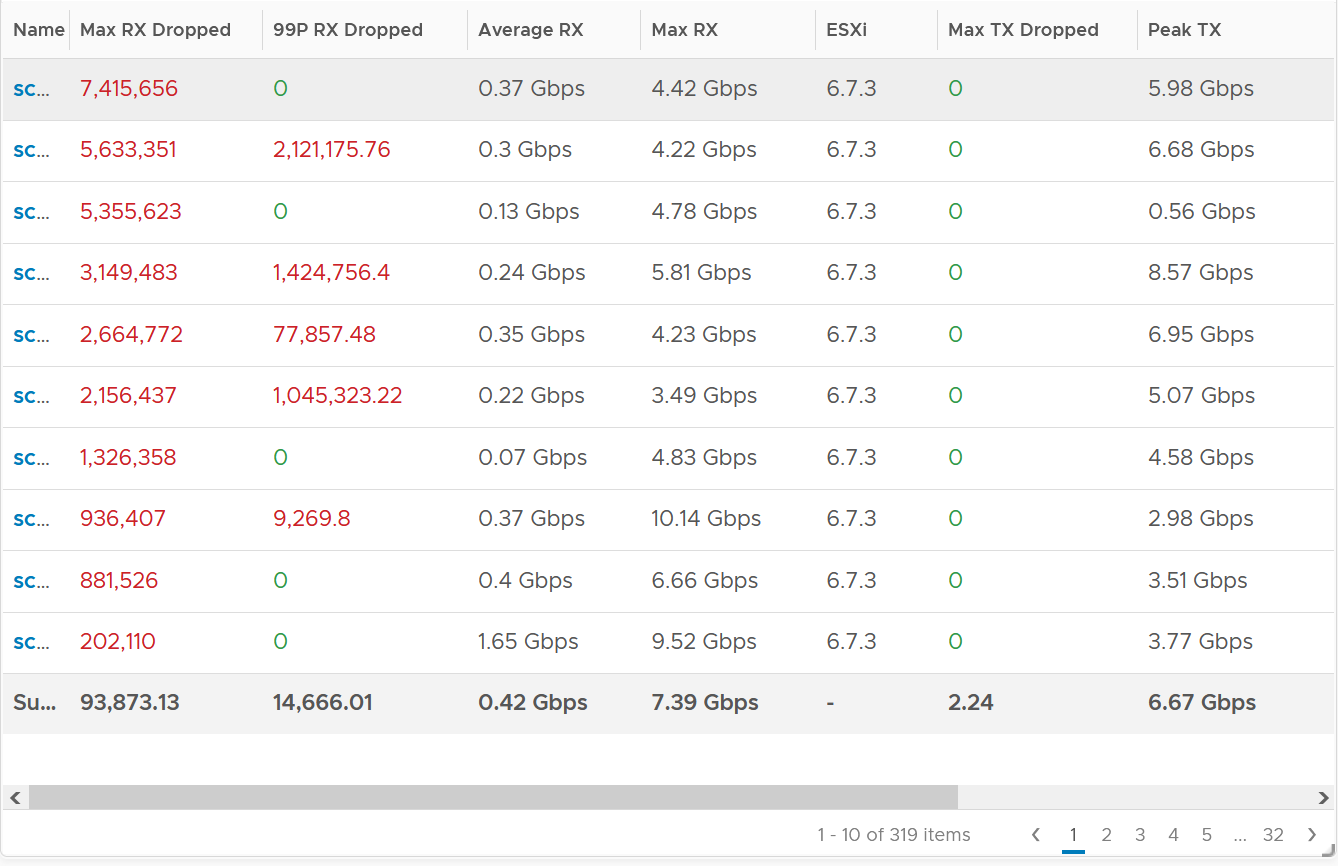
Surprisingly, the situation is the same for ESXi.
Some of them have >1 million packet dropped in 5 minute. Within these set of ESXi, some have regular packet dropped, as the value at 99th percentile is still very high. Notice none of the ESXi is dropping any TX packet.
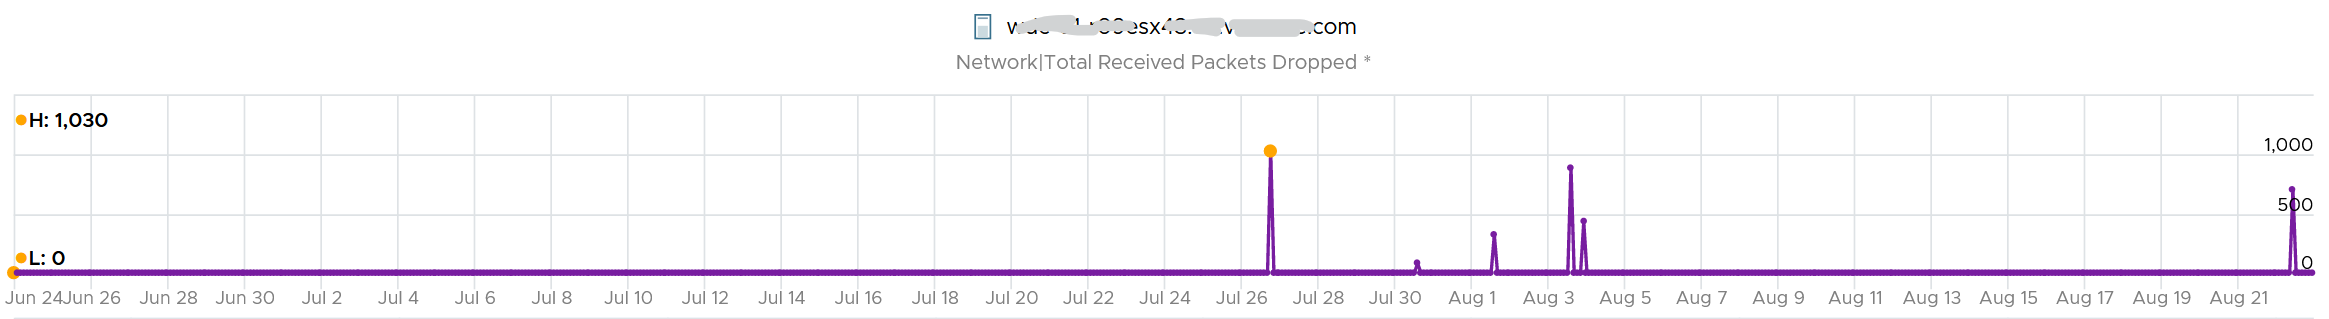
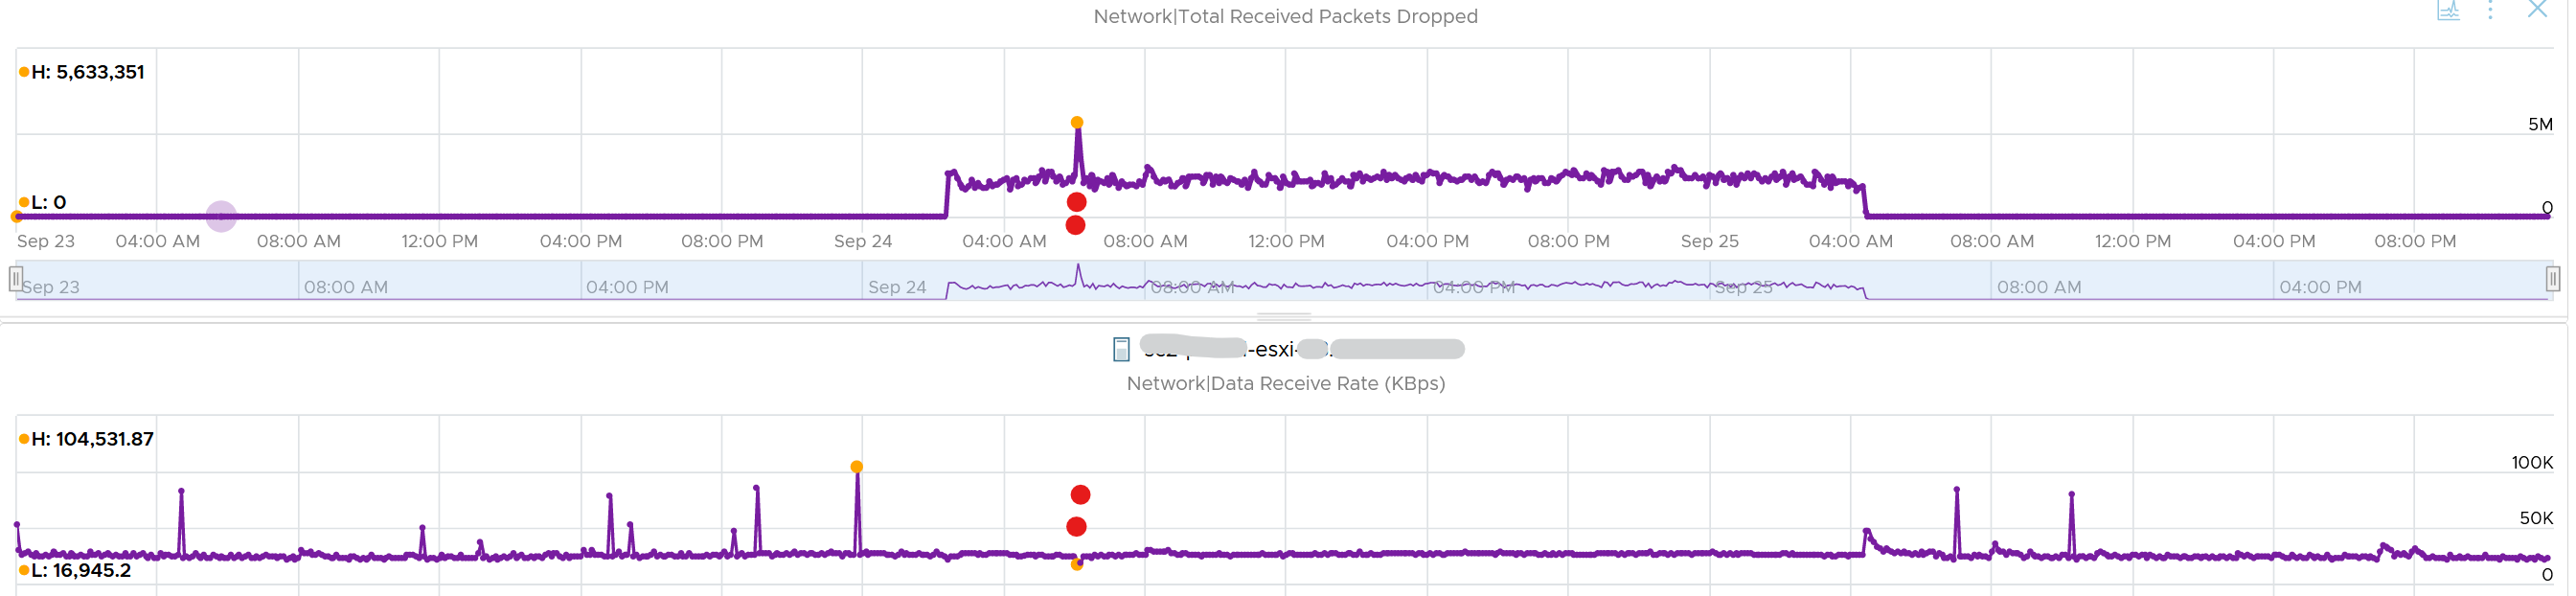
I plotted the 2nd ESXi from the table, as it has high value at 99th percentile. As expected, it has sustained packet dropped lasting 24 hours. I marked the highest packet drop time, as it mapped to the lowest packets received.
vsish
vsish provides more information that is not available in vSphere Client UI and VCF Operations.
vsish -e get /net/portsets/DvsPortset-0/ports/67109026/clientStats
port client stats {
pktsTxOK:154121
bytesTxOK:63326625
droppedTx:0
pktsTsoTxOK:0
bytesTsoTxOK:0
droppedTsoTx:0
pktsSwTsoTx:0
droppedSwTsoTx:0
pktsZerocopyTxOK:45817
droppedTxExceedMTU:0
pktsRxOK:339700
bytesRxOK:257901191
droppedRx:2620 🡨 the reason will appear on the next output below
pktsSwTsoRx:0
droppedSwTsoRx:0
actions:0
uplinkRxPkts:0
clonedRxPkts:0
pksBilled:0
droppedRxDueToPageAbsent:0
droppedTxDueToPageAbsent:0
}
We saw dropped packets, so we probe deeper for the reason
vsish -e get /net/portsets/DvsPortset-0/ports/67109026/vmxnet3/rxSummary
stats of a vmxnet3 vNIC rx queue {
LRO pkts rx ok:0
LRO bytes rx ok:0
pkts rx ok:340093
bytes rx ok:257984247
unicast pkts rx ok:253678
unicast bytes rx ok:245663220
multicast pkts rx ok:42220
multicast bytes rx ok:7497292
broadcast pkts rx ok:44195
broadcast bytes rx ok:4823735
running out of buffers:2620 🡨 the reason for 2620 packets dropped
pkts receive error:0
1st ring size:512
2nd ring size:512 🡨 the ring size is on the small side. I’d say set to 2K.
# of times the 1st ring is full:354 🡨 this line shows the first ring is full 354x
# of times the 2nd ring is full:0
fail to map a rx buffer:0 🡨 other reasons look good
request to page in a buffer:0
# of times rx queue is stopped:0 🡨 other reasons look good
failed when copying into the guest buffer:0 🡨 other reasons look good
# of pkts dropped due to large hdrs:0
# of pkts dropped due to max number of SG limits:0
pkts rx via data ring ok:0
bytes rx via data ring ok:0
Whether rx burst queuing is enabled:0
current backend burst queue length:0
maximum backend burst queue length so far:0
aggregate number of times packets are requeued:0
aggregate number of times packets are dropped by PktAgingList:0
# of pkts dropped due to large inner (encap) hdrs:0
number of times packets are dropped by burst queue:0
number of times packets are dropped by rx try lock queueing:0
number of packets delivered by burst queue:0
number of packets dropped by packet steering:0
number of memory region lookup pass in Rx.:0
number of packets dropped due to pkt length exceeds vNic mtu:0
number of packets dropped due to pkt truncation:0
}
Networking VMs, such as firewall and routers, or any high VMs expecting high packet rates, check if the VM is requesting NetQ RSS.
Consumption Metrics
As expected, you get the 2 types of throughput:
-
bits/second
-
packets/second.
For bits/second, the metrics are:
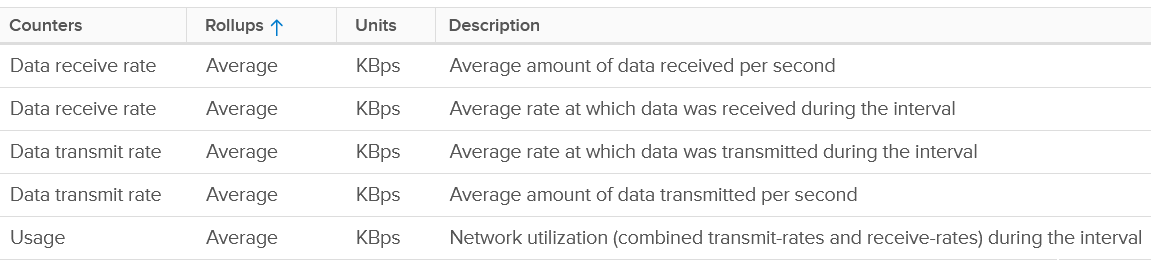
I’m unsure why there are duplicates metrics.
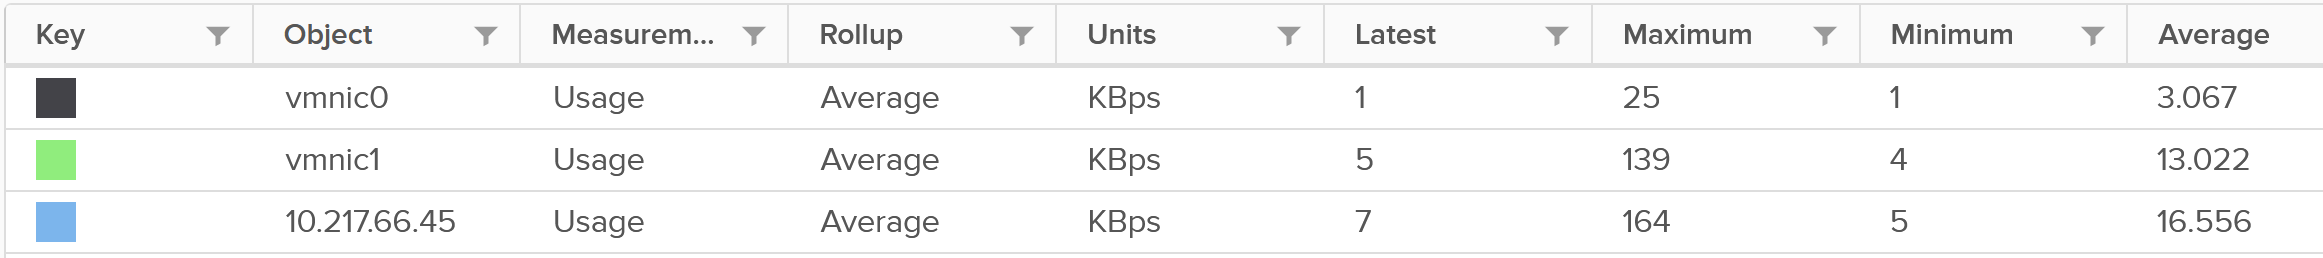
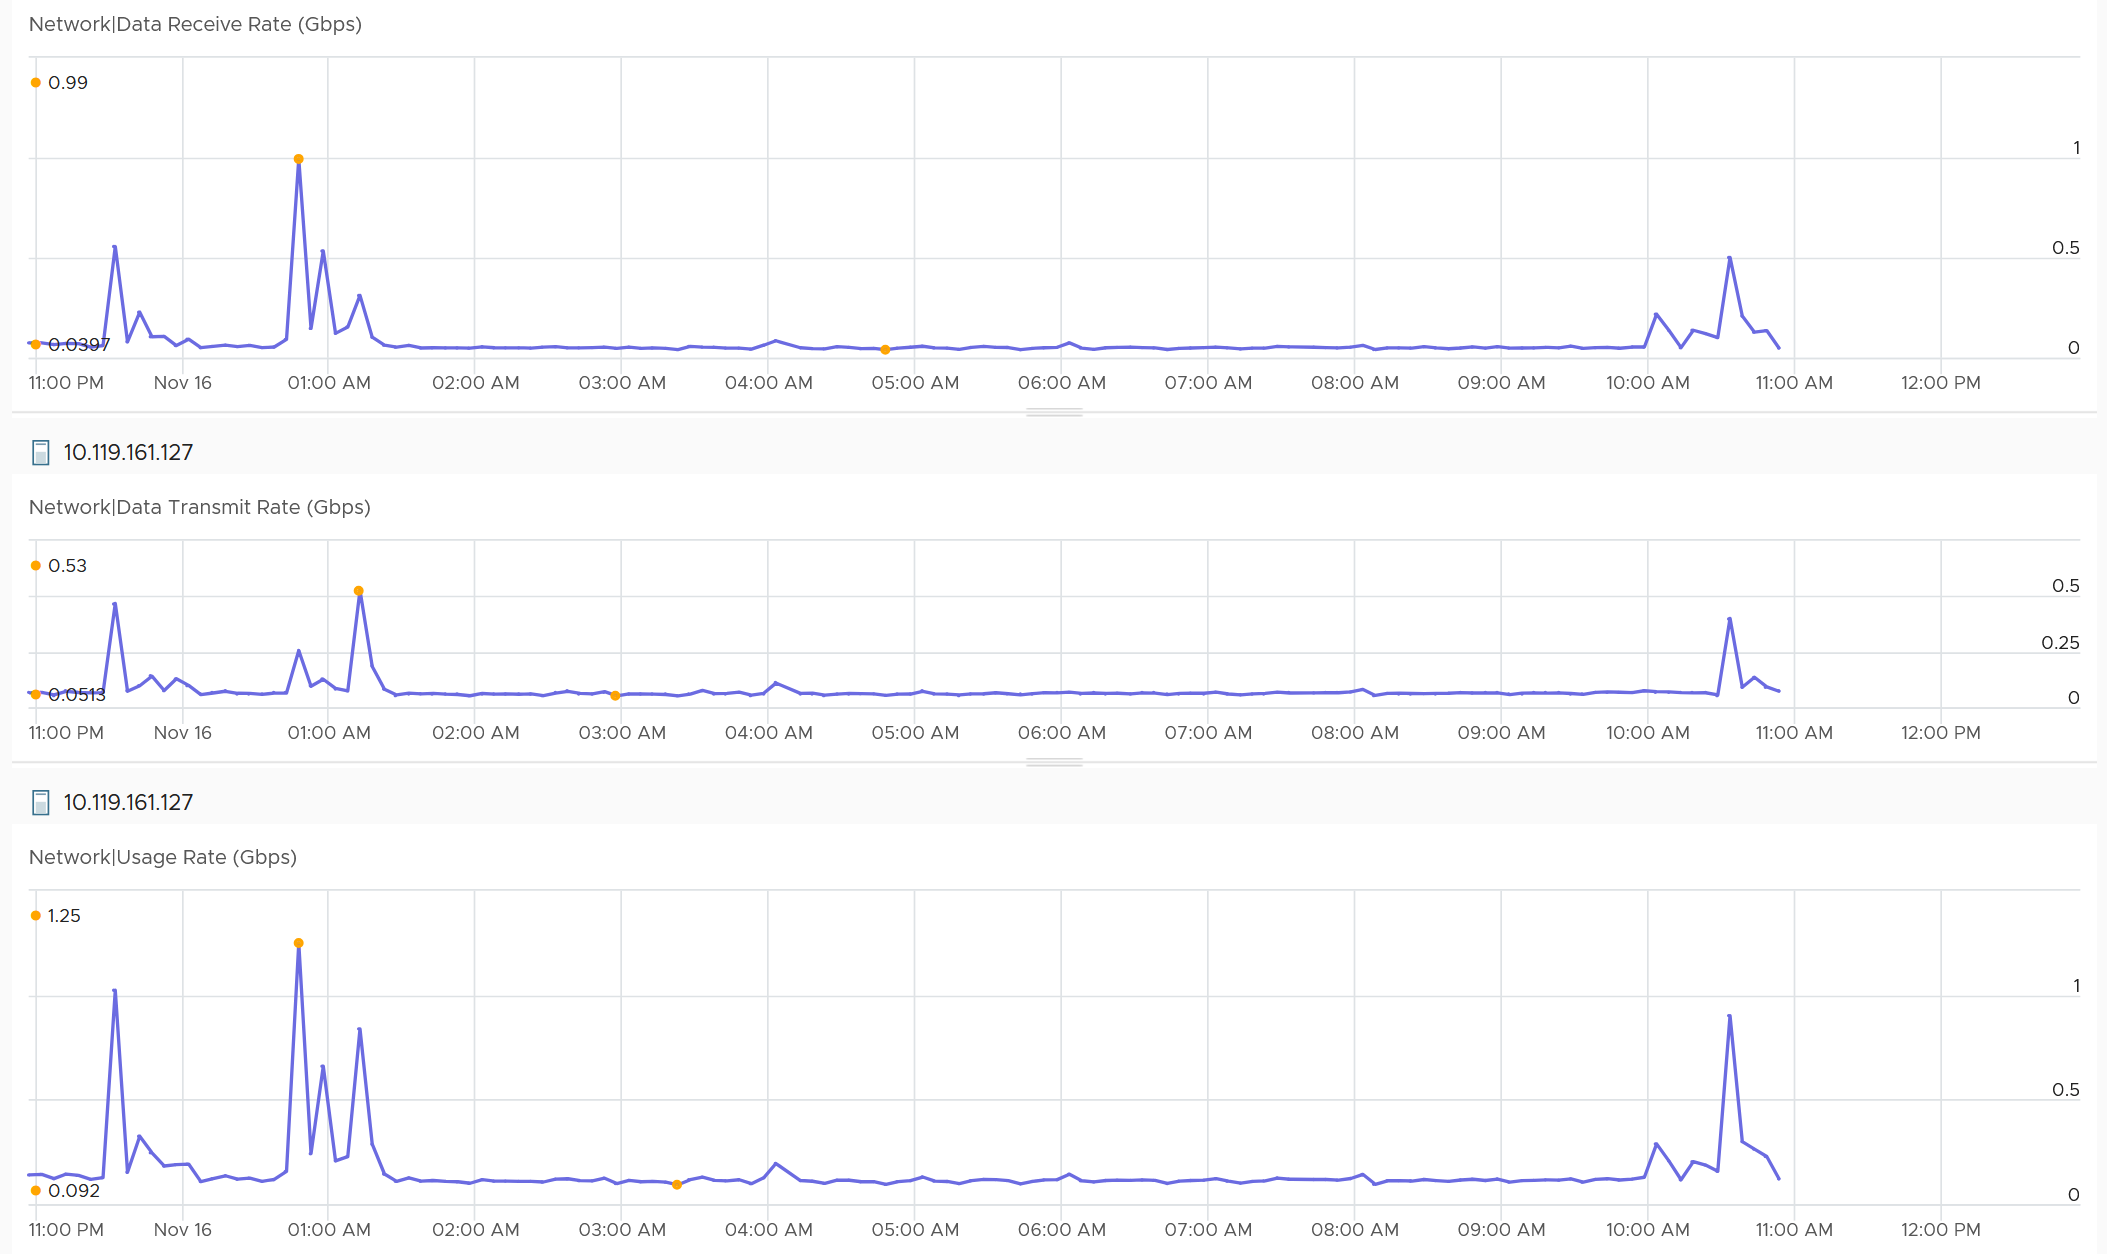
We covered earlier that full duplex means the aggregated metric can exceed the physical speed. Notice the Usage Rate is the sum of Receive and Transmit on the following screenshot.
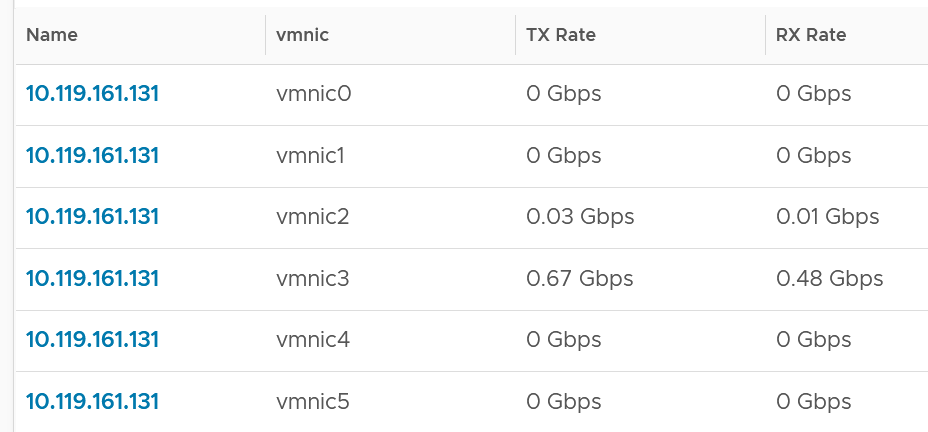
You can also plot each vmnic one by one. Since you may not know which one to plot for a given ESXi, you can show them all in table first.
For packets/second, the metrics are:
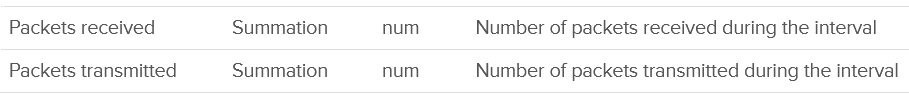
It’s interesting to divide the packet/second with the bits/second, as you get the packet size. If this number change drastically in large environment, it’s something worth investigating.
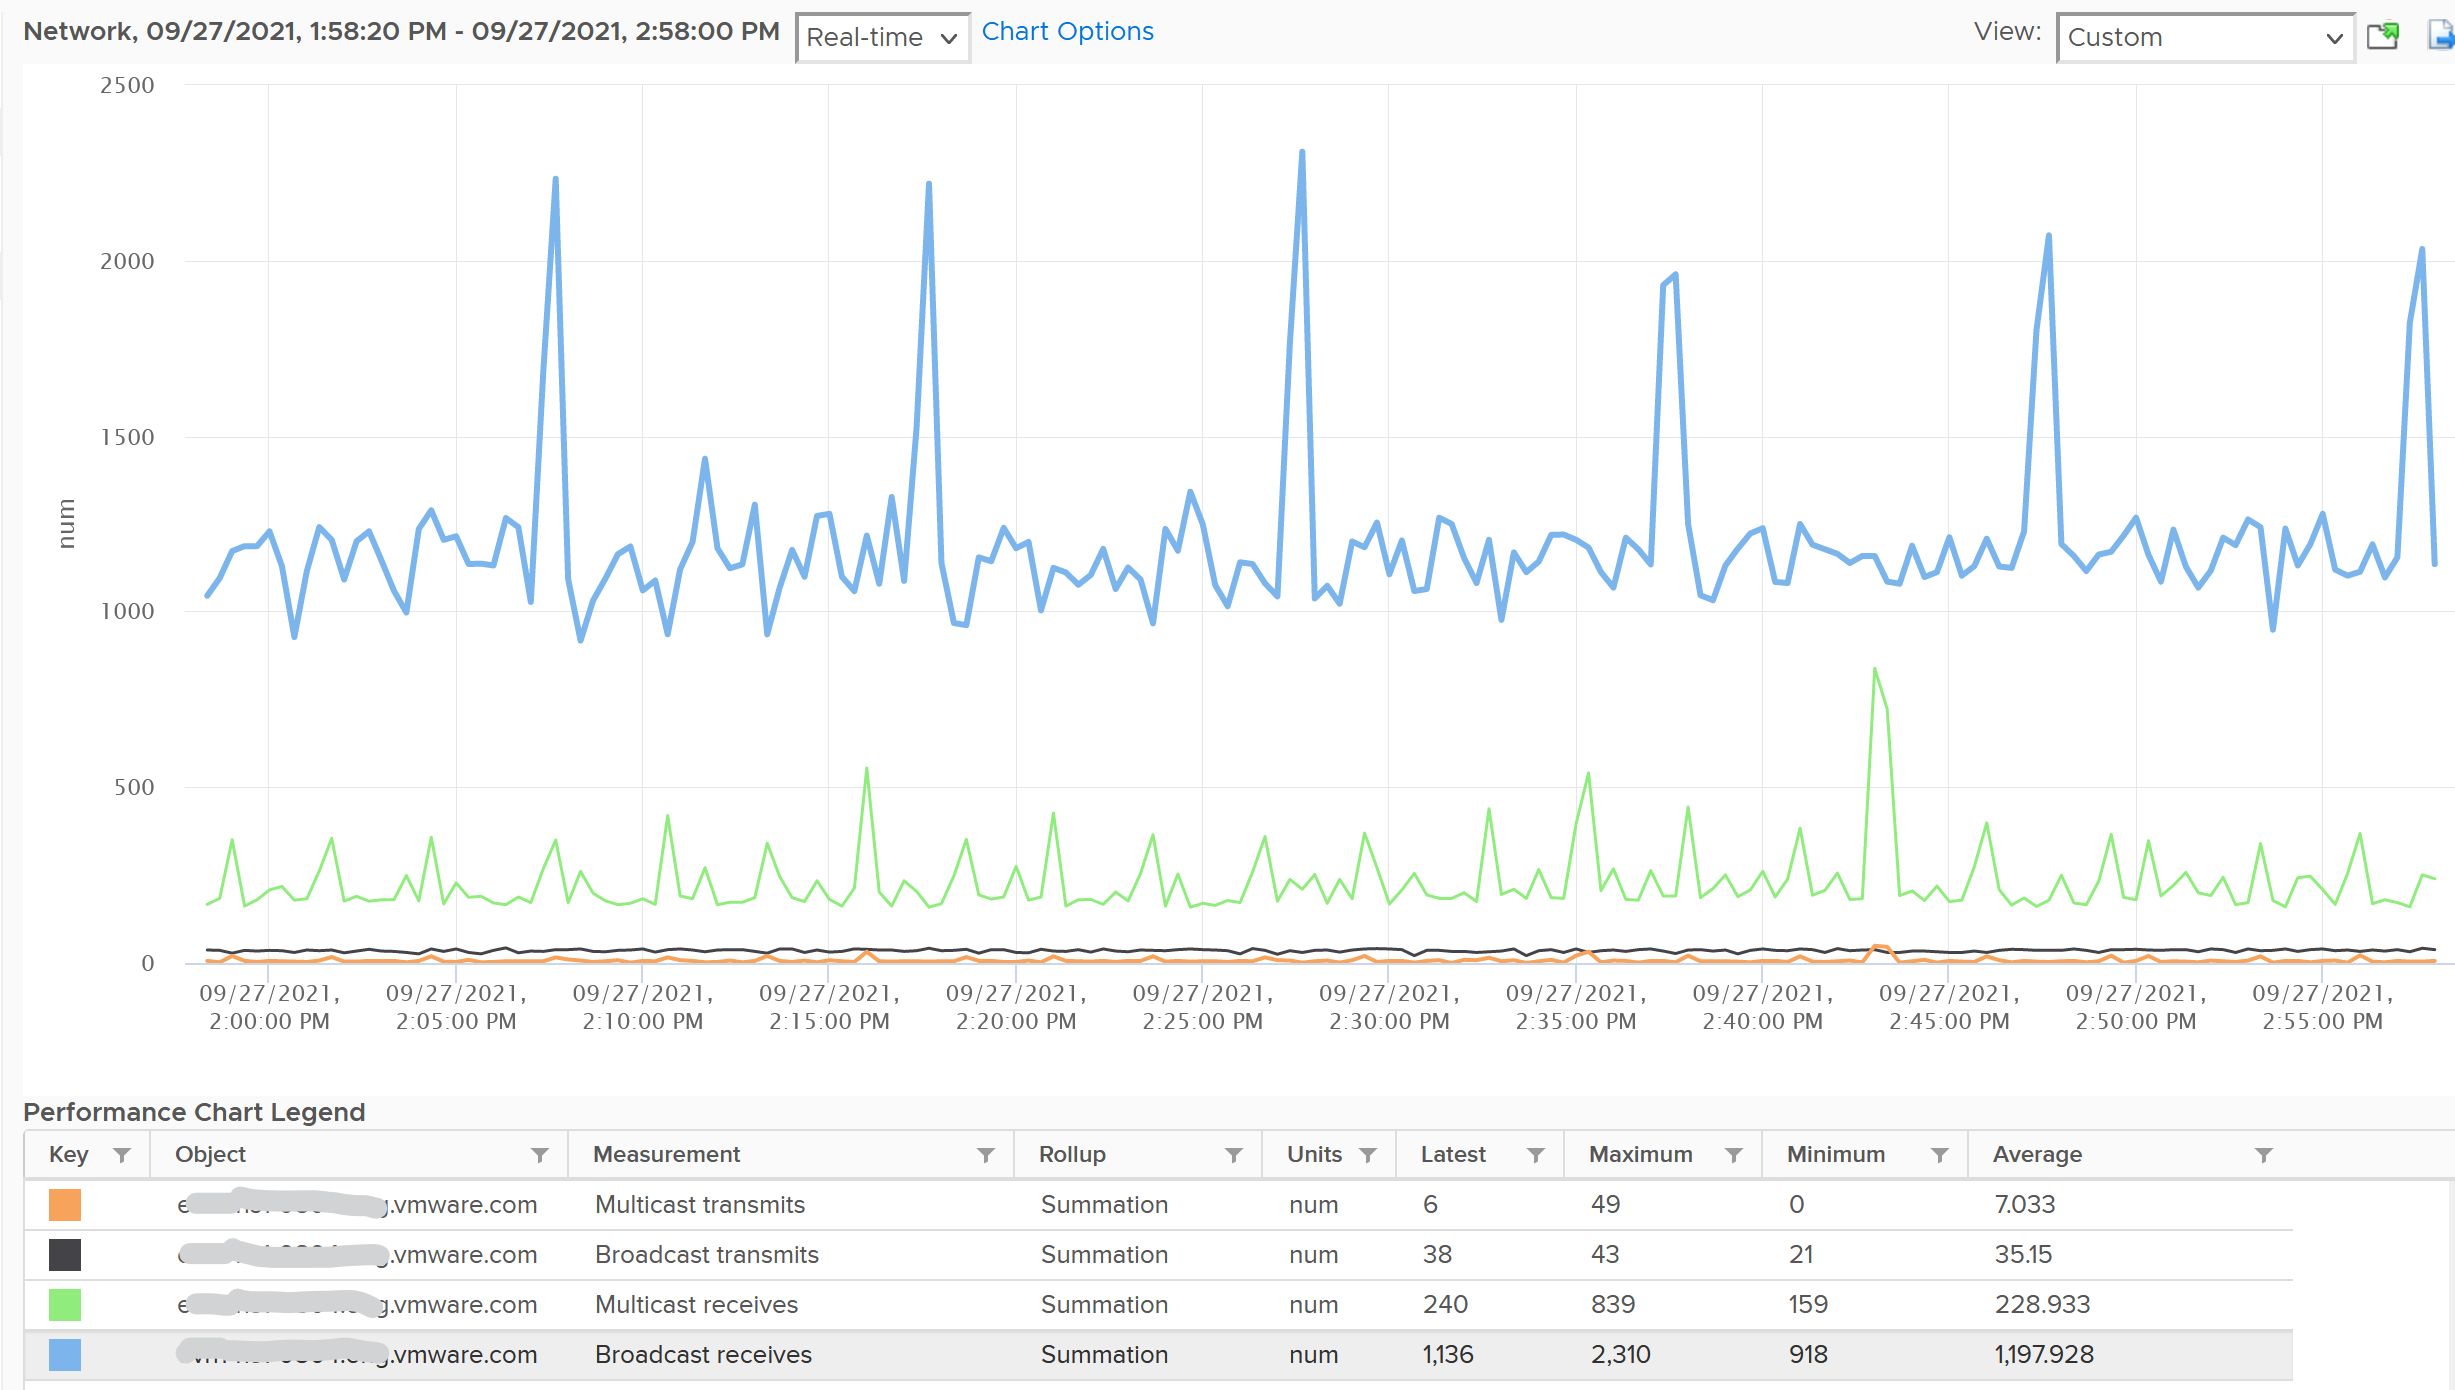
Unusual Packets
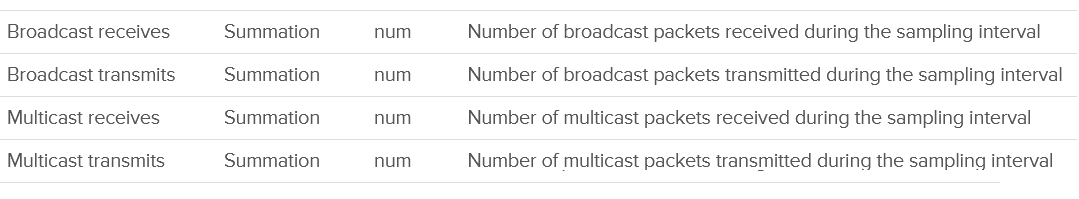
Your VM network should be mostly unicast traffic. So check that broadcast and multicast are within your expectation. Your ESXi Hosts should also have minimal broadcast and multicast packets.
Part 3 Chapter 6