Network
Part 3 Chapter 5
Architecture
Network monitoring is complex, especially in large data centers. Adding network virtualization takes the complexity of performance troubleshooting even higher.
Just like CPU, Memory and Disk, there is also a new layer introduced by virtualization. There are virtual network cards on each VM, and software-based switch on each ESXi bridging the VM card to the physical NIC card. The various ESXi kernel modules also do not “talk” directly to the physical card. Basically, what used to be the top of rack switch are now living inside each ESXi as a software switch.
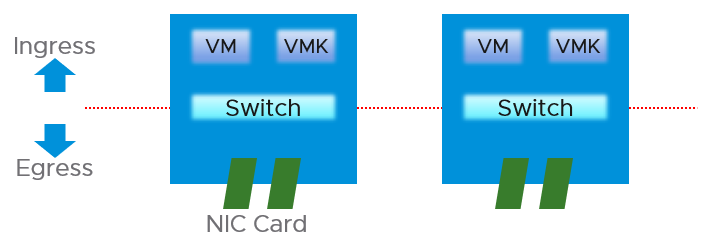
vSphere Client shows the 2 layers side by side (personally I prefer up and down, with the physical layer placed below).
| Virtual Network | There are 2 types:
They do not mix, for security reason. The kernel port group runs specific traffic, such as vMotion and vSAN. The VM port group runs VM. If the traffic is just a VM-to-VM traffic, within the same ESXi, the packets does not reach the physical network, hence the metrics do not register it. This is why the values in virtual do not always match physical. The virtual network does not have the limit that physical network does, if the traffic remains in the box. This makes it harder to troubleshoot as the total capacity is not statically defined. So instead of just monitoring the throughput metric, you should also check the packet per second metric. |
|---|---|
| Physical Network | They are called vmnic instead of pNIC Metrics at this level do not have per-VM breakdown, or per kernel interface breakdown |
Unique Characteristics
From performance and capacity management point of view, network has different fundamental characteristics to compute or storage. The key differences are summarized below.
| | Compute or Storage | Network |
|---------------------------------|--------------------|-----------------|
| Nature | A node | An interconnect |
| Hardware | Single purpose | Multi-purpose |
| Location | Fewer | Many |
| Upper Limit | Yes | No |
| Net available resource to VM | Relatively high | Low |
| Resource allocation at VM level | Granular | Coarse |
| Monitoring | Simpler | Harder |
| Workload Type | 1 | Many |
| Primary Unit | Byte | Bit |
Nature of Network
Compute and storage are nodes. They are dots, while network are lines.
When you have a CPU or RAM performance issue on one host, it doesn't typically impact another host on a different cluster. The same thing happens with storage. When a physical array has a performance issue, generally speaking it does not impact other arrays in the data center.
Network is different. A local performance issue can easily be a data center-wide problem. Here is a good read by shared Ivan Pepelnjak. To give a recent example (H2 2021), here is one from a world-class network operator1:
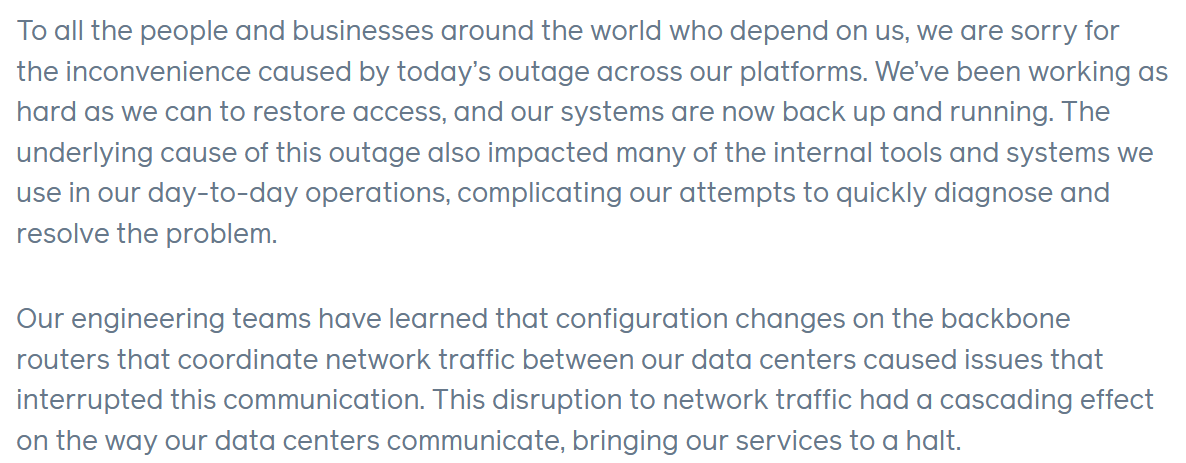
Being an interconnect, it also connects users and servers to the Internet. If you have a global operation, you likely have multiple entry points, provided by different providers. These connectivity needs to be secured and protected with HA, preferably from 2 different ISPs.
There are typically many paths and routes in your network. You need to ensure they are available by testing the connectivity from specific points.
Hardware
The networking hardware itself can provide different functionalities.
For compute, you have servers. While they may have different form factors or specifications, they all serve the same purpose—to provide processing power and a set of working memory for hypervisor or VM.
For network, you have a variety of network services (firewall and load balancer) in addition to the basic network functionalities (switch, router, and gateway). You need to monitor all of them to get a complete picture. These functionalities can take the form of software or hardware.
Unlike storage, network has concept of duplex. A full duplex means it has 100% on both directions. For example, an ESXi with a 25 Gb port can theoretically handle 25 Gb TX + 25 Gb RX as its full duplex.
Blade servers and other HCI form factors blur the line between server and network.
Location
Server and storage tend to be located fewer places. Even in the ROBO office, they are typically located in a rack, with proper cooling and physical security. Network switch, especially Wireless Access Points, need to be placed in multiple places within the building, if that’s required to provide enough network coverage.
Solution such as SDWAN even requires a network device to be deployed at employee home. I actually have the Dell edge device at my home.
Total Capacity
CPU or RAM workload have a per VM physical limit. This makes capacity management possible, and aids in performance troubleshooting.
While network has a physical limit, it can be misleading to assume it is available to all VMs all the time. Because the physical capacity of the network is shared, you have a dynamic upper limit for each workload. The VM Network port group will have more bandwidth when there is no vMotion happening. Furthermore, each VM has a dynamic upper limit as it shares the VM Network port group with other VMs.
The resource available to VM also varies from host to host. Within the same host, the limit changes as time progresses. Unlike Storage I/O Control, Network I/O Control does not provide any metrics that tell you that it has capped the bandwidth.
In many situations, the bandwidth within the ESXi host may not be the smallest pipe between the originating VM and its destination. Within the data center, there could be firewalls, load balancers, routers, and other hops that the packet has to go through. Once it leaves the data center, the WAN and Internet are likely to be a bottleneck. This dynamic nature means every VM has its own practical limit.
Net Available Resource
At the end of the day, the net available resources to the VMs are what we care about. What the IaaS platform used is considered an overhead. The more ESXi kernel, NSX, vSAN, vSphere Replication use, the lesser you have left for the business workload.
An ESXi host has a fixed specification (for example, 2 CPUs, 60 cores, 1 TB RAM, 2 x 50 GE NIC). This means we know the upper physical limit. How much of that is available to the VMs? Another word, what is the usable capacity for the business workload?
For compute, the hypervisor consumes a relatively low proportion of resources. Even if you add a software-defined storage such as vSAN, you are looking at around 10% total utilization but depends on many factors.
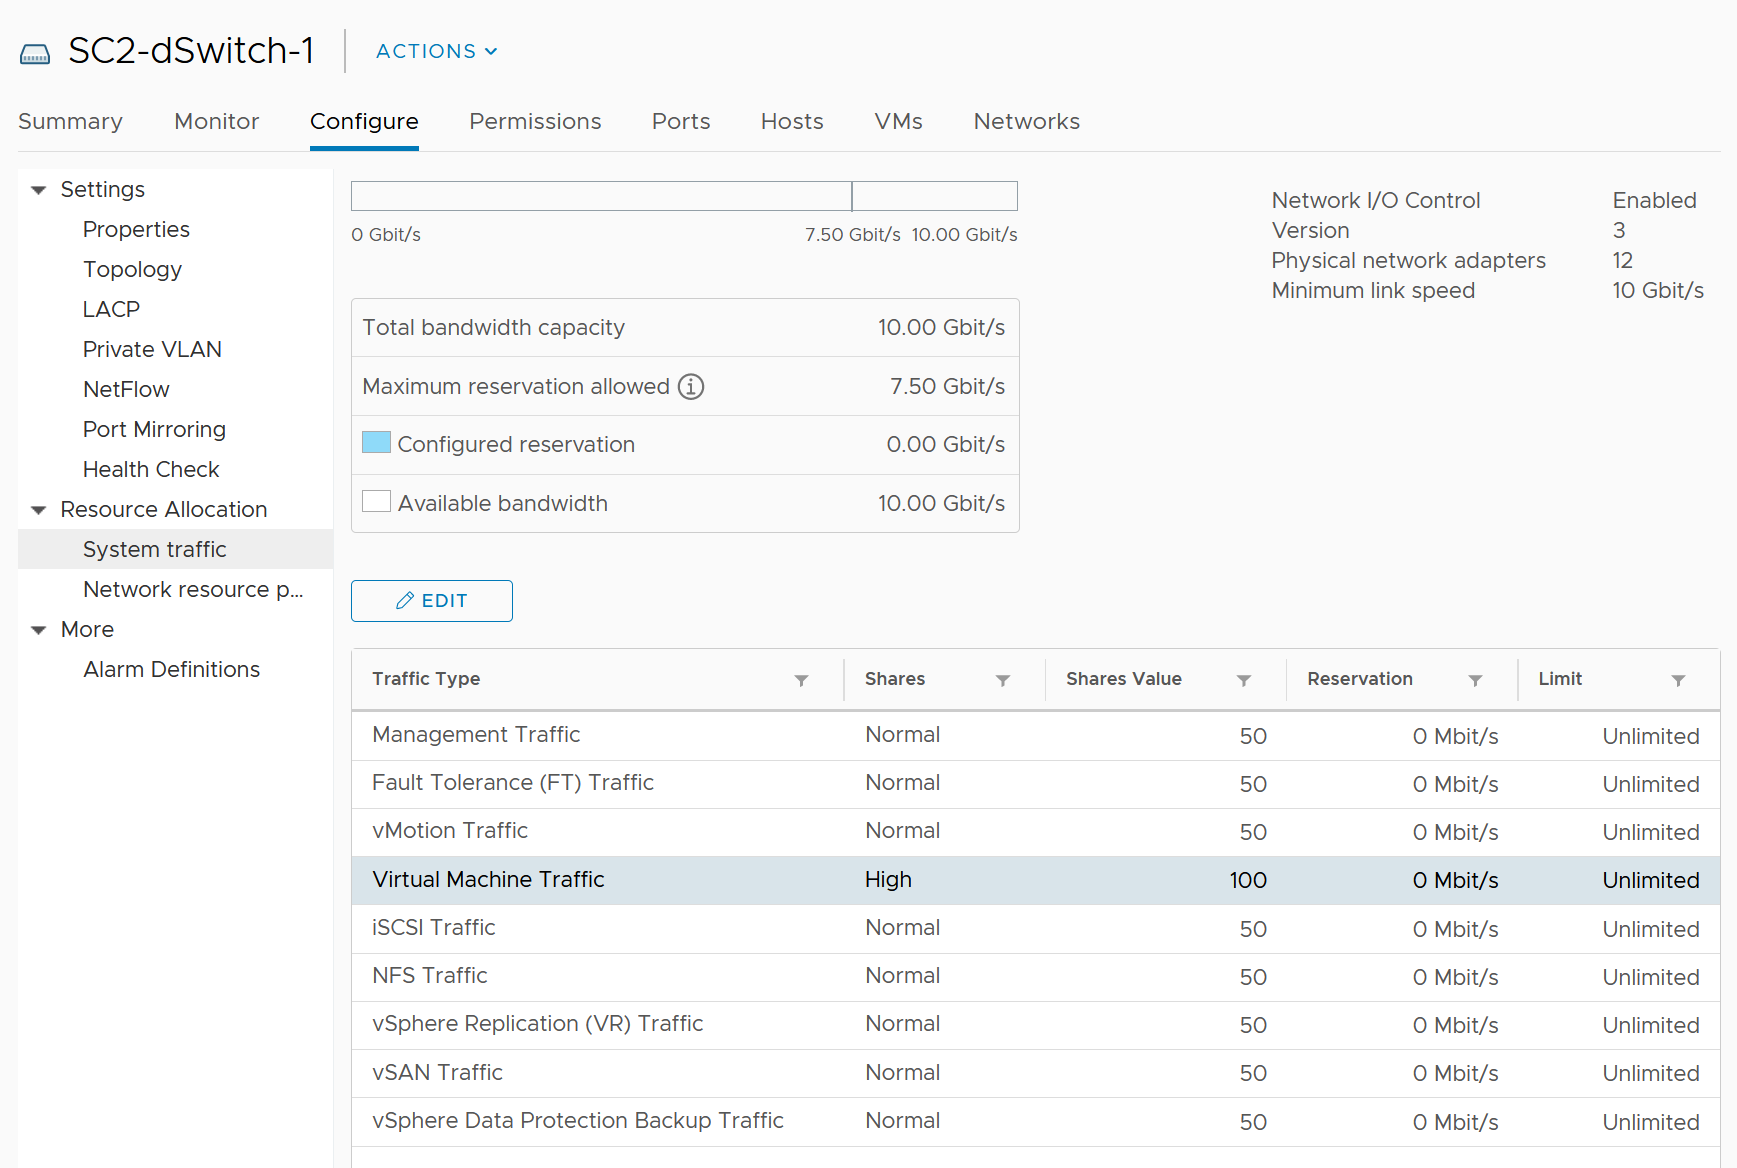
The same cannot be said about network. Mass vMotion (for example, when the host enters maintenance mode), storage vMotion (in IP storage case), VM provisioning or cloning (for IP storage), and vSAN all take up significant network bandwidth. In fact, the non-VM network takes up the majority of the ESXi resources. If you have 2 x 25 GE NIC, majority of it is not used by VM. The following screenshot shows that VM only gets 100 shares out of 500 shares. So the overhead can be as high as 80%.
Resource Allocation
This means the resource that is given to a single VM itself. For compute, we can configure a granular size of CPU and RAM. For the CPU, we can assign one, two, three, four, etc. vCPUs.
With network, we cannot specify the vNIC speed. It takes the speed of the ESXi vmnic assigned to the VM port group. So each VM will either see 1 GE or 10 GE or 25 GE (you need to have the right vNIC driver, obviously). You cannot allocate another amount, such as 500 Mbps or 250 Mbps in the Guest OS. In the physical world, we tend to assume that each server has 10 GE and the network has sufficient bandwidth. You cannot assume this in a virtual data center as you no longer have 10 GE for every VM at the physical level. It is shared and typically oversubscribed.
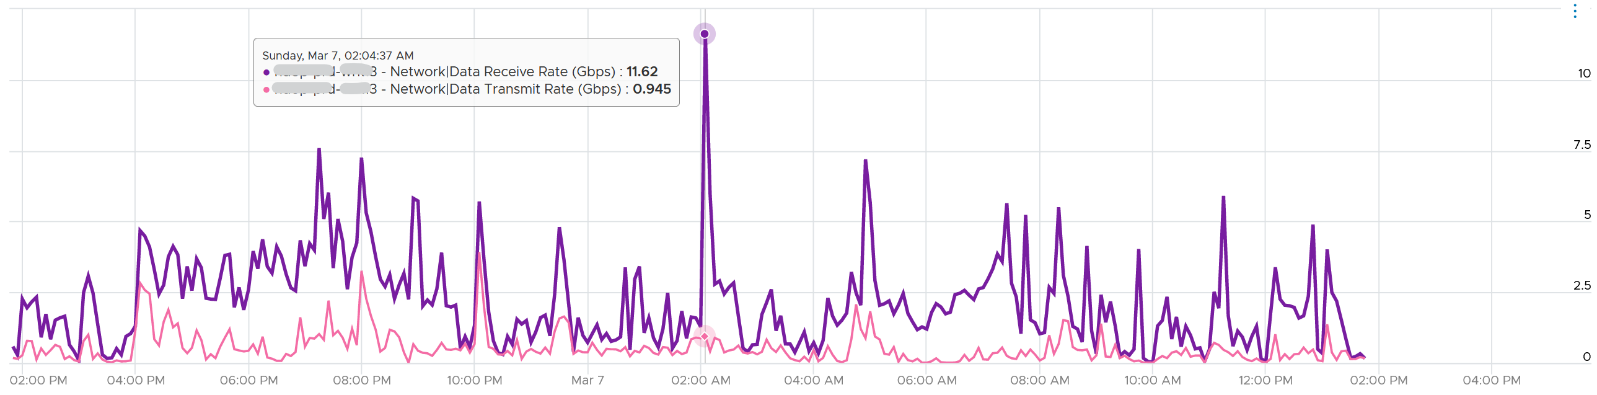
A network intensive VM can easily hit 1 Gbps for both egress and ingress traffic. The following chart shows a Hadoop worker node receiving more than 5 Gbps worth traffic multiple times. You need to be careful in sizing the underlying ESXi if you want to run multiple VMs. While you can use Network I/O Control and vSphere Traffic Shaping, they are not configuration property of a VM.
Monitoring and Troubleshooting
A distributed system is harder to monitor than a single node, especially if workload varies among the components that make up the system.
The network resource available to VM also varies from host to host. Within the same host, the limit changes as time progresses. Unlike Storage I/O Control, Network I/O Control (NIOC) does not provide any metrics that tell you that it has capped the bandwidth.
NIOC can help to limit the network throughput for a particular workload or VM. If you are using 10 GE, enable NIOC so that a burst in one network workload does not impact your VM. For example, a mass vMotion operation can saturate the 10 Gb link if you do not implement NIOC. In vCenter 7, there is no counter that tracks when NIOC caps the network throughput. You may need to check the log for that.
The primary contention metrics are
-
Latency.
-
Dropped Packets
-
Retransmit Packets. For TCP, dropped packets will be retransmitted.
-
Jitter. This measures the inconsistency of the latency. An application may tolerate poor latency better than variable latency.
Note there is no latency and retransmit metrics in vSphere.
Remember that Storage has 2 metrics (IOPS and Throughput) for consumption? Network also has these 2 types, except the more popular one is the throughput. The PPS (packet per second) is less popular although they are useful in gaining insight into your network. It takes up a significant CPU time to process high number of packets with low latency, as you can see in NSX edge VM.
Workload Type
In network, not all packets are of the same type. You can have unicast, multicast and broadcast.
Majority of traffic should be unicast, as ESXi or VM should not be broadcasting to all IP addresses in the network or multicasting to many destinations. The challenge is there are purposes for each type so you need to monitor if the broadcast and multicast happen at the wrong time in the wrong network.
Storage and Server only have 1 type of workload. From operations management viewpoint, for almost all customers, A CPU instruction is a CPU instruction. You do not care what it is. The same goes with memory access and disk IO commands.
Conclusion
Because of all these differences, the primary unit is bit, not byte. Storage uses byte as it focuses on the amount of disk space consumed by the data.
The way you approach network monitoring should also be different. If you are not the network expert in your data center, the first step is to partner with experts.
BTW, there are other things which I did not cover. For example, in network there are basic services such as DNS and NTP. All these services need to be monitored, typically for availability and reliability.
Network Observability
The arrival of software-defined infrastructure services also changes the way you monitor your network. The following diagram shows a simplified setup of an ESXi host.
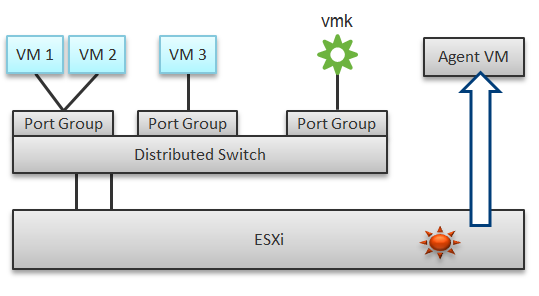
In a single ESXi host, there are 4 areas that need to be monitored for a complete network monitoring:
-
VM network
-
The kernel network
-
ESXi kernel modules
-
Agent VMs
There are 2 layers of networking.
-
The virtual network consists of VM and the kernel (e.g. vMotion). If the traffic is a VM to VM traffic within the same ESXi, the packets does not reach the physical network, hence the vmnic metrics do not register it. The virtual network does not have the limit that physical network does, if the traffic remains in the box. This makes it harder to use this metric as the 100% is not statically defined. So instead of just monitoring the throughput metric, you should also check the packet per second metric.
-
The physical network means traffic going through the physical network card. At this level it’s no longer aware of VM and the kernel.
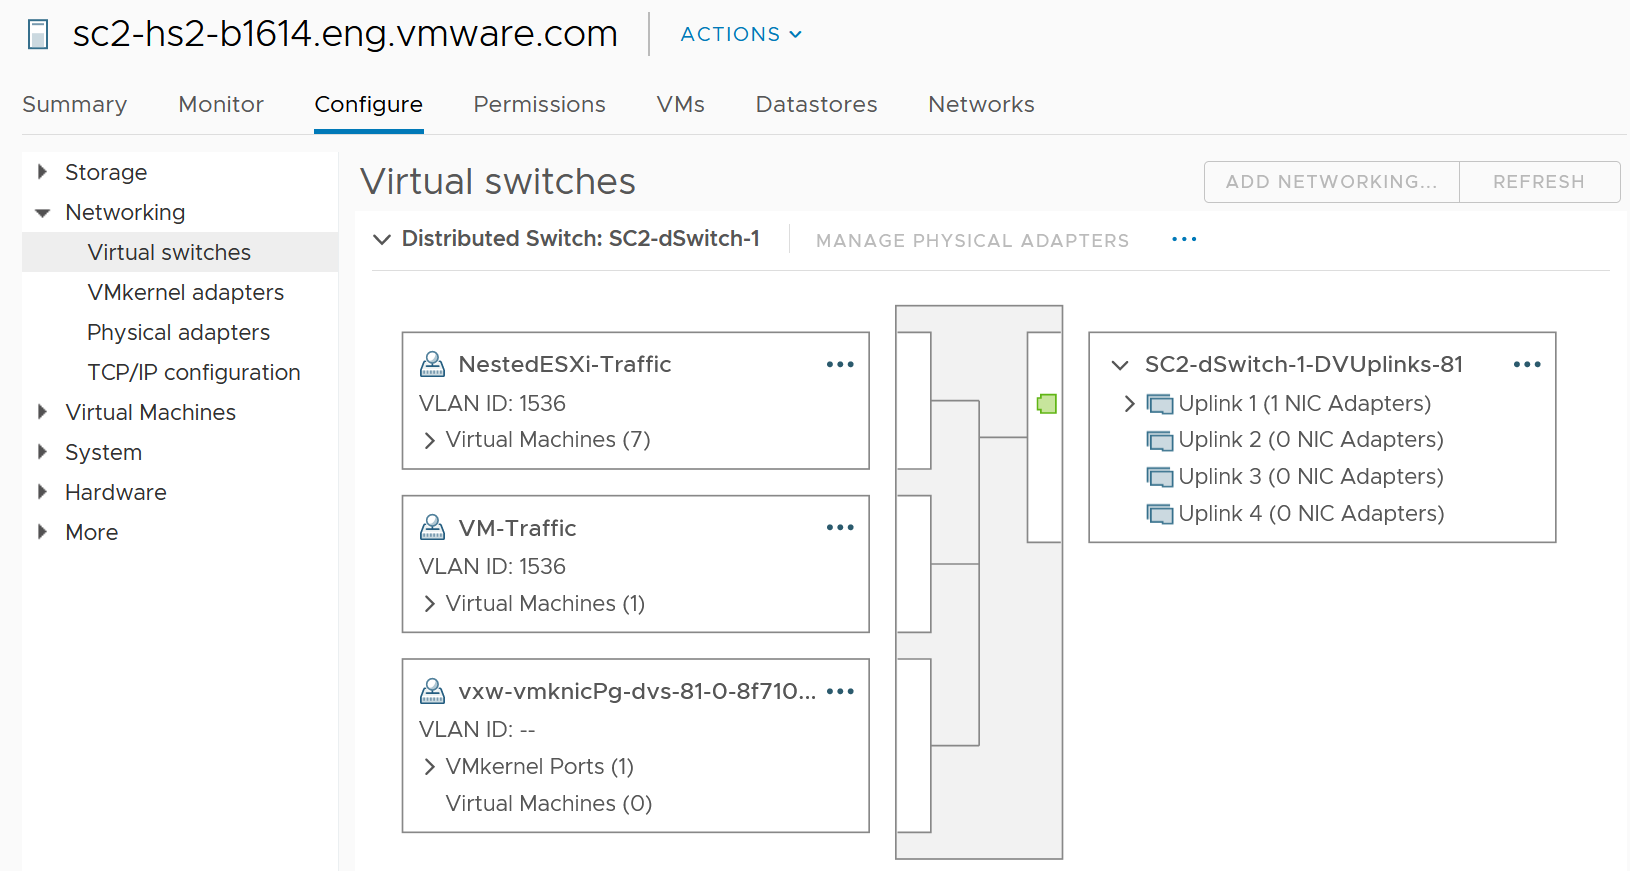
In the preceding example, we have 3 VMs running in the host. VM 1 and VM 2 are connected to the same VXLAN (or VLAN). VM 3 is on a different VXLAN (or VLAN), hence it is on a different port group. Monitoring at port group level complements monitoring at VM level and ESXi level.
Traffic at Distributed Switch level carries more than VM traffic. It also carries the kernel traffic, such as vMotion and VSAN. Both the kernel network and VM network tend to share the same physical uplinks (ESXi vmnic). As a result, it’s easier to monitor at port group level.
Sounds good so far. What is the limitation of monitoring at distributed port group level?
The hint is at the word distributed.
Yes, the data is the aggregate of all the ESXi hosts using that distributed port group!
By default, VM 1 and VM 2 can talk to each other. The traffic will not leave the ESXi. Network monitoring tools that are not aware of this will miss it. Traffic from VM 3 can also reach VM 1 or VM 2 if NSX Distributed Logical Router is in place. It is a kernel module, just like the NSX Distributed Firewall. As a result, monitoring these kernel modules, and the host overall performance, becomes an integral part of network monitoring.
The 4th area we need to monitor is Agent VM. An Agent VM is mapped to 1 ESXi Host. It does not need HA protection as every ESXi host has one, hence it typically resides on the host local datastore.
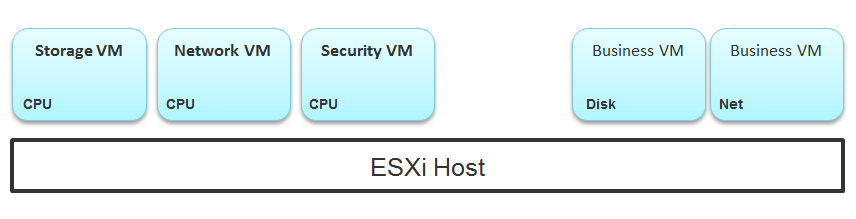
The above example shows an ESXi host with 3 agent VMs. The first VM provides a storage service (an example is Nutanix CVM), the second VM provides Network service, and the 3rd VM provides a Security VM.
Let’s use the Security service as an example. A popular example here is Trend Micro Deep Security virtual appliance. It is in the data path. If the Business VMs are accessing files on a fileserver on another network, the files have to be checked by the security virtual appliance first. If the agent VM is slow (and it could be due to factor that is not network related), it will look like a network or storage issue as far as the business VMs are concerned. The Business VMs do not know that their files have been intercepted for security clearance, as it is not done at the network level. It is done at the hypervisor level.
Source of Data
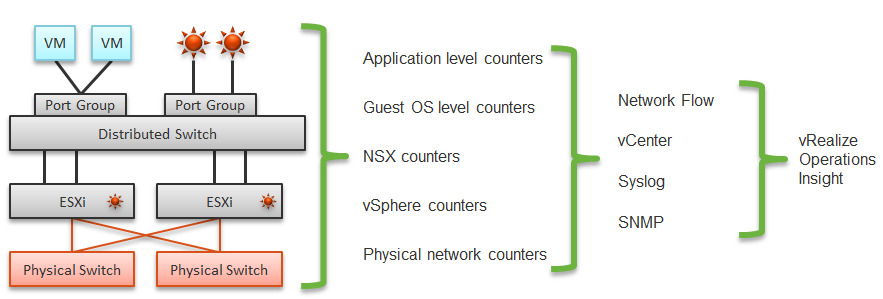
A complete network monitoring requires you to get the data from 5 different sources, not just from vSphere. In SDDC, you should also get data from the application, Guest OS, NSX and NetFlow/sFlow/IPFIX from VDS and physical network devices. For VDI, you need to get data at application level. We have seen packet loss at application-layer (Horizon Blast protocol) when Windows sees no dropped packet. The reason was the packet arrives out of order and hence unusable from protocol viewpoint.
The following shows a simplified stack. It shows the five sources of data and the 4 tools to get the data. It includes a physical switch as we can no longer ignore physical network once you move from just vSphere to complete SDDC.
The network packet analysis comes in 2 main approaches: Header analysis and full packet analysis. The header analysis is certainly much lighter but lack the depth of full analysis. You use this to provide overall visibility as it does not impose heavy load on your environment.
The impact of virtualization on network monitoring goes beyond what we have covered. Let’s add NSX Edge into the above, so you can see the traffic flow when the edge services are also virtualized. You will see that a network problem experienced by a VM on one ESXi could be caused by another VM running on another ESXi. The following diagram is a simplified setup, showing a single NSX Edge residing on another cluster.
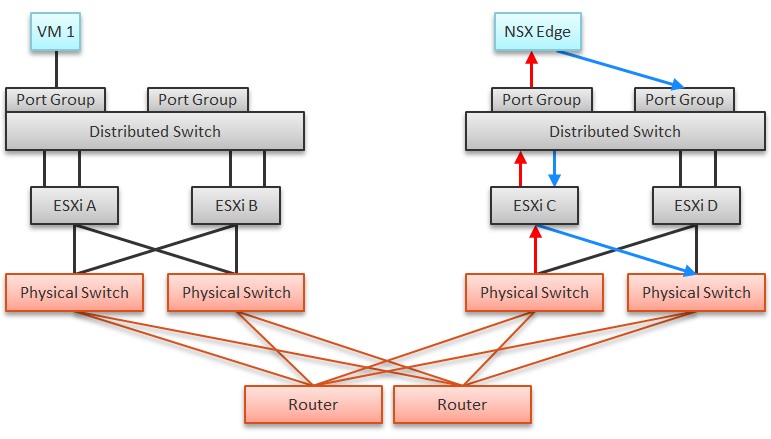
In the above example, let’s say VM 1 needs to talk to outside world. An NSX Edge VM provides that connectivity, so every TCP/IP packet has to go through it. The Edge VM has 2 virtual NICs, one for each network. If the NSX Edge VM has CPU issue, or the underlying ESXi has RAM issue, it can impact the network performance of VM 1.
| Type | Guest OS Metric | VM Equivalent |
|---|---|---|
| Contention | Dropped Packet | None, as the dropped packet at VM is a different level. |
| Latency | None, no such metric available in vSphere | |
| Utilization | Throughput | They should match with the metrics at VM level. If not, there is dropped packets. They should be reported based on traffic type: unicast, multicast, broadcast. |
| Packet/second |
Traffic Flow
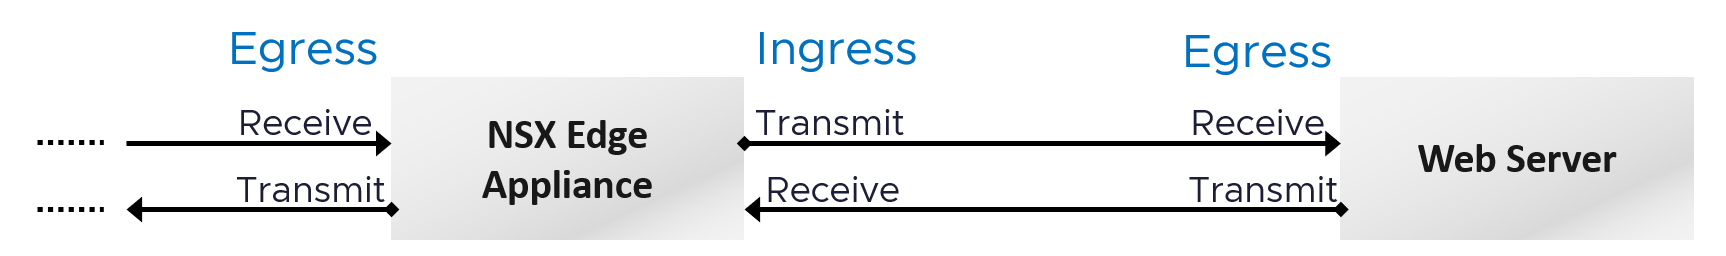
The terminology Egress and Ingress are used in context of an environment. For example, the flow from a VM to the Internet, where it will hop through different types of network devices. Typically, going further “inside” is considered ingress. That’s why a VM does not have ingress traffic.
The terminology receive/RX and transmit/TX/send are used in context of a single port. A port has both incoming and outgoing traffic.
The following shows a simple example:
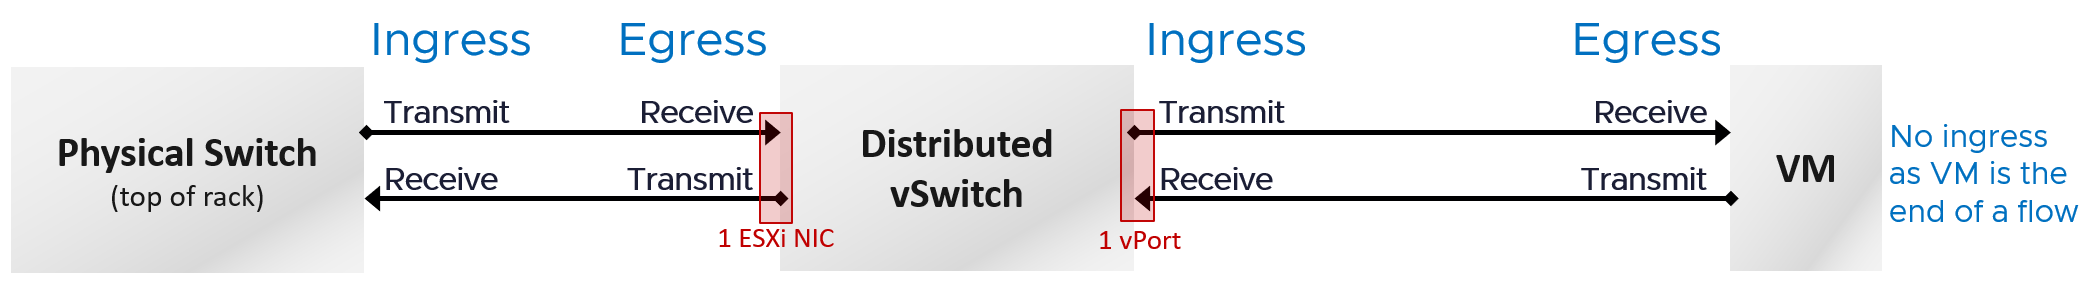
The following applies that to vSphere distributed vSwitch. Notice the ESXi host is not shown as it’s not part of the hop. The ESXi host physical NIC card is the distributed vSwitch uplink.
Traffic Type
VCF Operations provides these metrics at VM, ESXi, Distributed Port Group and Distributed Switch level. As vSphere Tanzu Pod is basically a VM, it also has the metric.
BTW, one way to check what objects in what adapter have the specific metric is in the VCF Operations policy. Open any policy, and search the metric using its name. The list of matching metrics will be shown, grouped by the objects.
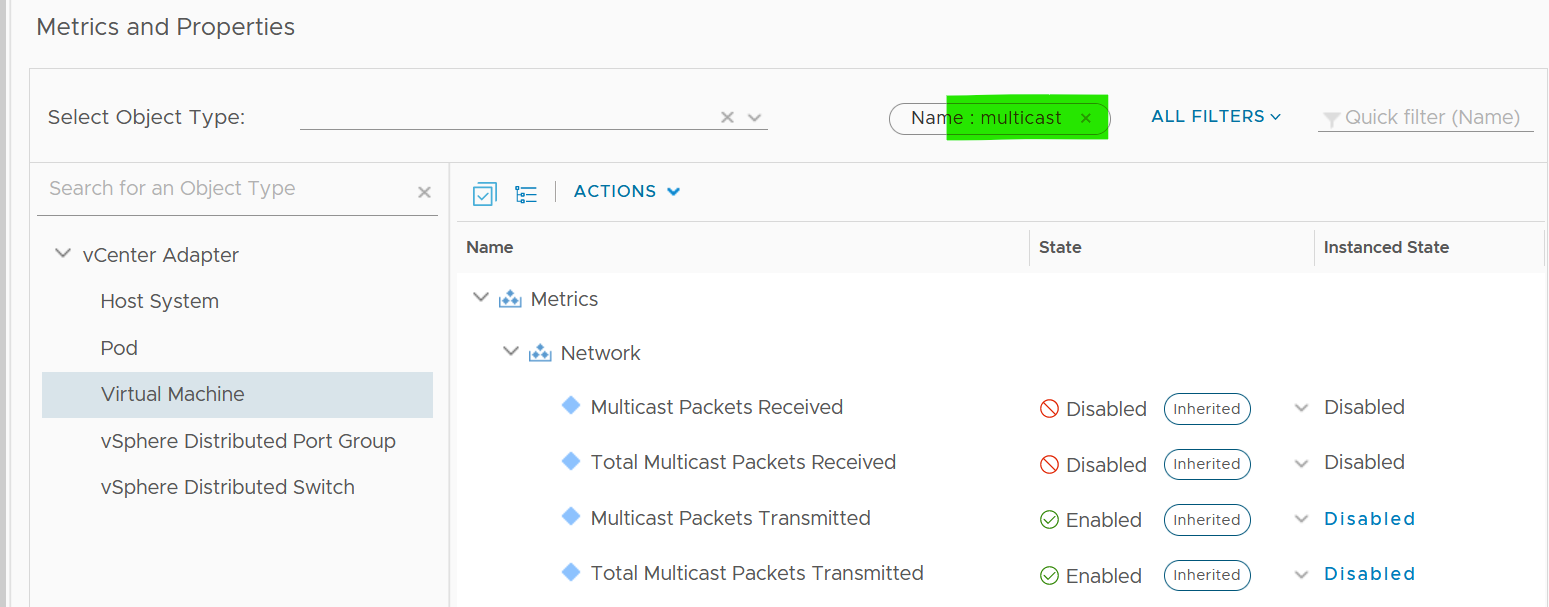
As you can see from above, there is no aggregation at higher level, so create super metric for the time being. I have not created those metric out of the box as I’m yet to use them in dashboard or alert.
Packet Size
It’s typically 1600 byte with NSX, or 9000 bytes if you enable jumbo frames).
Special purpose packet such as ping test is smaller. But they should be a small percentage of your network.
Track the packet sizes and compare them with your expectation.
Footnotes
-
The name of this Internet giant is irrelevant for this purpose, as it could have happened to anyone. It happens more often on smaller companies. BTW, notice how they made the text grey so it’s harder to read! ↩