esxtop
Now that we have covered many of the metrics, the esxtop output would be easier to understand. This documentation is not about how to use esxtop, but about what the metrics mean and their relevance in operations management.
Overview
While the manual uses the term Guest, esxtop does not actually have any Guest OS metrics. Distinguish between Guest OS and VM as they are 2 different realms.
The view from a VM (consumer) and the view from ESXi (provider) are of opposite nature. vCPU is a construct of a VM, while core and thread are constructs seen by ESXi. You get to see both VM level and ESXi level objects at the same time. It is confusing for newbie, but convenient for power user, and if you’re looking at esxtop, you are a power user 😊
The nature of esxtop means it is excellent for performance troubleshooting, especially real time and live situation where you know the specific ESXi Host. The tool is not so suitable for capacity management, where you need to look at long term (often weeks or months). As a result, I cover the contention metrics first, followed by consumption.
I have not had the need to use some of the metrics, hence I don’t have much guidance on them. If you do, let’s collaborate.
Grouping
The esxtop screen groups the metrics into 10 screen panels, as shown below:
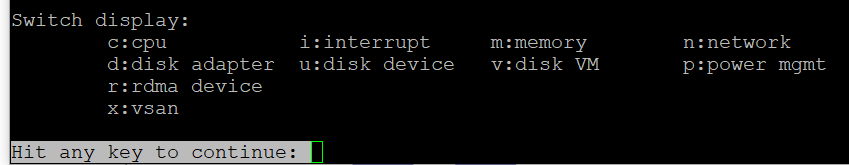
There are relationships among some of the 10 panels, but they are not obvious as the UI simply presents them as a list. To facilitate understanding of the metrics, we need to group them differently.
So instead of documenting the 10 panels, I’d group the panels into 4.
| Group | Consumer | Provider | Remarks |
| CPU | Yes | Sort of | The CPU panel has a 4 line summary that provides the provider’s viewpoint. I moved Power Management panel here as it only covers CPU. It does not cover memory, disk, network and other parts of the box (e.g. fan, motherboard). It complements the CPU panel as it covers the provider’s viewpoint. Take note that it does not show at socket level. And if you enable HT, it does not show at core level. I moved interrupt panel here as it’s about CPU. |
| Memory | 1 shared panel for both | Provider and Consumer are shown in 1 panel. The panel has a summary at the top, which cover the provider’s viewpoint | |
| Storage | Yes | Almost | The Disk VM panel covers from consumer’s viewpoint. The Disk Adapter panel and Disk Device panel cover from provider’s viewpoint, and are best to be analyzed together. BTW, notice the Path panel is missing. I moved vSAN panel here as all the metrics are disk metrics. There is no vSAN network and CPU counter, but you can see them in the respective network and CPU panel. |
| Network | 1 shared panel for both | Provider and Consumer are shown in 1 panel I moved RDMA device here as it’s about network card | |
Export
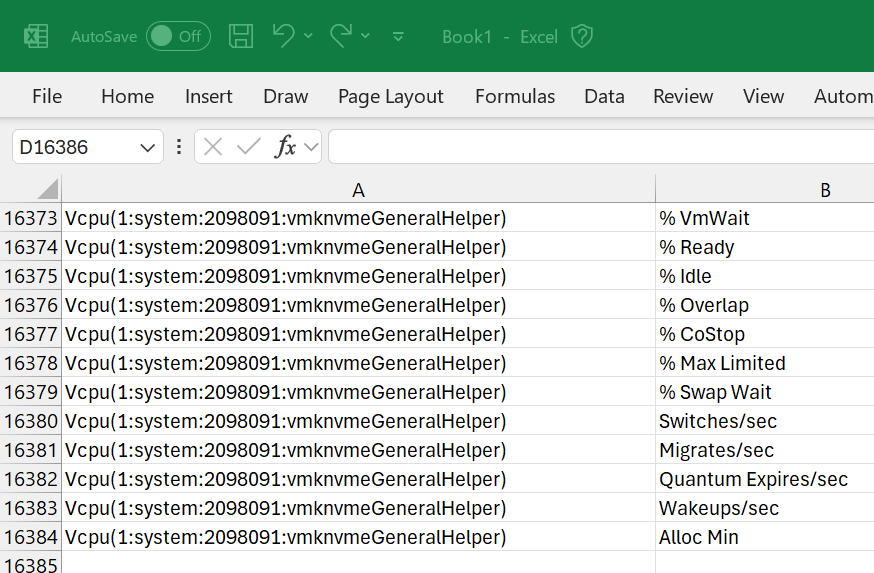
Avoid exporting to CSV file. If you need to do it, limit to specific metrics and keep the time short. If you collect everything, you end up with a large file (easily > 100 MB) with >10K metrics. The following shows 16384 metrics being collected.
CPU
The CPU panel consists of 2 parts:
-
Summary
-
Detail. It shows a table.
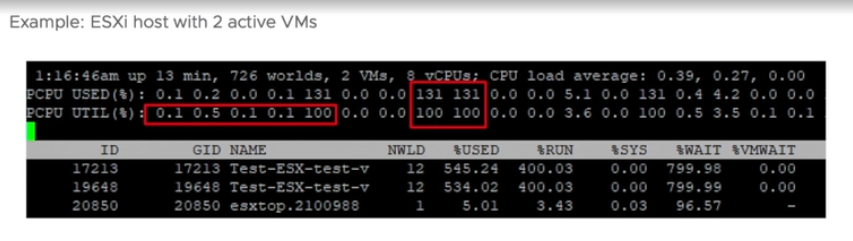
Here is the summary section. It has 4 lines.
The first line shows the summary of the physical load average in the last 1 minute, 5 minute and 15 minutes, respectively.
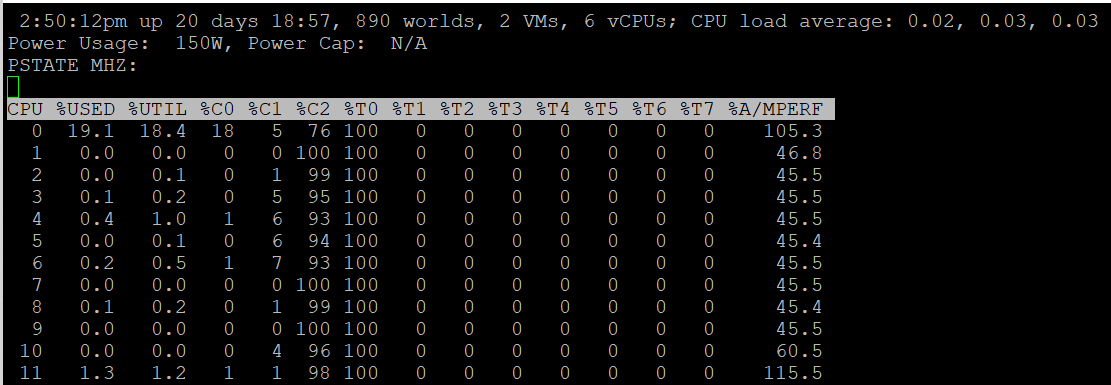
The next 3 lines covers Used (%), Utilization (%) and Core Utilization (%). The reason why I swapped the order in the book is Used (%) is built upon Utilization, and it’s a more complex counter. You can see in the following screenshot1 that Used (%) hit 131% while Util (%) maxed at 100%.
Note that their values are in percentage, meaning you need to know what they use for 100%.
If you guess that Used (%) and Utilization (%) eventually map into vSphere Client metrics Usage (%) and Utilization (%), respectively, you are right. However, you need to know how they map.
PCPU means a physical, hardware execution context. That means it is a physical core if CPU SMT is disabled, or a physical thread inside a core if SMT is enabled. It does not mean CPU socket. A single socket with 10 cores and 20 threads will have 20 PCPU metrics.
The white vertical line shows where I cut the screenshot, as the text became too small and unreadable if I were to include all of them. Anyway, it’s just repeating for each CPU physical thread.
At the end of each 3 lines (after the white line in preceding screenshot), there are NUMA information. It shows the average value across each NUMA node (hence there are 2 numbers as my ESXi has 2 NUMA nodes). The number after AVG is the whole box, system wide average. The per NUMA node metric values are useful to easily identify if a particular NUMA node is overloaded.
The detail section takes a consumer view. It is different to the physical view above.
Take a look at the panel below. Notice something interesting?
It mixes VM and non VM processes in a single table. The non-VM also has Ready time. What it does not have is VM Wait, which is expected.
If you want to only show VMs, just type the capital letter V.
-
Name based filtering allows regular expression based filtering for groups and worlds.
-
Type the capital letter G to only show groups that match given string. This is useful when a host has large number of VMs and you want to focus on a single or set of interesting VMs.
-
Once a group is expanded you can type the small letter g to show only the worlds that match the given string. This is useful when running a VM with many vCPUs and you want to focus on specific worlds like storage worlds or network worlds.
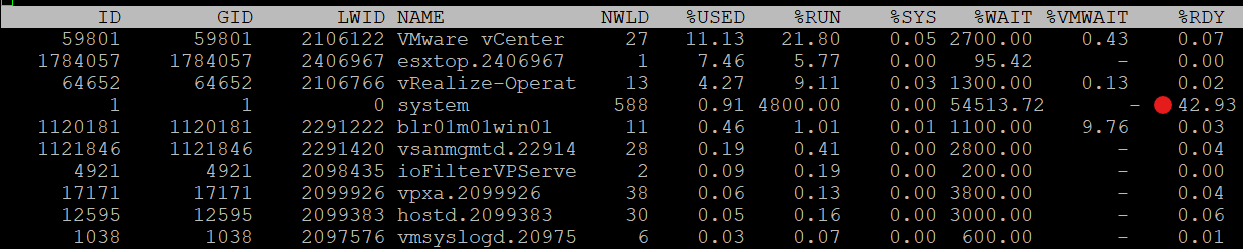
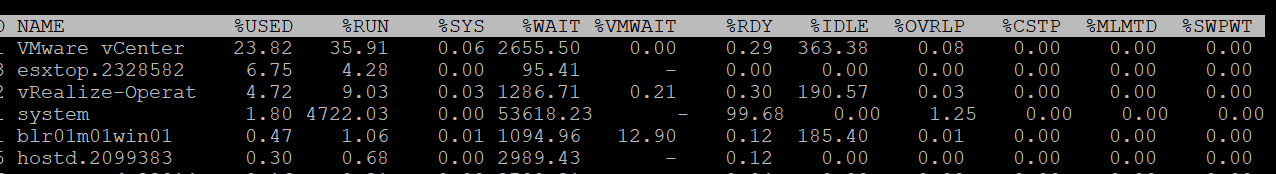
If you want to see all, how to tell which ones are VM? I use %VMWAIT column. This tracks the various waits that VM world gets, so it does not apply to non VM.
Notice the red dot in the picture. Why the Ready time is so high for system process?
Because this group includes the idle thread. Expand the GID and you will see Idle listed.
There are many columns, as shown below. The most useful one is the %State Times, which you get by pressing F.
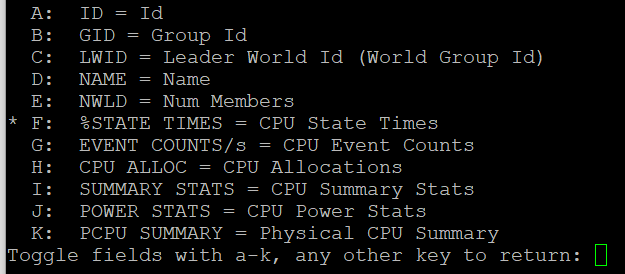
The rest of the information are relatively static or do not require sub-20 second granularity.
You know that only Utilization (%) and Used (%) exist at the thread level because they are the only one you see at, as shown below.
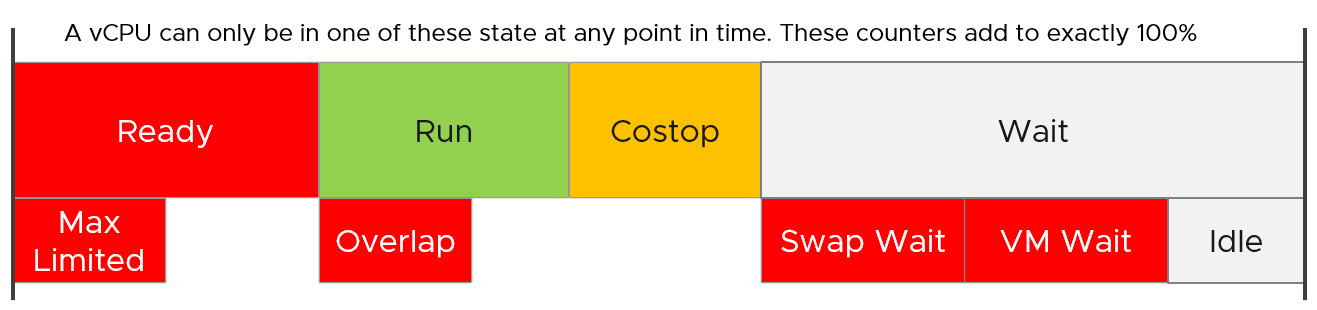
CPU State
We covered earlier in the CPU Metric that there are only 4 states. But esxtop shows a lot more metrics.
So what does it mean? How come there are more than 4 states?
The answer is below. Some of these metrics are included in the other metrics.
Review the metrics below, starting with %USED.
Which one does not actually belong to a CPU state, meaning it’s not something you mix with the rest?
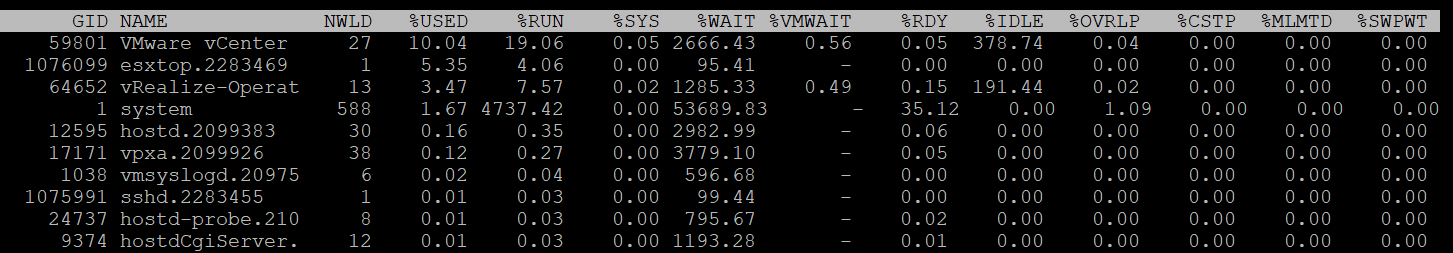
That’s right, it’s %USED.
| %USED | It should be excluded from this panel as it is influenced by power management and hyperthreading. We explained the reason why in CPU Metric chapter. That’s why it’s necessary to review the VM CPU states before reading each esxtop metric. |
|---|---|
| %RUN | Run is covered in-depth under VM CPU Metrics. |
| %SYS | System time is covered in-depth under VM CPU Metrics. |
| %WAIT | The wait counter and its components are covered in-depth under VM CPU Metrics. VMWAIT includes SWPWT. VCF Operations does not show VM Wait and uses a new counter that excludes Swap Wait. The reason is the remediation action is different. You’re welcome. |
| %VMWAIT | |
| %SWPWT | |
| %IDLE | |
| %RDY | Ready is covered in-depth under VM CPU Metrics. As discussed in the CPU scheduling, each vCPU has its own ready time. In the case of esxtop, the metric is simply summed up, so it can go >100% in theory. |
| %CSTP | Co-Stop is covered in-depth under VM CPU Metrics. This is also 100% per vCPU. |
| %OVRLP | Overlap is covered in-depth under VM CPU Metrics. |
| %MLMTD | MLMTD is Max Limited, not some Multi-Level Marketing scam 😊. It measures the time the VM was halted due to manual limit, as opposed to the kernel has no CPU resource. This is more of an event as you should not be setting limit in the first place. |
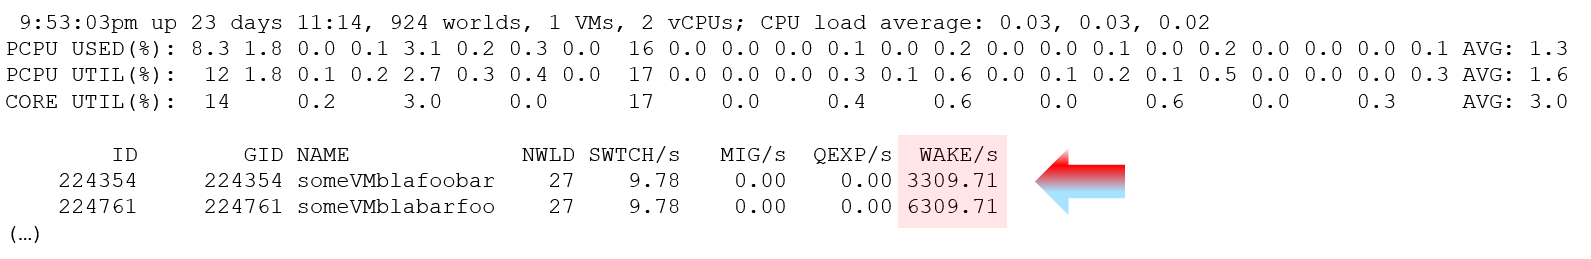
CPU Event Count
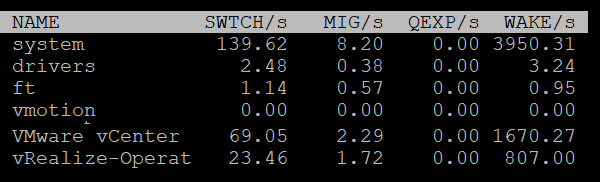
| SWTCH/s | Number of world switches per second, the lower the better. I guess this number correlates with the overcommit ratio, the number of VM and how busy they are. What number will be a good threshold and why? |
|---|---|
| MIG/s | Number of NUMA and core migrations per second. It will be interesting to compare 2 VM, where 1 is the size of a single socket, and the other is just a bit larger. Would the larger one experience a lot more switches? |
| WAKE/s | Number of time the world wakeups per second. A world wakes up when its state is changes from WAIT to READY. A high number can impact performance. |
The metric QEXP/s (Quantum Expirations per second) has been deprecated from ESXi 6.5 in an effort to improve vCPU switch time.
In rare case where the application has a lot of micro bursts, CPU Ready can be relatively higher to its CPU Run. This is due to the CPU scheduling cost. While each scheduling is negligible, having too many of them may register on the counter. If you suspect that, check esxtop, as shown below:
Summary Stats
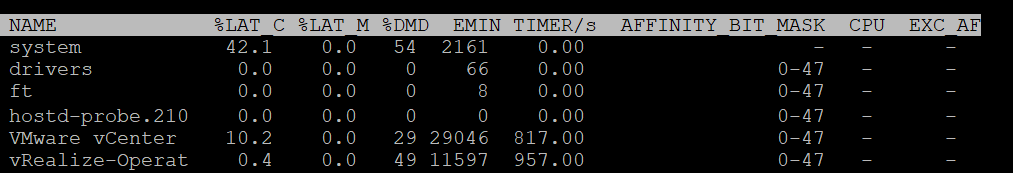
Other than the first 3 (which I’m unsure why they are duplicated here as they are shown in the CPU State already), the other metrics do not exist in vSphere Client UI and VCF Operations.
| %LAT_C | This is covered in-depth in CPU Contention |
|---|---|
| %LAT_M | This is covered in-depth in Memory contention |
| %DMD | This is covered in-depth in CPU Demand |
| EMIN | This is the minimum amount of CPU in MHz that the world will get when there is not enough for everyone. |
| TIMER/s | Timer rate for this world |
| AFFINITY BIT MASK | Bit mask showing the current scheduling affinity for the world. Not set for Latency Sensitive = High VMs |
| CPU | The physical or logical processor on which the world was running when esxtop obtained this information. BTW, I’m not 100% sure as this is always blank for me |
| EXC_AF | Yes means the VM has exclusive affinity. This happens when you enabled the Latency Sensitivity setting. Use this feature very carefully. |
The column HTQ is no longer shown in ESXi 7.0. In earlier release, this indicates whether the world is quarantined or not. ‘N’ means no and ‘Y’ means yes.
CPU Allocation
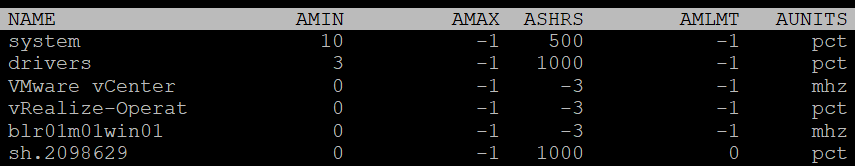
| AMIN | Allocation Minimum. Basically, the reservation |
|----|----|
| AMAX | Allocation Maximum. Basically, the limit. |
| ASHRS | Allocation shares |
| AMLMT | Max Limited. I’m unsure if this is when it’s applied or not. |
| AUNITS | Units. For VM, this is in MHz. For the kernel module, this is in percentage. |
Power Stats
This complements the power management panel as it lists per VM and kernel module, while the power panel lists per ESXi physical treads (logical CPU).
| POWER | Current CPU Power consumption in Watts. So it does not include memory, disk, etc. |
|----|----|
Power Consumption
Power management is given its own panel. This measures the power consumption of each physical thread. If you disable hyper-threading, then it measures at physical core.
The Power Usage line tracks the current total power usage (in Watts). Compare this with what the hardware specification. Power Cap shows the limit applied. You only do this hard limit when there is insufficient power supply from the rack.
The PSTATE MHZ line tracks the CPU clock frequency for each state.
Now let’s go into the table. It lists all the physical core (or thread if you enable HT). Note it does not group them by socket.
| %USED | Used (%) metric is covered in-depth in ESXi CPU metric sub-chapter. |
| %UTIL | Utilization (%) metric is covered in-depth in ESXi CPU metric sub-chapter. |
| %CState | Percentage of time spent in a C-State, P-State and T-State. Power management is covered in System Architecture sub-chapter. |
| %TState | |
| %A/Mperf | Actual / Measured Performance, expressed in percentage. The word measured in this case means the nominal or static value. So a value above 100% means Turbo, while a value below 100% means power saving kicked in. If this number is not what you are expecting, check the power policy settings in BIOS and ESXi. Notice this is not on a vCPU. This means you do not know the boost per VM. This counter is only applicable when the core is on %C0 state. In the preceding example, ignore the values from CPU 1 – CPU 11. |
The following screenshot shows ESXi with 14 P-States, where P0 is represented as 2401 MHz. Each row is a physical thread as HT is enabled.
See PCPU 10 and 11 (they share core 6). What do you notice?
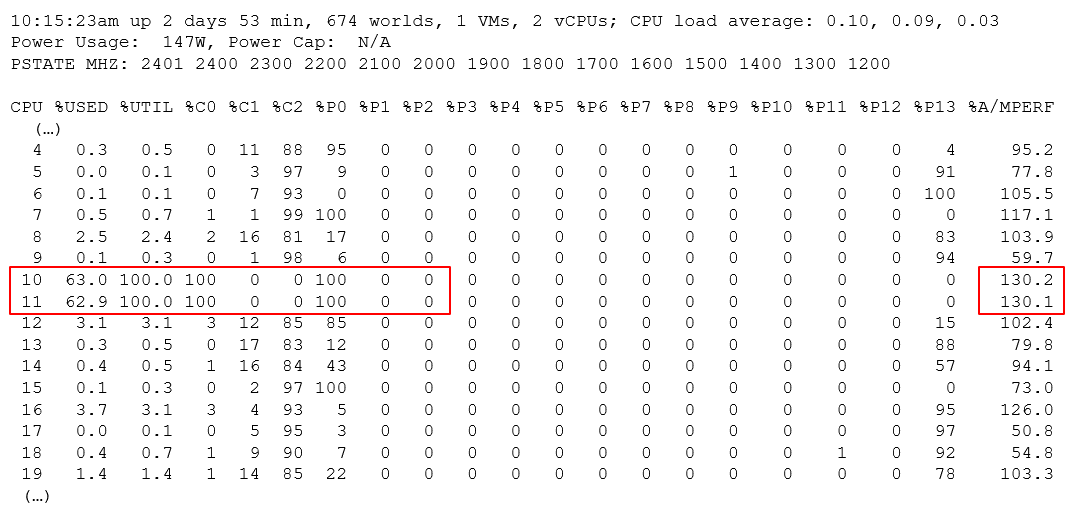
Utilization (%) shows 100% for both. This means both threads run, hence competing.
The core is in Turbo Boost. The %A/MPERF shows frequency increase of 30% above nominal. The core is in C0 state and P0 state. This counter was introduced in ESXi 6.5. It is not available via vSphere Client UI.
Why is Used (%) for PCPU 10 and 11 are showing 63.0% and 62.9%?
Unlike Utilization (%) which adds up to 200%, Used (%) adds up to 100%. So each thread maxes out at 50%. But Used (%) considers frequency scaling. Since there is a turbo boost at 130%, you get 50% x 130% = 65%. Pretty close to the numbers shown there.
Interrupt
This panel captures the interrupt vectors. In the following screenshot, I’ve added 2 vertical white lines to show where I cropped the screenshot. It’s showing the value of each CPU thread, so the column became too wide.
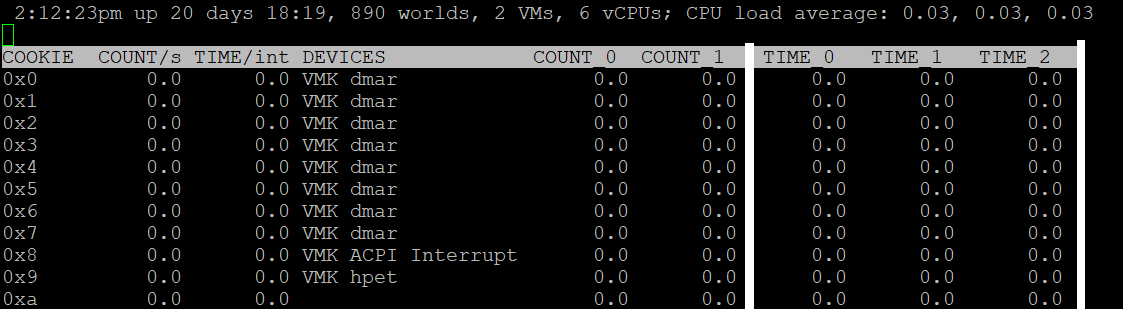
| COUNT/s | Total number of interrupts per second. This value is cumulative of the count for every CPU. |
| COUNT_x | Count 0, Count 1, etc. Interrupts per second on CPU x. My guess is CPU 0 is the first thread in the first core in the first socket. |
| TIME/int | Average processing time per interrupt (in microseconds). It will be interesting to profile this for each type of interrupt. |
| TIME_x | Time 0, Time 2, etc. Average processing time per interrupt on CPU x (in microseconds). |
| DEVICES | Devices that use the interrupt vector. If the interrupt vector is not enabled for the device, its name is enclosed in angle brackets (< and >). |
To see the list of devices, issue the command at ESXi console: sched-stats -t sys-service-stats. You will get something like this:
service count time maxElapsed maxService name
32 98973493 171.267 0.000 0.000 VMK-lsi_msgpt3_0
33 93243036 153.993 0.000 0.000 VMK-lsi_msgpt3_0
34 1783955246 1841.025 0.000 0.000 VMK-igbn-rxq0
36 4 0.000 0.000 0.000 VMK-Event
37 167025903 418.733 0.000 0.000 VMK-xhci0-intr
51 242318260 792.014 0.000 0.000 VMK-0000:19:00.1-TxRx-0
60 21281764 80.125 0.000 0.000 VMK-vmw_ahci_00003b000
244 176227 0.090 0.000 0.000 VMK-timer-ipi
245 1250405 0.163 0.000 0.000 VMK-monitor
246 1868139923 340.709 0.000 0.000 VMK-resched
248 414047027 189.255 0.000 0.000 VMK-tlb
4096 3193917027 1321.416 0.000 0.000 0_2nd-level-intr-handler
4097 304258696 193.711 0.000 0.000 1_smpcall
4099 246 0.003 0.000 0.000 3_VOB-Wakeup
4100 35706272 6.186 0.000 0.000 4_TimerBH
4101 399313616 10339.744 0.000 0.000 5_fastSlab
4104 859208 7.851 0.000 0.000 8_logEvent
4105 109560008 158.914 0.000 0.000 9_netTxComp
4106 26 0.197 0.196 0.196 10_keyboard
4107 56 0.001 0.000 0.000 11_SMIEnableCountPCPU-bh
4165 365305096 2433.530 0.001 0.001 TCPIPRX
4167 54024607 55.359 0.000 0.000 SCSI
4171 54520415 124.983 0.000 0.000 START-PATH-CMDS
4173 55109136 254.927 0.000 0.000 COMPL.-ADAPTER-CMD
4174 55102189 85.804 0.000 0.000 START-ADAPTER-CMDS
4180 5254928064 13877.461 0.001 0.001 Netpoll
BTW, some services maybe combined and reported under VMK-timer. For example, IOChain from vSphere Distributed Switch does not appear on its own.
Memory
The top part of the screen provides summary at ESXi level. They are handy in seeing overall picture, before diving into each VM or the kernel modules.
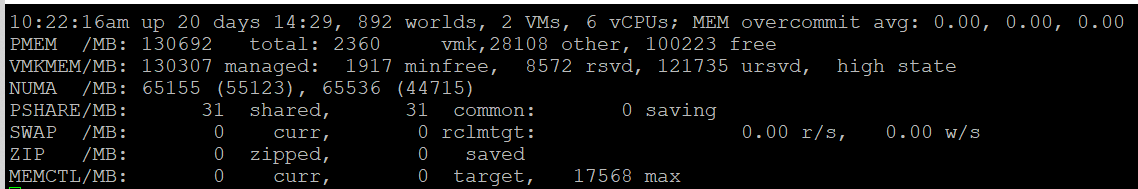
| MEM overcommit avg | Average memory overcommit level in the last 1-minute, 5-minute, and 15-minute, respectively. Calculation is done with Exponentially Weighted Moving Average. Memory overcommit is the ratio of total requested memory and the "managed memory" minus 1. According to this, the kernel computes the total requested memory as a sum of the following components:
If the ratio is > 1, it means that total requested VM memory is more than the physical memory available. This is fine, because ballooning and page sharing allows memory overcommit. I’m puzzled why we mix allocation and utilization. No 1 and no 3 make sense, but what exactly is no 2? My recommendation is you simply take the configured VM memory and ignore everything else. While it’s less accurate, since the purpose is capacity and not performance, it’s more than good enough and it’s easier to explain to management. There is no need to get other details. |
|---|---|
| PMEM | Physical Memory. Total = vmk + Other + Free Total is what is reported by BIOS. vmk is ESXi the kernel consumption. This includes kernel code section, kernel data and heap, and other the kernel management memory. Other is memory consumed by VM and non VM (user-level process that runs directly on the kernel) |
| VMKMEM | The kernel memory. The following metrics are shown:
I have not found a practical use case for the above 4 metrics. If you do, let me know! State is the memory state. You want this to be on high state. |
| NUMA | In the preceding screenshot, there are 2 NUMA nodes. For each node there are 2 metrics: the total amount and the free amount. Note that the sum of all NUMA nodes will again be slightly smaller than total, for the same reason why the kernel managed is less than total. If you enable Cluster-on-Die feature in Intel Xeon, you will see 2x the number of nodes. For details, see this by Frank Denneman. |
| PSHARE | shared: the amount of VM physical memory that is being shared. common: the amount of machine memory that is common across Worlds. saving: the amount of machine memory that is saved due to page-sharing. |
| SWAP | Swapped counter is covered under VM memory. What “cannot” be zipped is swapped. What you see on this line is sum of all the VMs. The metric rclmtgt shows the target size in MB that ESXi aims to swap. |
| ZIP | Zipped counter is covered under VM memory. What you see on this line is sum of all the VMs. |
| MEMCTL | Memory Control, also known as ballooning, is covered here under VM memory. What you see on this line is sum of all the VMs. |
There are a lot of metrics in many panels. It’s easier to understand if we group them functionally.
Contention
As usual, we start with the contention-type of metrics.
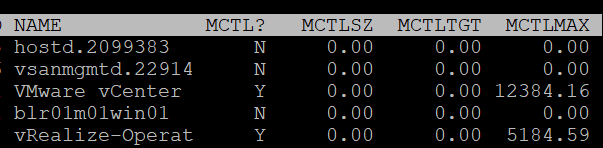
Balloon
I start with Balloon as this is the first level of warning. Technically, this is not a contention. Operationally, you want to start watching as Balloon only happens at 99% utilization. So it’s high considering you have HA enabled in the cluster.
| | |
|----|----|
| MCTL? | ‘Y’ means the line is a VM, as the kernel processes is not subjected to ballooning. |
| MCTLSZ (MB) | Memory Control Size is the present size of memory control (balloon driver). If larger than 0 hosts is forcing VMs to inflate balloon driver to reclaim memory as host is overcommitted |
| MCTLTGT (MB) | Amount of physical memory the ESXi system attempts to reclaim from the resource pool or VM by way of ballooning. If this is not 0 that means the VM can experience ballooning. |
| MCTLMAX (MB) | Maximum amount of physical memory the ESXi system can reclaim from the resource pool or VM by way of ballooning. This maximum depends on the type of Guest OS. |
Compressed & Swapped
I think that Swap and Compressed should be shown together as what can’t be compressed is swapped.
Why am I showing Compressed first?
Because it’s faster than swapped.
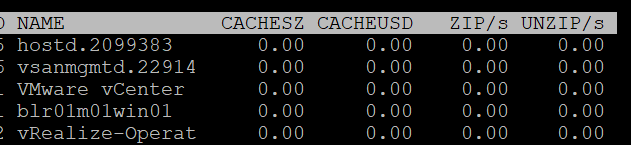
| CACHESZ (MB) | Compression memory cache size. |
| CACHEUSD (MB) | Used compression memory cache |
| ZIP/s (MB/s) | The rate at which memory pages are being zipped. Once zipped, it’s not immediately available for the VM. This is a capacity problem. Your ESXi needs more RAM. If the pages being zipped is unused, the VMs will not experience memory contention. Keep this number 0. See Capacity chapter for details. |
| UNZIP/s (MB/s) | The rate at which memory pages are being unzipped so it can be used by VM. This is a performance problem. The pages are being asked. The VM CPU is waiting for the data. If you check the VM memory contention counter, it will not be 0%. Make sure that number is within your SLA or KPI. |
Swapped
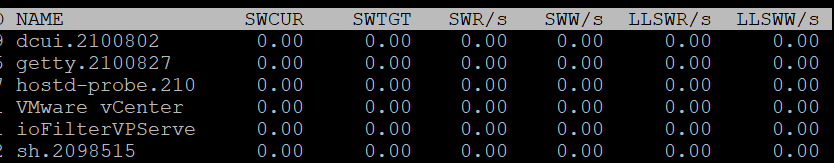
| SWCUR (MB) | Swapped Current is the present size of memory on swapped. It typically contains inactive pages. |
| SWTGT (MB) | The target size the ESXi host expects the swap usage by the resource pool or VM to be. This is an estimate. |
| SWR/s (MB) | Swapped Read per second and Swapped Write per second. The amount of memory in megabyte that is being brought back to memory or being moved to disk |
| SWW/s (MB) | |
| LLSWR/s (MB) | These are similar to SWR/s but is about host cache instead of disk. It is the rate at which memory is read from the host cache. The reads and writes are attributed to the VMM group only, so they are not displayed for VM. LL stands for Low Latency as host cache is meant to be faster (lower latency) than physical disk. Memory to host cache can be written from both the physical DIMM and disk. So the counter LLSWW/s covers all these sources, and not just from physical DIMM. |
| LLSWW/s (MB) |
NUMA
Logically, this statistic is applicable only on NUMA systems.
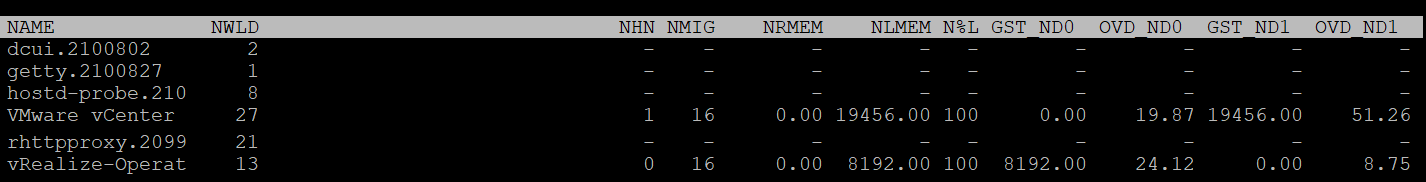
| NHN | The count of NUMA Home Node for the resource pool or VM. If the VM has no home node, a dash (-) appears. You want to see the number 1. If you see the number 2, that means the VM is split into multiple nodes, which could impact performance. When you enable CPU Hot Add, esxtop will report multiple home nodes as NUMA is disabled. It also does not distinguish remote and local memory as memory is interleaved. For more information, see this by Frank. |
| NMIG | Number of NUMA migrations. It gets reset upon VM power cycle, meaning this counter is accumulative. Be careful as you could be looking at past data. Use Log Insight to plot the event over time. Migration is costly as all pages need to be remapped. Local memory starts at 0% again and grow overtime. Copying memory pages across NUMA boundaries cost memory bandwidth. |
| NRMEM (MB) | Current amount of remote memory allocated to the VM or resource pool. Ideally this amount is 0 or a tiny percentage. You decrease the chance by decreasing the VM configured RAM. A VM whose configured memory is larger than the ESXi RAM attached to a single CPU socket have higher chance of having remote memory. |
| N%L | Current percentage of memory allocated to the VM or resource pool that is local. Anything less than 100% is not ideal. |
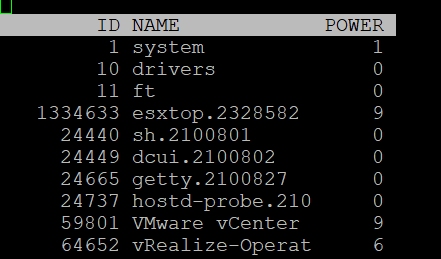
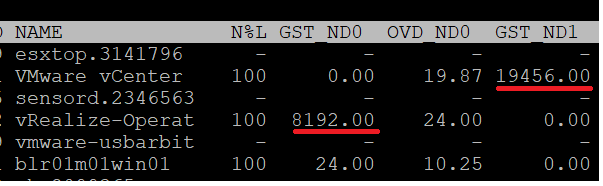
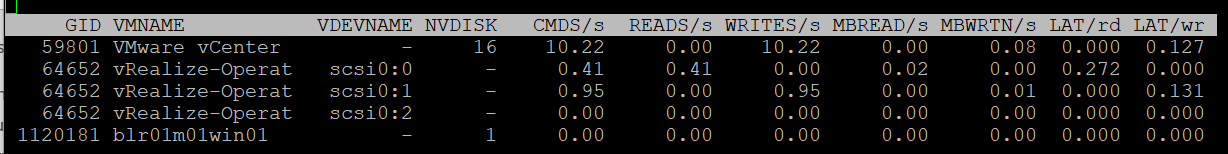
| GST_NDx (MB) | Guest memory allocated for a resource pool on NUMA node x, where GST_ND0 means the first node. The following screenshot shows the VMware vCenter VM runs on node 2 while the vRealize-Operat VM runs on node 1.
|
| OVD_NDx (MB) | VMM overhead memory allocated for a resource pool on NUMA node x, where x starts with 0 for the first node. |
Consumption
I group metrics such as consumed, granted, and overhead under consumption as they measure how much the VM or the kernel module consumes.
Consumed
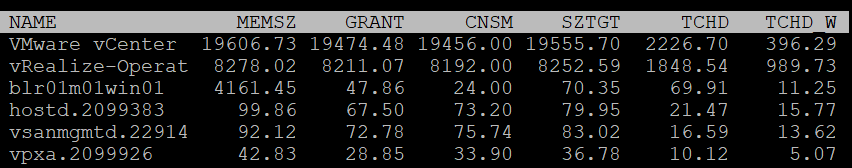
| MEMSZ (MB) | Amount of physical memory allocated to a resource pool or VM. The values are the same for the VMM and VMX groups. MEMSZ = GRANT + MCTLSZ + SWCUR + "never touched" I’m unsure where the compressed page goes. It’s still occupying space but 50% or 25%. |
| GRANT (MB) | Do not confuse it with Consumed 😊 |
| CNSM | Yup, this is that legendary Consumed metric. |
| SZTGT (MB) | Size Target in MB. Amount of machine memory the ESXi kernel wants to allocate to a resource pool or VM. The values are the same for the VMM and VMX groups. |
| TCHD (MB) | The size of touched pages in MB Working set estimate for the resource pool or VM. The values are the same for the VMM and VMX groups. |
| TCHD_W | As per above, but only for the write operations. A relatively much lower value compared to TCHD means the activities are mostly read. |
Overhead
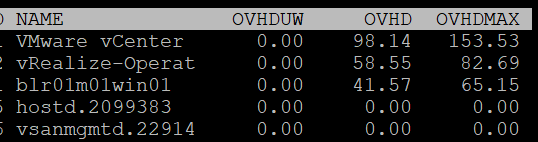
I find overhead is a small amount that is practically negligible, considering ESXi nowadays sports a large amount of RAM. Let me know the use case where you find otherwise.
| | |
|----|----|
| OVHD (MB) | Current space overhead for resource pool. |
| OVHDMAX (MB) | Maximum space overhead that might be incurred by resource pool or VM. |
| OVHDUW (MB) | Current space overhead for a user world. It is intended for VMware use only. |
Shared
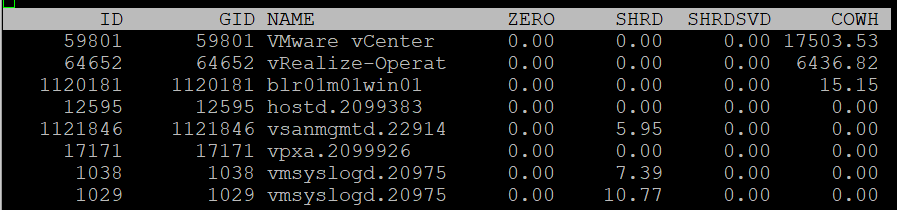
| ZERO (MB) | Resource pool or VM physical pages that are zeroed. |
| SHRD (MB) | Total amount that is shared. |
| SHRDSVD (MB) | Machine pages that are saved because of sharing. Notice this counter does not exist in vSphere Client UI. |
| COWH (MB) | Copy on Write Hint. An estimate of the amount of Guest OS pages for TPS purpose. |
Active
The manual uses the word Guest to refer to VM. I distinguish between VM and Guest. Guest is an OS, while a VM is just a collection of processes. Guest has its own memory management that is completely invisible to the hypervisor.
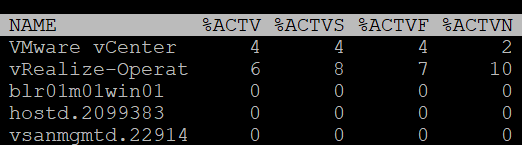
| %ACTV | Active is covered in-depth in Active metric |
| %ACTVS | Percentage Active Slow and Percentage Active Fast. Slow is the slow moving average, taking longer period. Longer is more accurate. I don’t have a use case for the fast moving average. |
| %ACTVF | |
| %ACTVN | Percentage Active Next. It predicts of what %ACTVF will be at next sample estimation. It is intended for VMware use only. |
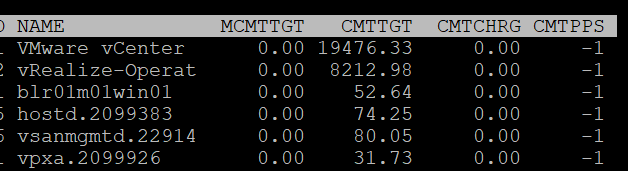
Committed
Committed page means the page has been reserved for that process. Commit is a counter for utilization but it’s not really used, especially for VM.
Note: none of these metrics exist in vSphere Client and VCF Operations, as they are meant for internal use.
| | |
|----|----|
| MCMTTGT | Minimum Commit Target in MB. I think this value is not 0 when there is reservation, but I’m not sure. |
| CMTTGT | Commit Target in MB. |
| CMTCHRG | Commit Charged in MB. I think this is the actual committed page. |
| CMTPPS | Commit Pages Per Share in MB |
Allocation & Reservation
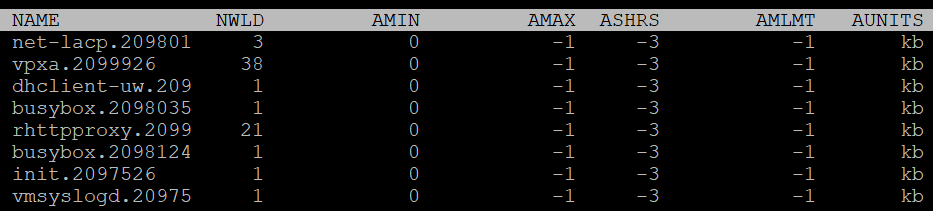
| AMIN | Allocation minimum. This is the term esxtop uses for memory reservation for this resource pool or VM. A value of 0 means no reservation, which is what you should set for most VM. Reservation for the kernel modules should be left as it is. |
| AMAX | Allocation maximum. This is the term esxtop uses for memory limit for this resource pool or VM. A value of -1 means Unlimited. Limit for the kernel modules should be left as it is. |
| AMLMT | Limit. You should expect the value -1, means no limit assigned. I’m not sure how this differs to AMAX. |
| ASHRS | Memory shares for this resource pool or VM. |
| AUNITS | This is just displaying the units of allocations counters |
Checkpoint
Checkpoint is required in snapshot or VM suspension. You can convert a VM checkpoint into a core dump file, to debug the Guest OS and applications.
| CPTRD (MB) | Checkpoint Read. Amount of data read from checkpoint file. A large amount can impact the VM performance. |
| CPTTGT (MB) | Checkpoint Target. The target size of checkpoint file that the kernel is aiming for. I’m unsure why it needs to have a target, unless this is just an estimate of the final size and not a limit. |
Storage
The Storage monitoring sports 3 panels:
-
VM
-
Adapter
-
Device
We covered in Part 2 that an ESXi host has adapter, path and devices. I’m unsure why esxtop does not have a panel for path. It would be convenient to check dead path or inactive path as the value will be all 0. If your design is active/active, it can be useful to compare if their throughput is not lopsided.
Datastore is also missing. While VMFS can be covered with Device (if you do 1:1 mapping and not using extent), NFS is not covered.
On the other hand, esxtop does provide metrics that vSphere Client does not. I will highlight those.
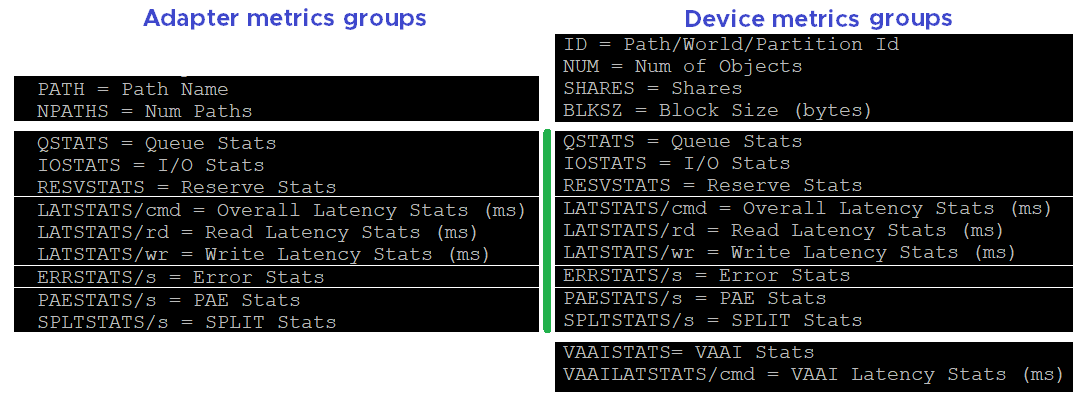
ESXi uses adapter to connect to device. As a result, their main contention and utilization metrics are largely similar. I’ve put them side by side here, and highlight the similar metric groups with vertical green bar. I highlighted the word group, as the group name may be identical, but the actual metrics within the group differ.
VM
We begin with VM as that’s the most important one. It complements vSphere Client by providing unmap and IO Filter metrics.
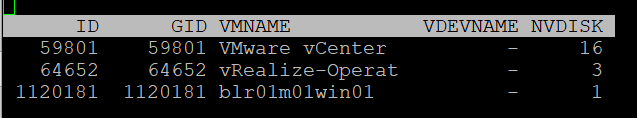
You can see at VM level, or virtual disk level. In the following screenshot, I’ve expanded one of the VM. The VM shown as vRealize-Operat has 3 virtual devices.
Contention
| | |
|--------|----------------------------------------------|
| LAT/rd | Average latency (in milliseconds) per read. |
| LAT/wr | Average latency (in milliseconds) per write. |
Consumption
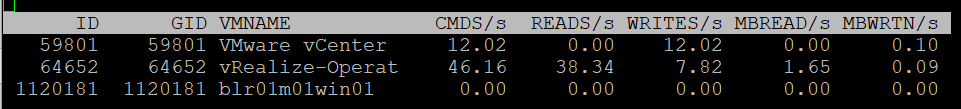
| CMDS/s | Count of disk IO commands issued per second. This is basically IOPS. Both the Read IOPS and Write IOPS are provided. |
| READS/s | |
| WRITES/s | |
| MBREAD/s | Total disk amount transferred per second in MB. This is basically throughput. Both the read throughput and write throughput are provided. |
| MBWRTN/s |
Unmap
It has unmap statistics. This can be useful that there is no such information at vSphere Client. In the UI, you can only see at ESXi level.

| SC_UMP/s | Successful, Failed and Total Unmaps per second. Unmap can fail for a variety of reason. One example that was addressed in vSphere 6.7 Patch ESXi670-202008001 and documented in in KB is Guest OS does not refresh unmap granularities and keep sending unmap based on older value. Eventually limit is reached and the operation fail. |
| FL_UMP/s | |
| UMP/s | |
| SC_UMP_MBS/s | As above, but in MB/second. |
| FL_UMP_MBS/s |
IO Filter
I/O Filter in ESXi enable the kernel to manipulate the IO sent by Guest OS before processing it. This obviously opens up many use cases, such as replication, caching, Quality of Service, encryption.
There is no such metric at vSphere Client. You will not find IO Filter metrics at both VM object and ESXi object.
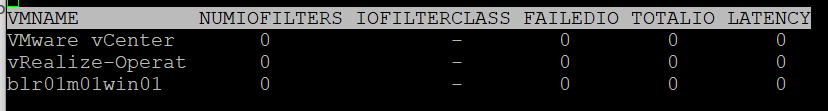
| NUMIOFILTERS | Number of IO Filters |
| IOFILTERCLASS | Type of IO Filter Class |
| FAILEDIO | I think Failed IO should be 0 at all times. |
| TOTALIO | |
| LATENCY | I’m unsure if this latency measures the additional overhead introduced by IO Filter, or the total latency as seen by the VM. |
Configuration
| | |
|-----------|-----------------------------------------------|
| ID | Resource pool ID or VSCSI ID of VSCSI device. |
| GID | Resource pool ID. |
| VMNAME | Name of the resource pool. |
| VSCSINAME | Name of the VSCSI device. |
| NDK | Number of VSCSI devices |
Disk Adapter
ESXi uses adapter to connect to device, so let’s begin with adapter, then device.
The panel has a lot of metrics and properties, so let’s group them for ease of understanding.
Errors
Since you check availability before performance, let’s check the errors first. This type of problem is best monitored as accumulation within the reporting period as any value other than 0 should be investigated.
BTW, none of these metrics are available at vSphere Client UI.
| FCMDS/s | Number of failed commands issued per second. How does this differ to Reset and Aborted? Number of failed read commands issued per second. Number of failed write commands issued per second. |
| FREAD/s | |
| FWRITE/s | |
| FMBRD/s | Megabytes of failed read operations per second. Megabytes of failed write operations per second. |
| FMBWR/s | |
| CONS/s | Number of SCSI reservation conflicts per second. This number should stay 0? Number of failed SCSI reservations per second, if the conflict can’t be solved timely. Number of SCSI reservations per second. This number should stay within the limit, but how to know what the limit is? |
| FRESV/s | |
| RESV/s | |
| ABRTS/s | Number of commands cancelled per second. |
| RESETS/s | Count of disk commands reset per second. |
Queue
For storage, the queue gives insight into performance problem. It’s an important counter so I was hoping there will be more, such as the actual queue.
| AQLEN | Current queue depth of the storage adapter. This is the maximum number of kernel active commands that the adapter driver is configured to support. This counter is not available in vSphere Client UI |
Contention
You expect to get 4 sets (Device, Kernel, Guest, Queue). For each set, you expect read, write, and total. 12 metrics, and that’s exactly what you got below.
| DAVG/cmd | Average latency per command in milliseconds. It’s an average number, not the last number in the reporting period. If you have 1000 IOPS, that means 5K IOPS over the 5 second reporting period. It’s a weighted average between read and write. If the IO commands are mostly read, then high latency from write could be masked out. |
| KAVG/cmd | |
| GAVG/cmd | |
| QAVG/cmd | |
| DAVG/rd | Average read latency per read operation in milliseconds. The same set of metrics as above, except it only counts the reads. It’s useful to see read and write separately as the numbers tend to be different. More importantly, the remediation action is different. |
| KAVG/rd | |
| GAVG/rd | |
| QAVG/rd | |
| DAVG/wr | The same set of metrics as above, except it only counts the writes. |
| KAVG/wr | |
| AVG/wr | |
| QAVG/wr |
Consumption
Now that we get the more important metrics (errors, queue, and contention) done, you then check utilization counter. In this way you have better context.
| ACTV | The definition is “Number of commands that are currently active”. I don’t know how it differs to IOPS as I’m unsure what the word “active” exactly mean here. |
| CMDS/s | I combine these 3 metrics as they are basically IOPS. Total IOPS, read IOPS and write IOPS. |
| READS/s | |
| WRITES/s | |
| MBREAD/s | I combine them as they measure throughput. Interestingly, there is no total throughput metric, but you can simply sum them up. Read the string MBWRTN as MB Written. |
| MBWRTN/s |
PAE and Split
| PAECMD/s | PAE Command per second and PAE Copy per second. PAE (Physical Address Extension) no longer applicable in 64-bit and modern drivers/firmware/OS, as the size is big enough. Copy operations here refer to the kernel copies the data from high region (beyond what the adapter can reach) to low region. This statistic applies to only paths. |
| PAECP/s | |
| SPLTCMD/s | Split Commands per second. Disk IO commands with large block size have to be split by the kernel. This can impact the performance as experiences by the Guest OS. |
| SPLTCP/s | Number of split copies per second. A higher number means lower performance |
Configuration
The panel provides basic configuration. I use vSphere Client as it provides a lot more information, and I can take action on them. The following is just some of the settings available.
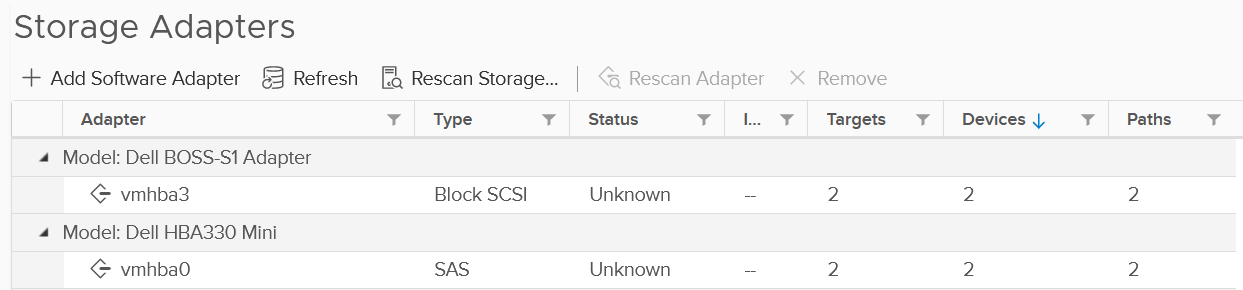
Compare the above with what esxtop provides, which is the following:
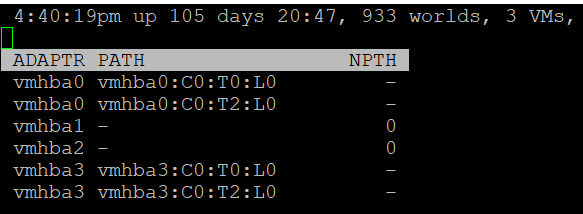
| | |
|----|----|
| NPTH | Number of path. This should match your design. An adapter typically has more than 1 path, which is why I said it would be awesome to have a panel for path |
Disk Device
The device panel has a lot of metrics and properties, so let’s group them for ease of understanding.
Errors
I’m always interested in errors first, before I check for contention and utilization.
| | |
|----|----|
| ABRTS/s | Number of commands cancelled per second. Expect this to be 0 at all times. |
| RESETS/s | Number of commands reset per second. Expect this to be 0 at all times. |
Queue
You’ve seen that there is only 1 counter for queue in Disk Adapter. How many do you expect for Disk Device?
Interestingly, there are 6 metrics for queue, as shown below.
| LOAD | The formula is (active commands + ESXi kernel queued commands) / queue depth. If LOAD > 1, check the value of the QUED counter. |
| QUED | Number of commands in the kernel that are currently queued. You want this to be as low as possible, well below the queue depth. |
| %USD | USD (%) = ACTV / QLEN For world stats, QLEN is WQLEN. For LUN (aka device) stats, QLEN is DQLEN. Percentage of the queue depth used by ESXi kernel active commands. So this does not include the queued command? Does it mean that if this number is not 100%, then there is nothing in the queue, as queue should only develop when it’s 100% used? Obviously when Used = 100% it means the queue is full. That will introduce outstanding IO, which in turn will increase latency |
| DQLEN | I combine this together as a device can have 1 or more world, and there is a per-device maximum. DQLEN is the device configured queue length. The corresponding counter for adapter is called AQLEN WQLEN is the world queue depth. The manual states “This is the maximum number of ESXi kernel active commands that the world is allowed to have”. So it does not look like the queue at present. So we show maximum value for each world, and the present value for each device. |
| WQLEN | |
| ACTV | The definition is “Number of commands that are currently active”. I think this means the IO in flight. This is worth profiling and I expect it to be small most of the time. |
Contention
See Disk Adapter as both sport the same 12 metrics.
Consumption
See Disk Adapter as both sport the same 5 metrics.
PAE and Split
See Disk Adapter as both sport the same 4 metrics.
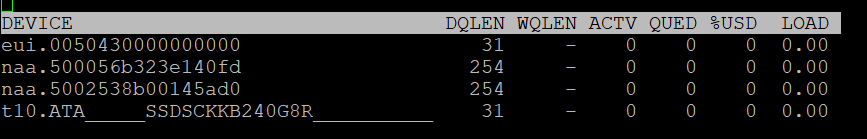
Configuration
As you can expect, esxtop provides minimal configuration information. They are shown below.
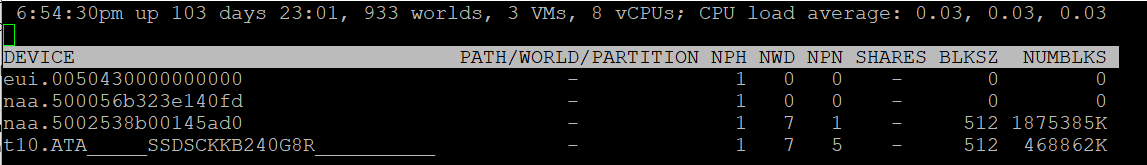
####### Path/World/Partition
They are grouped as 1 column, and you can only see one at a time.
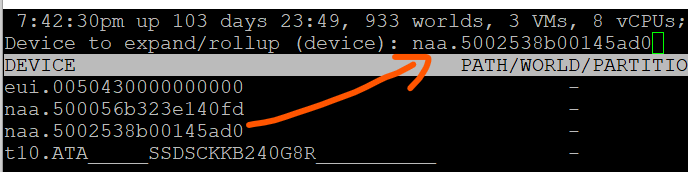
By default, none of them is shown. To bring up one of them, type the corresponding code. In the following screenshot, I’ve type the letter e, which them prompted me to enter one of the device.
Path is obviously the path name, such as vmhba0:C0:T0:L0.
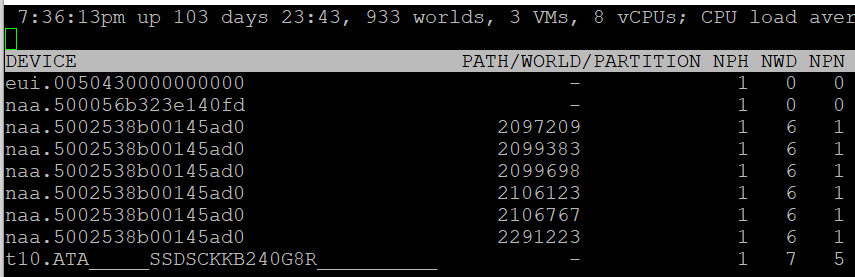
A disk device can have >1 world, which I’m unsure why. You can see each world ID, and you get the statistics per world.
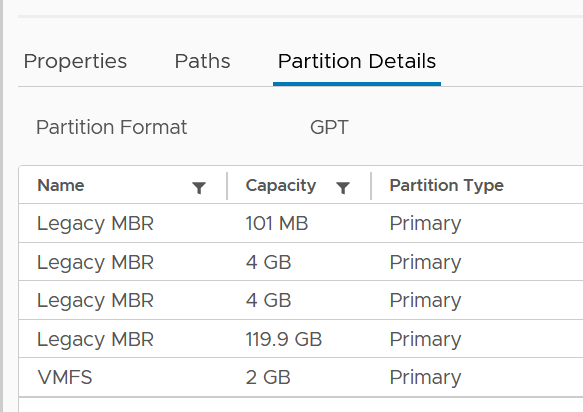
Partition shows the partition ID. Typically this is a simple number, such as 1 for the first partition. vSphere Client provides the following, which is more details yet easier.
####### Others
Let’s cover the rest of the metrics.
| NPH | Number of paths. This should not be 1 as that means a single point of failure. |
| NWD | Number of worlds. If you know the significance of this in troubleshooting, let me know. |
| NPN | Number of partitions. Expect this to be 1 for VMFS |
| SHARES | Number of shares. This statistic is applicable only to worlds. This is interesting, as that means each world can have their own share? Where do we set them then? |
| BLKSZ | Block size in bytes. I prefer to call this sector format. International Disk Drive Equipment and Materials Association (IDEMA) increased the sector size from 512 bytes to 4096 bytes (4 KB). This is important, and you want them to be in 4K (Advanced Format) or at least 512e (e stands for emulation). Microsoft provides additional information here. |
| NUMBLKS | Number of blocks of the device. Multiply this with the block size and you get the total capacity. In vSphere UI, you get the capacity, which I think it’s more relevant. |
For configuration, I use vSphere Client as it provides a lot more information, and I can take action on them. The following is just some of the settings available.
VAAI
VMware vSphere Storage APIs - Array Integration (VAAI) offloads storage processing to the array, hence improving performance or reducing overhead. This is obviously vendor-dependant. There is no VAAI counter at adapter level or path level, as the implementation is at back-end array.
The VAAI has a lot of metrics. There are essentially 2 types of metrics: non latency and latency metrics.
As with metrics, check for contention type of metrics first. There are metrics that track failed operations, such as CLONE_F, ATSF and ZERO_F.
In this book, I’m grouping them by function as it’s easier to understand.
I saw this note from VMware vSphere Storage APIs – Array Integration (VAAI) document by Cormac Hogan, which I think it’s worth mentioning. Because the nature of VAAI as an offloads, you will see higher latency value of KAVG metric. Other latency metrics are not affected, so there is no issue unless there are other symptoms present.
At this moment, I have not found the need to document them further. So what you get here is mostly from the KB article above. Andreas Lesslhumer also has useful information in this blog article. Other references are this blog by Cormac and this this KB article.
####### Extended Copy
Hardware Accelerated Move (the SCSI opcode for XCOPY is 0x83)
| Clone_RD | RD stands for reader. The number of CLONE commands successfully completed where this device was a source. WR stands for writer. The number of CLONE commands successfully completed where this device was a destination The number of failed CLONE commands |
| Clone_WR | |
| Clone_F | |
| LCLONE_RD | The same set of 3 metrics, except for Linked Clone. |
| LCLONE_WR | |
| LCLONE_F | |
| MBC_RD/s | MBC = megabytes of clone data. RD/s is read per second, and WR/s is written per second |
| MBC_WR/s | |
| AVAG/suc | The average clone latency per successful command The average clone latency per failed command |
| AVAG/f |
####### Atomic Test & Set
Hardware Accelerated Locking on Single Extent Datastore or on Multi Extent Datastore (SCSI code 0x89).
| | |
|----|----|
| ATS | The number of Atomic Test & Set (ATS) commands successfully completed |
| ATSF | The number of ATS commands failed. Expect this to be 0? |
| AAVG/suc | The Average ATS latency per successful command |
| AAVG/f | The Average ATS latency per failed command |
####### Write Same
Hardware Accelerated disk space initialization by writing 0s on all the blocks for faster future operations. The SCSI code for WRITE SAME operations is 0x93 or 0x41.
| | |
|----------|----------------------------------------------------|
| ZERO | The number of ZERO commands successfully completed |
| ZERO_F | The number of ZERO commands failed |
| MBZERO/s | The megabytes zeroed per second |
| ZAVG/suc | The average zero latency per successful command |
| ZAVG/f | The average zero latency per failed command |
####### Unmapped
Unmapped block deletion (SCSI code 0x42). We discussed unmapped block (TRIM) in earlier chapter.
| | |
|----|----|
| DELETE | The number of successful DELETE commands |
| DELETE_F | The number of failed UNMAP commands, this value should be 0 |
| MBDEL/s (MB/s) | The rate at which the DELETE command getting processed. Measured in Megabytes per second |
####### Others
| RESSPACE | Reservation Space. The number of commands which were successful while doing space reservation for a VMDK file in thick Provisioning format. RESSPACE_F captures the failure. |
| RESSPACE_F | |
| EXTSTATS | Extended Statistics The number of commands which were successful in reporting extended statistics of a clone after the cloning process had been completed. EXTSTATS_F captures the failure |
| EXTSTATS_F | |
| CAVG/suc | The average clone latency per successful command. Unit is millisecond per clone. CAVG/f captures the failures. |
| CAVG/f | |
| LCAVG/suc | As per above, but for Linked Clone. |
| LCAVG/f | |
| RAVG/suc | The average latency (in ms) per successful VAAI Space Reservation command. RAVG/f captures the failures |
| RAVG/f | |
| ESAVG/suc | As per above, but for Extended Statistics |
| ESAVG/f |
vSAN
I group the vSAN panel under Disk as esxtop only covers storage related information. There is no network or compute (vSAN kernel modules).
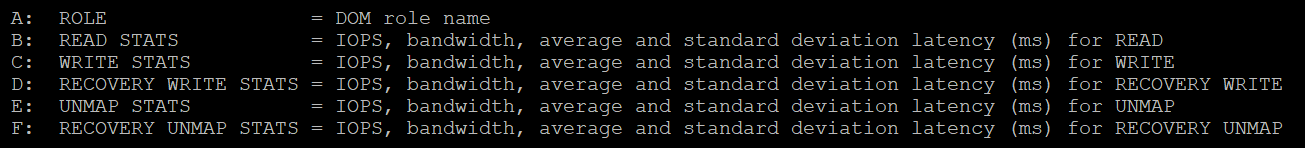
The panel provides visibility into 5 types of IO operations:
-
Read
-
Write
-
Recovery Write
-
Unmap
-
Recovery Unmap
For each, it provides the IOPS, bandwidth, average latency (ms) and standard deviation latency (ms). Take note that some use MB, while others use GB.
| ROLE | The Distributed Object Manager (DOM) role of that component, such as client, owner, and component manager. |
READS/s MBREAD/s AVGLAT SDLAT | Reads/second is the number of reads operations. This is IOPS. MBReads/s is read throughput in Megabytes/second. AvgLat is the average latency. Standard deviation of latency, when above 10ms latency. |
WRITES/s MBWRITE/s AVGLAT SDLAT | Same set of metrics, like above, but for write |
RECOWR/s MBRECOWR/s AVGLAT SDLAT | Same set of metrics, like above, but for Recovery Write. Recovery covers component rebuild task (e.g. from disk failure). Read the string MBRECOWR as MB Reco Wr. |
UNMAPS/s GBUNMAP/s AVGLAT SDLAT | Same set of metrics, like above, but for unmap operations. I think this number should be within your expectation, as excessive unmap can impact performance. GBUNMAP/s = Unmapped rates in Gigabytes/second Read the string GBUNMAP as GB Unmap |
RECOUN/s GBRECOUN/s AVGLAT SDLAT | Same set of metrics, but for Recovery Unmap operations. Read the string GBRECOUN as GB Reco Un. RecoUn/s is the number of recovery unmapped operations per second. GBRecoUn/s is the amount of disk space in GB/second by Recovery Unmapped. |
Network
Take note that the network panels mix the virtual and physical networks.
Focus on the virtual network first as that’s closer to the VM and kernel.
Contention
As usual, we check contention first. There are no network latency and packet retransmit metrics.
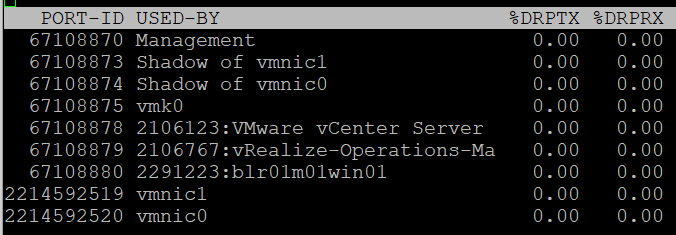
| %DRPTX | Percentage of Dropped Packet. Expressed in percentage, which makes it easier as you expect this not to exceed 0.x%. In dedicated network such as vSAN and vMotion, this should be flat 0% non-stop for every single ESXi. Transmit and Receive have different nature. A high drop in transmit means your physical NIC card or uplink switch is unable to cope. A high drop in receive means your ESXi or VM may not have enough CPU to process the packet, or the ring buffer size is too small. esxtop show dropped packets: The screen output show dropped receive packets at the virtual switch port. They are actually dropped between the virtual switch and the guest OS driver. The dropped packets can be reduced by increasing the Rx buffers for the virtual network driver. |
| %DRPRX |
Consumption
As usual, check the non-unicast packets first and make sure they match the expectation at that time.
Non-Unicast Packets
| PKTTXMUL/s | Number of multicast packets transmitted or received per second. Read the string PKTTXMUL as Pkt Tx Mul, which is Packet TX Multicast. Same with PKTRXMUL. |
| PKTRXMUL/s | |
| PKTTXBRD/s | Number of broadcast packets transmitted or received per second. Read the string PKTTXBRD as Pkt Tx Brd, which is Packet TX Broadcast. Same with PKTRXBRD |
| PKTRXBRD/s |
All Packets
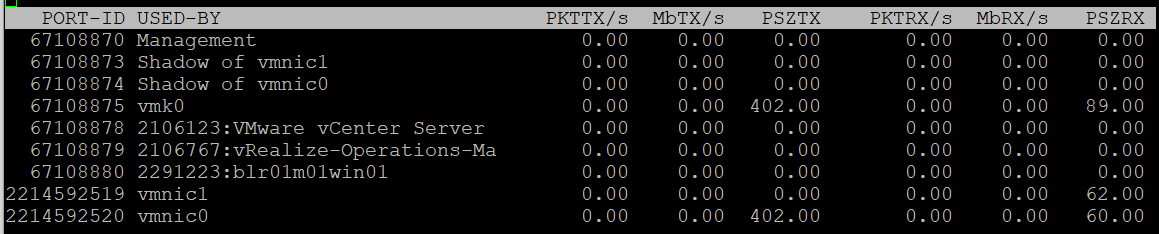
| PKTTX/s | This is the total packets, so it includes multicast packet and broadcast packet. Multicast packet and broadcast packet are listed separately. This is handy as they are supposed to low most of the time. |
| PKTRX/s | |
| MbTX/s | This is measured in bit, unlike vCenter Client UI which shows in byte. Packet length is typically measured in bytes. A standard packet is 1500 bytes, so a 10 Gb NIC would theoretically max out at 833,333 packets on each direction. Compare this with your ESXi physical network card. |
| MbRX/s | |
| PSZTX | This is convenient. If you see a number far lower than 1500, it’s worth discussing with network team. |
| PSZRX |
There is another metric ACTN/s, which is the number of actions per second. The actions here are the kernel actions. It is an internal counter, not relevant to day to day operations.
Configuration
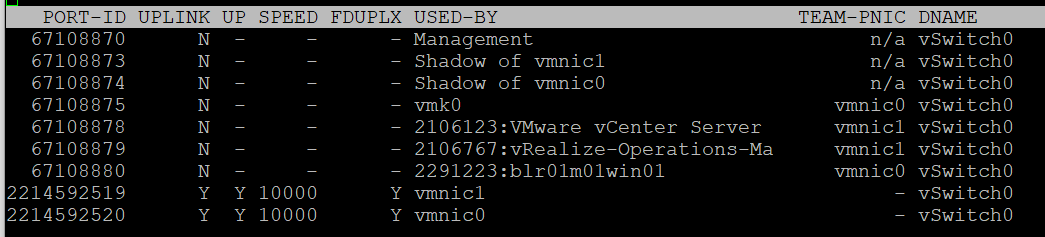
This panel mixes physical and virtual. For virtual, it shows both the kernel network and VM network. I find it easier to use the information in vSphere Client.
| | |
|----|----|
| PORT-ID | Virtual network device port ID. |
| UPLINK | ‘Y’ means that the corresponding port is an uplink. ‘N’ means it is not. The physical NIC cards (vmnic0, vmnic1, etc.) serve as the uplink |
| UP | ‘Y’ means that the corresponding link is up. ‘N’ means it is not. |
| SPEED | Link speed in Megabits per second. |
| FDUPLX | ‘Y’ means the corresponding link is operating at full duplex. ‘N’ means it is not, which is a problem. |
| USED-BY | Virtual network device port user. |
| DNAME | Virtual network device name. |
The metric DTYP (Virtual network device type, where H means Hub and S means switch) does not seem to be available anymore.
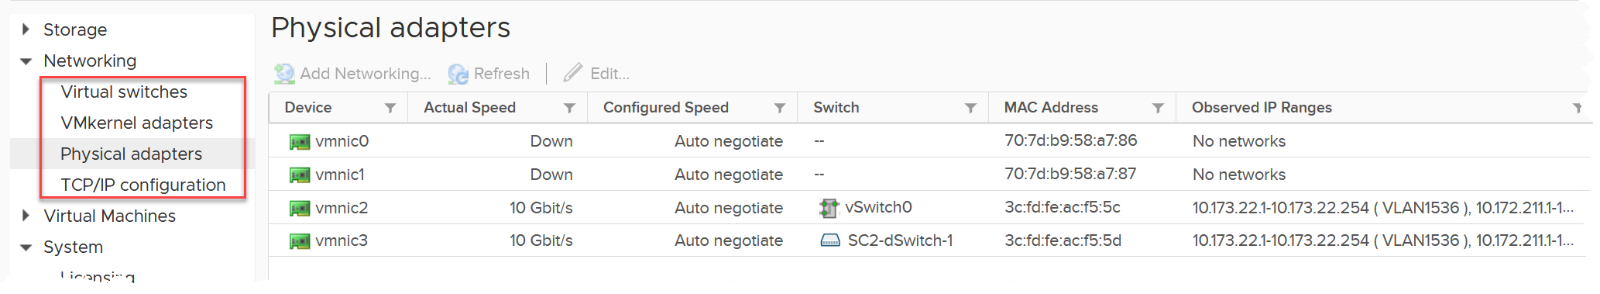
vSphere Client separates the components. You can see the virtual switches, the kernel network and physical cards. The level of details is more comprehensive.
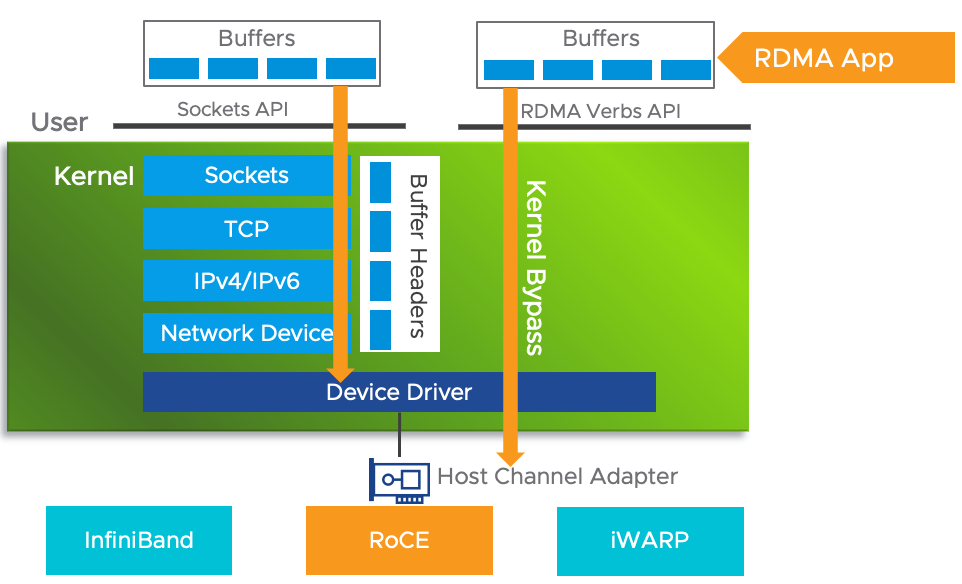
RDMA Device
Remote Direct Memory Access (RDMA) enable direct access to the physical network card, bypassing the OS overhead. The following screenshot, taken from here, shows 2 types of access from application (that lives inside a VM. The VMs are not shown).
Usage
Since it’s about network, you get both the TX (transmit or sent) and RX (received or incoming).
For contention, there is only packet dropped. There is no packet retransmit or latency. The metrics are:
| %PKTDTX | Percentage of packet dropped relative to number of packets sent. |
| %PKTDRX |
For utilization, you get them in both amount of data, and number of packets. Both are important metrics. There is no breakdown on the type of packets (broadcast, multicast, unicast).
| PKTTX/s | Packets per second. Check the limit for packet per second in your specific card. |
| PKTRX/s | |
| MbTX/s | Network throughput in Megabit/second. |
| MbRX/s |
There is no packet size. This can be handy to determine if they are much smaller or larger than you expect. For example, if you expect jumbo frame but the reality is much smaller.
These metrics are not available in vSphere Client UI, so you need to use esxtop to get the visibility. Just in case you’re wondering where I got the following screenshot from, they are courtesy of Shoby Cherian and Aditya Kiran Pentyala.
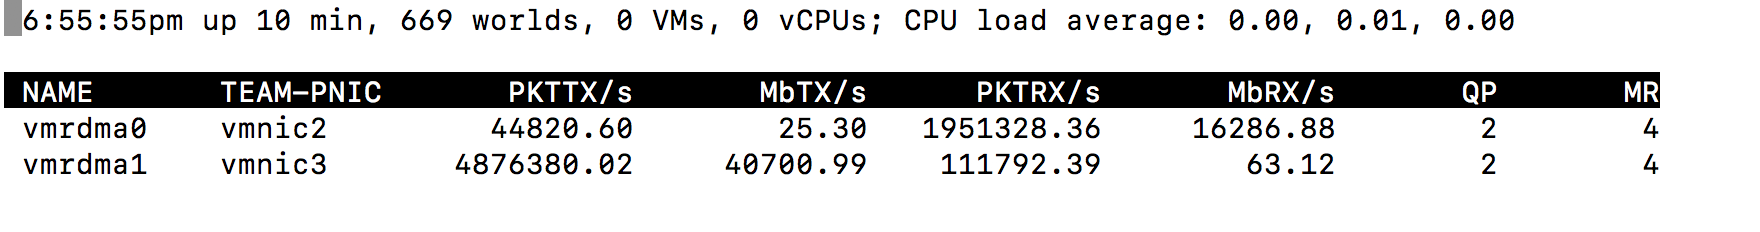
You also get the queue usage information.
| QP | Number of Queue Pairs Allocated and Completion Queue Pairs Allocated. RDMA uses these queues for communication. |
| CQ | |
| SRQ | Number of Shared Receive Queues Allocated I think this is required in virtualization as the physical NIC card can be shared. |
| MR | Memory Regions Allocated. Check that this is inline with your expectation. |
For more reading on RDMA, I found this academic paper, title “Understanding the concepts and mechanisms of RDMA” useful.
Configuration
vSphere Client provides the following information. You get the first 4 columns in esxtop.
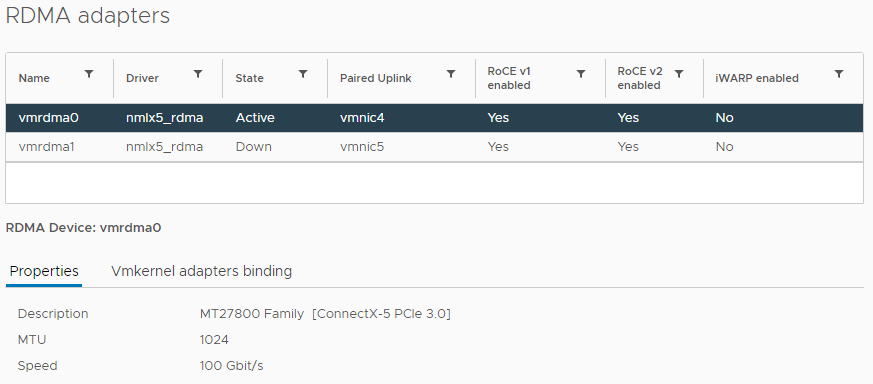
The information you get in esxtop covers the first 4 columns in the preceding screenshot. They are:
| | |
|----|----|
| NAME | Name of the device |
| DRIVER | Name of the driver |
| STATE | Active or down |
| TEAM-PNIC | The physical Network Interface Card that the RDMA adapter is paired with. |
Part 3 Chapter 8
Microsoft Windows and Linux have different techniques for resource management. They also have different metrics names and accounting strategy.
Footnotes
-
16 Source: VMworld presentation HCP2583 by Richard Lu and Qasim Ali ↩