Memory
Windows memory management is not something that is well documented. Ed Bott sums it this article by saying “Windows memory management is rocket science”. Like what Ed has experienced, there is conflicting information, including the ones from Microsoft. Mark Russinovich, cofounder of Winternals software, explains the situation in this TechNet post.
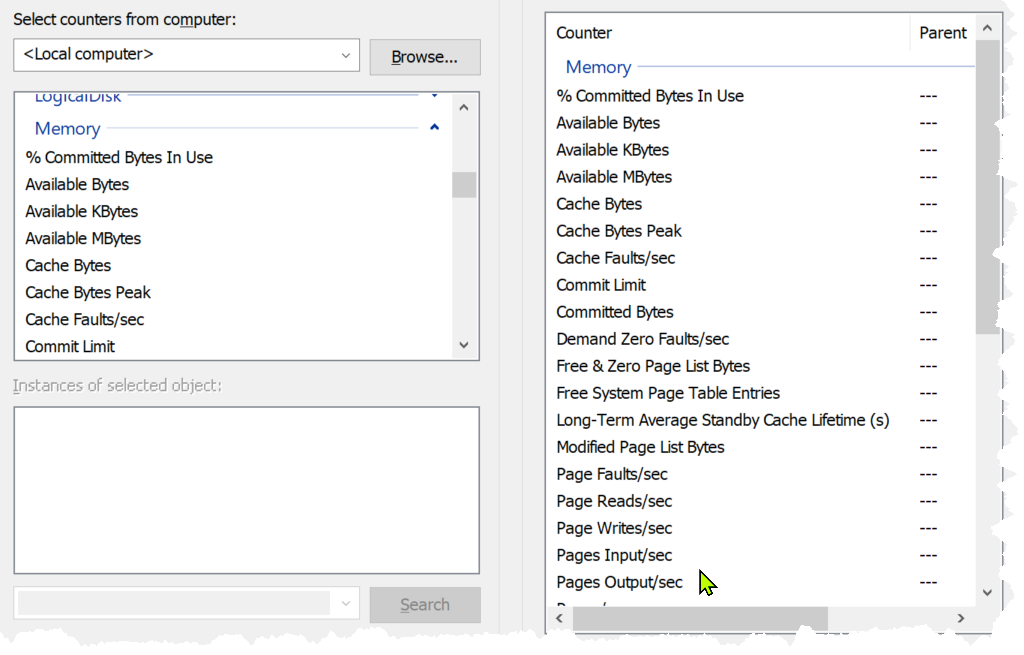
Windows Performance Monitor provides many metrics, some are shown below.
In formula, here is their definition:
-
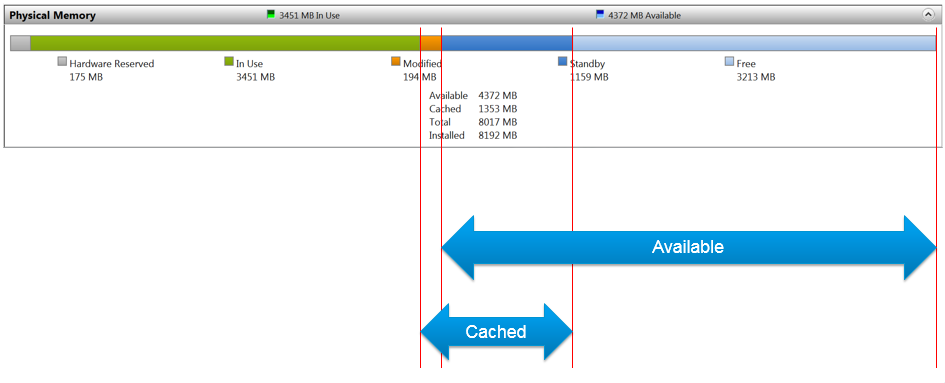
Cached = Standby + Modified
-
Available = Standby + Free
Available means exactly what the word means. It is the amount of physical memory immediately available for use. Immediately means Windows does not need to copy the existing page before it can be reused.
It is easier to visualize it, so here it is:
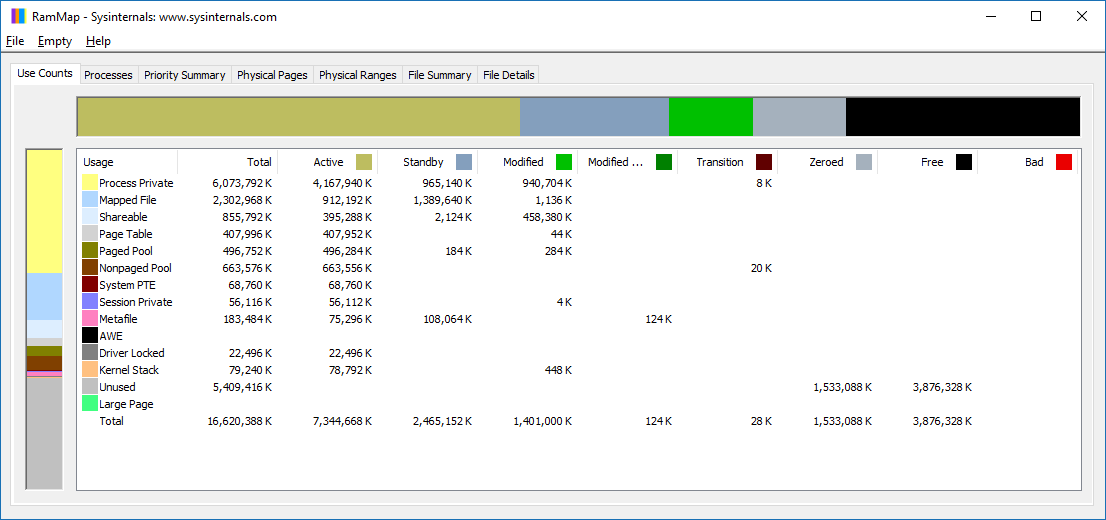
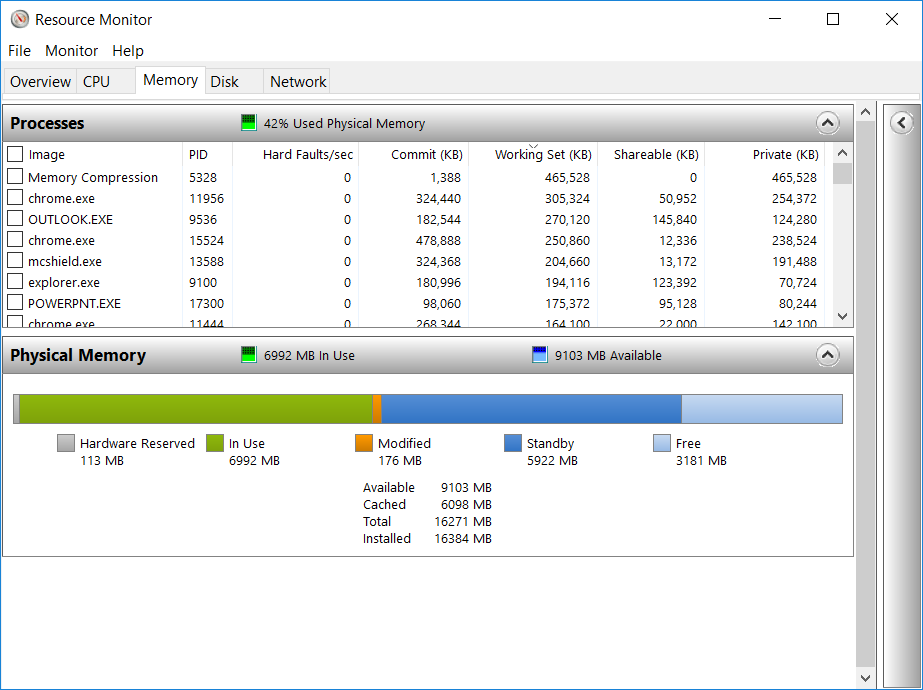
Microsoft SysInternal provides more detail breakdown. In addition to the above, it shows Transition and Zeroed.
In Use
This is the main counter used by Windows, as it’s featured prominently in Task Manager.
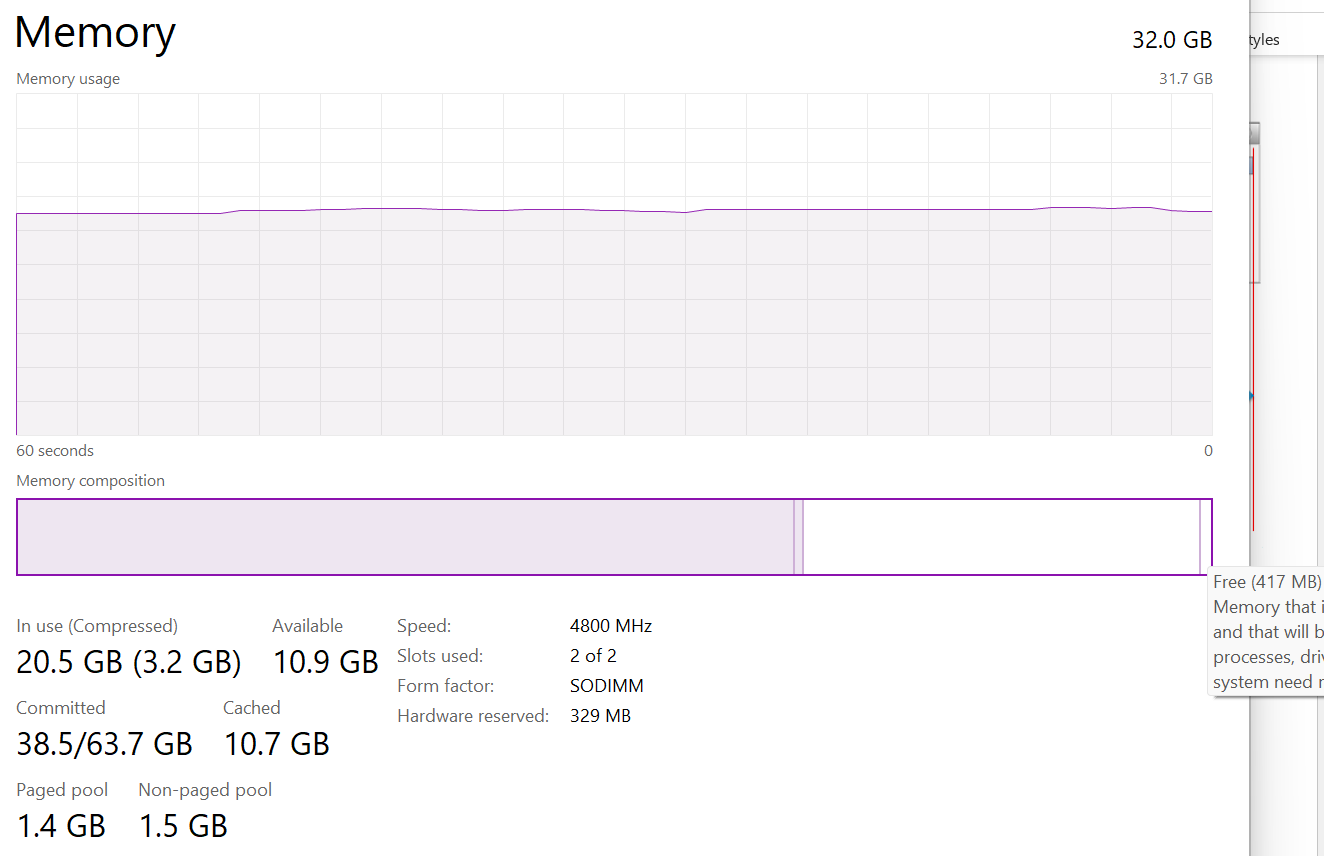
This is often thought as the minimum that Windows needs to operate. This is not true. If you notice on the preceding screenshot, it has compressed 457 MB of the 6.8 GB In Use pages, indicating they are not actively used. Windows compresses its in-use RAM, even though it has plenty of Free RAM available (8.9 GB available). This is a different behaviour to ESXi, which do not compress unless it’s running low on Free.
Look at the chart of Memory Usage above. It’s sustaining for the entire 60 seconds. We know this as the amount is too high to sustain for 60 seconds if they are truly active, let alone for hours.
Formula:
In use = Total – (Modified + Standby + Free)
A problem related to the In Use counter is memory leak. Essentially, the application or process does not release pages that it no longer needs, so over time it accumulates. This is hard to detect as the amount varies by application. The process will continue growing until the OS runs out of memory.
Take note this is a new metric in VCF Operations 8.6. We call it Used Memory. You’re welcome.
Modified
Page that was modified but no longer used, hence it’s available for other usage but requires to be saved to disk first. It’s not counted as part of Available, but counted as part of Cache.
OS does not immediately write all inactive pages to disk, especially if the disk is on power saving mode. It will consolidate these pages and write them in one shot, minimizing IO to the disk. In the case, of SSD disk, it can shorten the life span as SSD has physical limits on the number of writes.
Standby
Windows has 3 levels of standby. As reported by VMware Tools, their names are:
-
Standby Core
-
Standby Normal
-
Standby Reserve
Different applications use the memory differently, resulting in different behaviour of the metrics. As a result, determining what Windows actually uses is difficult.
The Standby Normal counter can be fluctuating wildly, resulting in a wide difference if it’s included in rightsizing. The following VM is a Microsoft Exchange 2013 server mailbox utility.
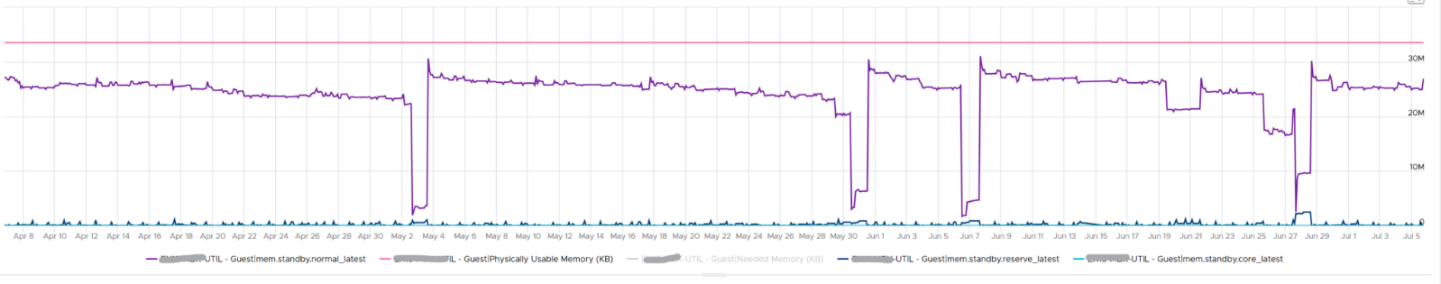
Notice the Standby Normal fluctuates wildly, reaching as high at 90%. The other 2 cache remains constantly negligible. The chart above is based on >26000 samples, so there is plenty of chance for each 3 metrics to fluctuate.
Now let’s look at another example. This is a Windows Server 2016. I think it was running Business Intelligence software Tableau.
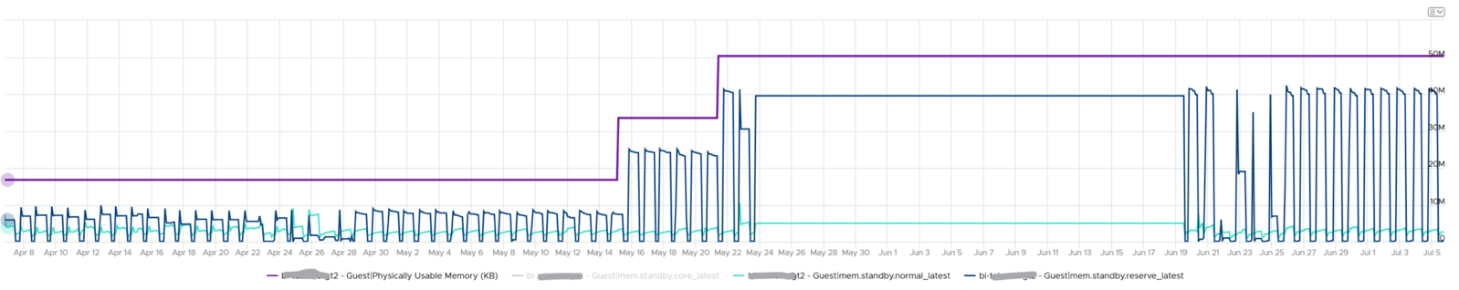
Notice the VM usable memory was increased 2x in the last 3 months. Standby Normal hardly move, but Standby Reserve took advantage of the increments. It simply went up accordingly, although again it’s fluctuating wildly.
Cache
Cache is an integral part of memory management, as the more you cache, the lower your chance of hitting a cache miss. This makes sense. RAM is much faster than Disk, so if you have it, why not use it? Remember when Windows XP introduced pre-fetch, and subsequently Windows SuperFetch? It’s a clue that memory management is a complex topic. There are many techniques involved. Unfortunately, this is simplified in the UI. All you see is something like this:
Free
As the name implies, this is a block of pages that is immediately available for usage. This excludes the cached memory. A low free memory does not mean a problem if the Standby value is high. This number can reach below 100 MB, and even touch 0 MB momentarily. It’s fine so long there is plenty of cache. I’d generally keep this number > 500 MB for server VM and >100 MB for VDI VM. I set a lower number for VDI because they add up. If you have 10K users, that’s 1 TB of RAM.
When Windows or Linux frees up a memory page, it normally just updates its list of free memory; it does not release it. This list is not exposed to the hypervisor, and so the physical page remains claimed by the VM. This is why the Consumed counter in vCenter remains high when the Active counter has long dropped. Because the hypervisor has no visibility into the Guest OS, you may need to deploy an agent to get visibility into your application. You should monitor both at the Guest OS level (for example, Windows and Red Hat) and at the application level (for example, MS SQL Server and Oracle). Check whether there is excessive paging or the Guest OS experiences a hard page fault. For Windows, you can use tools such as pfmon, a page fault monitor.
This is one the 3 major metrics for capacity monitoring. The other 2 metrics are Page-in Rate and Commit Ratio. These 3 are not contention metrics, they are utilization metrics. Bad values can contribute to bad performance, but they can’t measure the severity of the performance. Windows and Linux do not have a counter that measures how long or how often a CPU waits for memory.
In Windows, this is the Free Memory counter. This excludes the cached memory. If this number drops to a low number, Windows is running out of Free RAM. While that number varies per application and use case, generally keep this number > 500 MB for server VM and >100 MB for VDI VM. The reason you should set a lower number for VDI because they add up quickly. If you have 10K users, that’s 1 TB of RAM.
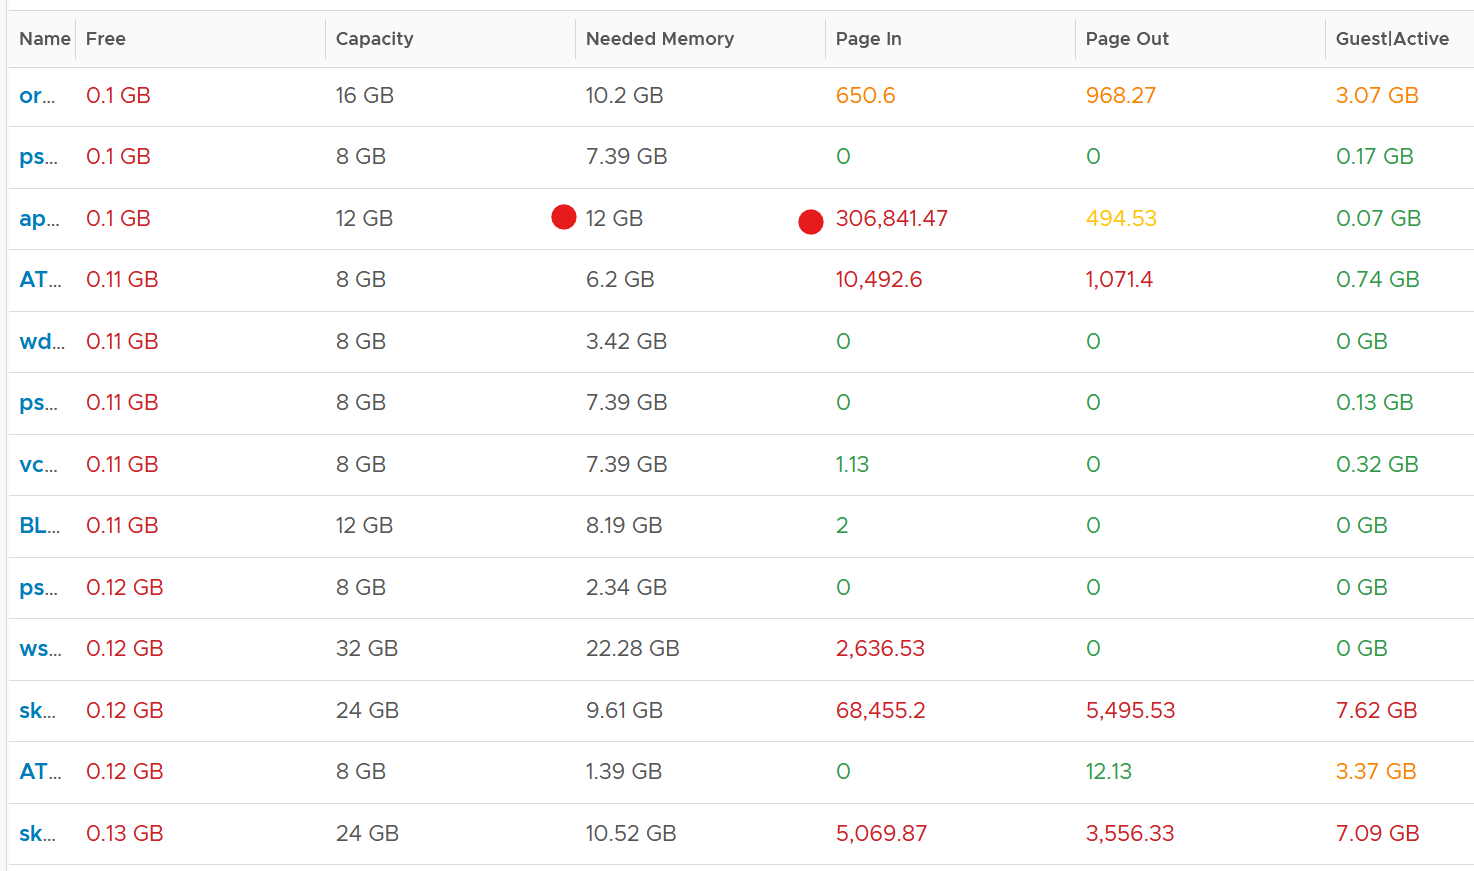
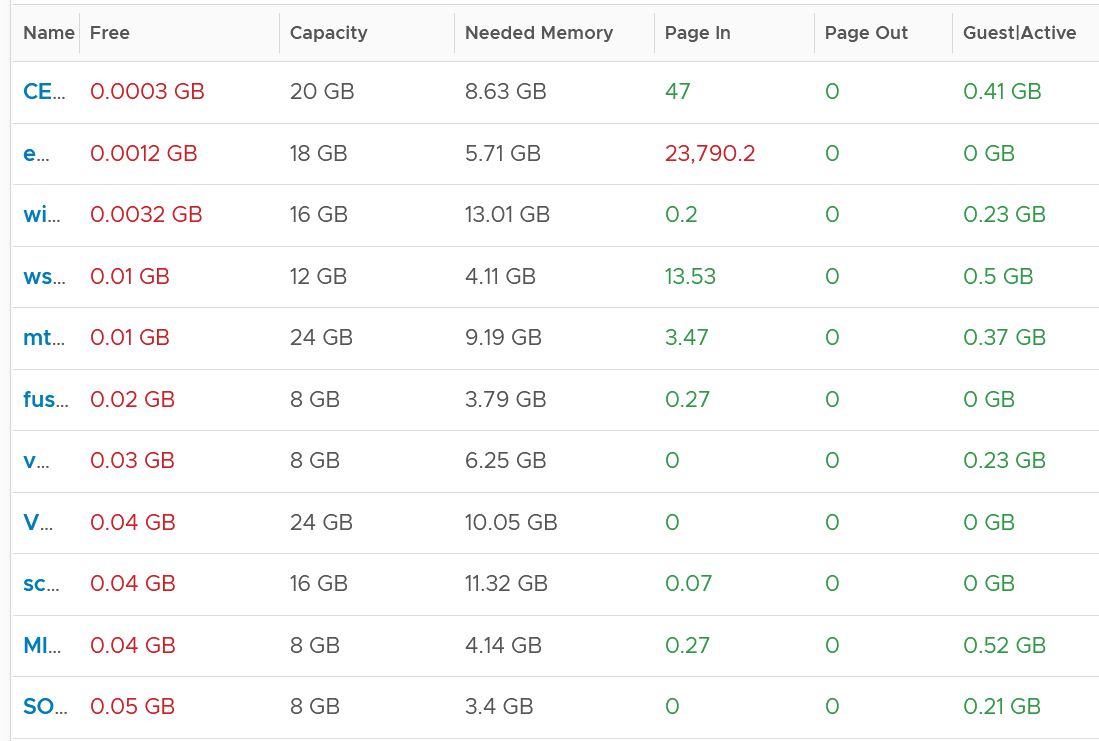
It’s okay for this counter to be low, so long other memory metrics are fine. The following table shows VMs with near 0 free memory. Notice none of them are needing more memory. This is the perfect situation as there is no wastage.
Page File
Memory paging is an integral part of Guest OS Memory Management. OS begins using it even though it still has plenty of physical memory. It uses both physical memory and virtual memory at the same time. Microsoft recommends that you do not delete or disable the page file. See this for reference.
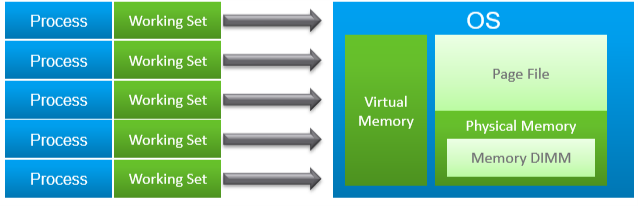
As shown on the diagram, processes see virtual memory, not physical memory. Guest OS presents this as system API to processes. The virtual memory is backed by the page file and physical memory. Guest OS shields the physical memory and hardware. Paging is an operation of reading/writing from the page file into the physical memory, not from physical disk into the page file.
Let Windows manages the pagefile size. This is the default setting, so you likely have it already. By default, windows sets the pagefile size to the same size with the physical memory. So if the VM has 8 GB of RAM, the pagefile is an 8 GB file. Anything above 8 GB indicates that Windows is under memory pressure.
The VM metric Guest \ Swap Space Remaining tracks the amount of swap space that's free.
The size of Page File is not a perfect indicator of the RAM usage, because they contain pages that are never demanded by the application. Windows does SuperFetch, where it predicts what pages will be used and prefetch them in advance. Some of these pages are never demanded by the application. Couple with the nature that Guest OS treats RAM as cache, including the page file will result in oversized recommendation. Paging rate is more realistic as it only considers the recent time period (300 seconds in VCF Operations case)
A page would be used as cache if it was paged out at some point due to memory pressure and it hasn’t been needed since. The OS will reuse that page as cache. That means that at some point the OS was constrained on memory enough to force the page out to happen.
A page that was paged out earlier, has to be brought back first before it can be used. This creates performance issue as the application is waiting longer, as disk is much slower than RAM.
There are 2 types of page operations:
-
Page In. This is a potential indicator for performance.
-
Page-out. This is a potential indicator for capacity.
While Paging impacts performance, the correlation between the paging metrics and performance varies per application. You can’t set a threshold and use it to monitor different applications or VM. The reason is paging is not always used when Guest OS runs out of memory. There are a few reasons why paging may not correlate to memory performance:
-
Application binary. The initial loading causes a page-in. Nobody will feel the performance impact as it’s not even serving anyone.
-
Memory mapped files. This is essentially a file that has a mapping to memory. Processes use this to exchange data. It also allows the process to access a very large file (think of database) without having to load the entire database into memory.
-
Proactive pre-fetch. It predicts the usage of memory and pre-emptively reads the page and bring it in. This is no different to disk where the storage array will read subsequent blocks even though it’s not being asked. This especially happens when a large application starts. Page-in will go up even though there is no memory pressure (page out is low or 0).
-
Windows performs memory capacity optimization in the background. It will move idle processes out into the page file.
If you see both Page-in and Page-out having high value, and the disk queue is also high, there is a good chance it’s memory performance issue.
The rate pages that are being brought in and out can reveal memory performance abnormalities. A sudden change, or one that has sustained over time, can indicate page faults. Page faults indicate pages aren’t readily available and must be brought in. If a page fault occurs too frequently it can impact application performance. While there is no concrete guidance, as it varies by application, you can judge by comparing to its past behaviour and its absolute amount.
Operating Systems typically use 4KB or 2MB page sizes. Larger page size will result in more cache, which translates into more memory required.
The counter %pagefile tracks how much of the pagefile is used, meaning the value 100% indicate the pagefile is fully utilized. While the lower the number the better, there is no universal guidance. If you know, let me know!
Reference: this is an old article as it covers 32 bit Windows. If you find a newer one, kindly let me know.
Guest OS Paging metrics
There are 2 metrics. Page-in and Page-out.
The unit is in number of pages, not MB. It's not possible to convert due to mix use of Large Page (2 MB) and Page (4 KB). A process can have concurrent mixed usage of large and non-large page in Windows. The page size isn’t a system-wide setting that all processes use. The same is likely true for Linux Huge Pages.
The page-in rate metric tracks the rate OS brings memory back from disk to DIMM per second. Another word, the rate of reads going through paging/cache system. It includes not just swap file I/O, but cacheable reads as well (so it’s double pages/s).
Page Out is the opposite of the above process. It is not as important as Page In. Just because a block of memory is moved to disk that does not mean the application experiences memory problem. In many cases, the page that was moved out is the idle page. Windows does not page out any Large Pages.
The following shows the page out value at 99th percentile in the last 4 months. What do you observe?
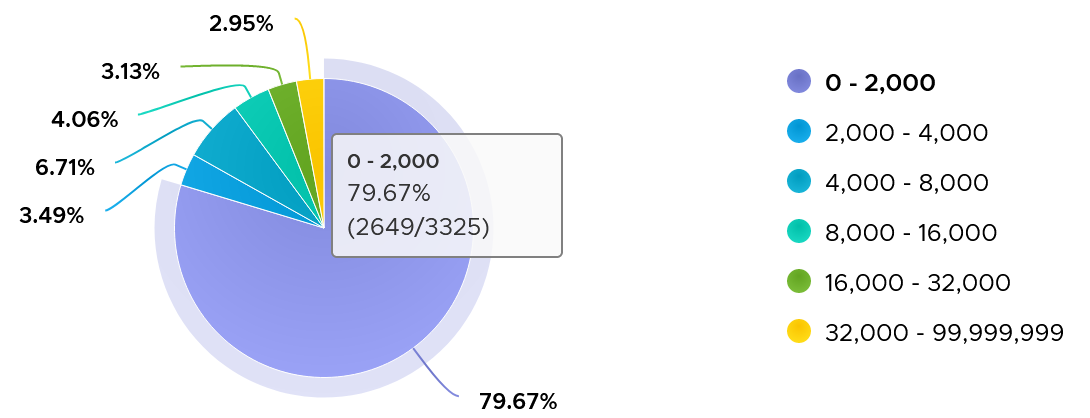
There are 3325 VM in the above chart. In the last 4 months, 97% of them have page-out rate of less than 32000 pages, on a 5-minute average basis.
How about the remaining 3%?
Surprisingly, a few of them can be well 500000, indicating there is a wide range. So majority of VMs do not page out, but those that do, they do it excessively.
The block size is likely 4 KB. Some applications like Java and databases use 2 MB pages. Using 8 KB as the average, 10000 pages per second sustained over 5 minutes means 80000 KB x 300 = 24 GB worth of data.
You can profile your environment to see which VMs are experiencing high paging. Create a view with the following 6 columns
-
Highest Page-In. Color code it with 1000, 10000, and 100000 as the thresholds. That means red is 10x orange, which in turn is 10x yellow.
-
Page-In value at 99th percentile. Same threshold as above.
-
Highest Page-Out. Same threshold as above.
-
Page-Out value at 99th percentile. Same threshold as above.
-
Sum of Page-In
-
Sum of Page-Out
Set the dates to the period you are interested, but make it at least 1 week, preferably 3 months. There 2016 data points in a week, so the 99th percentile ignores the highest 20 datapoints.
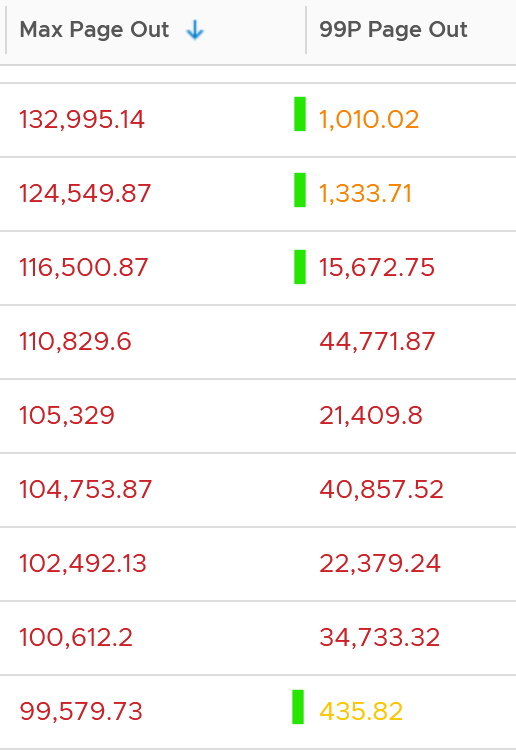
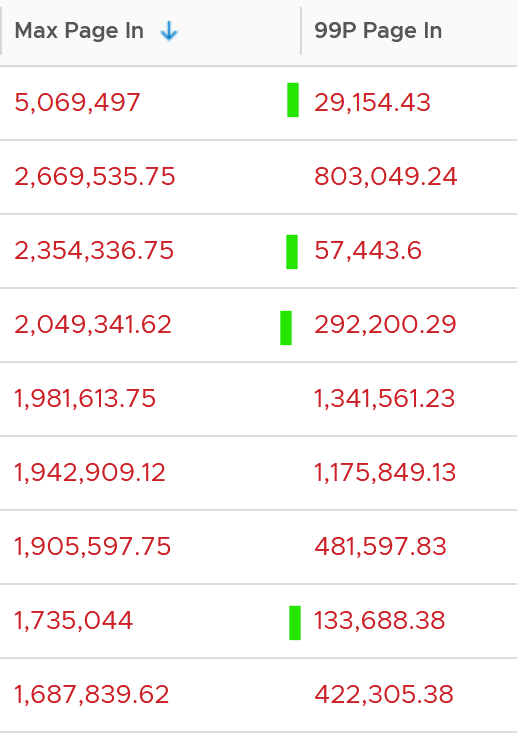
In the following example, I used 4 months. I listed the top VMs in terms, sorted by the highest page-in. What observation do you see?
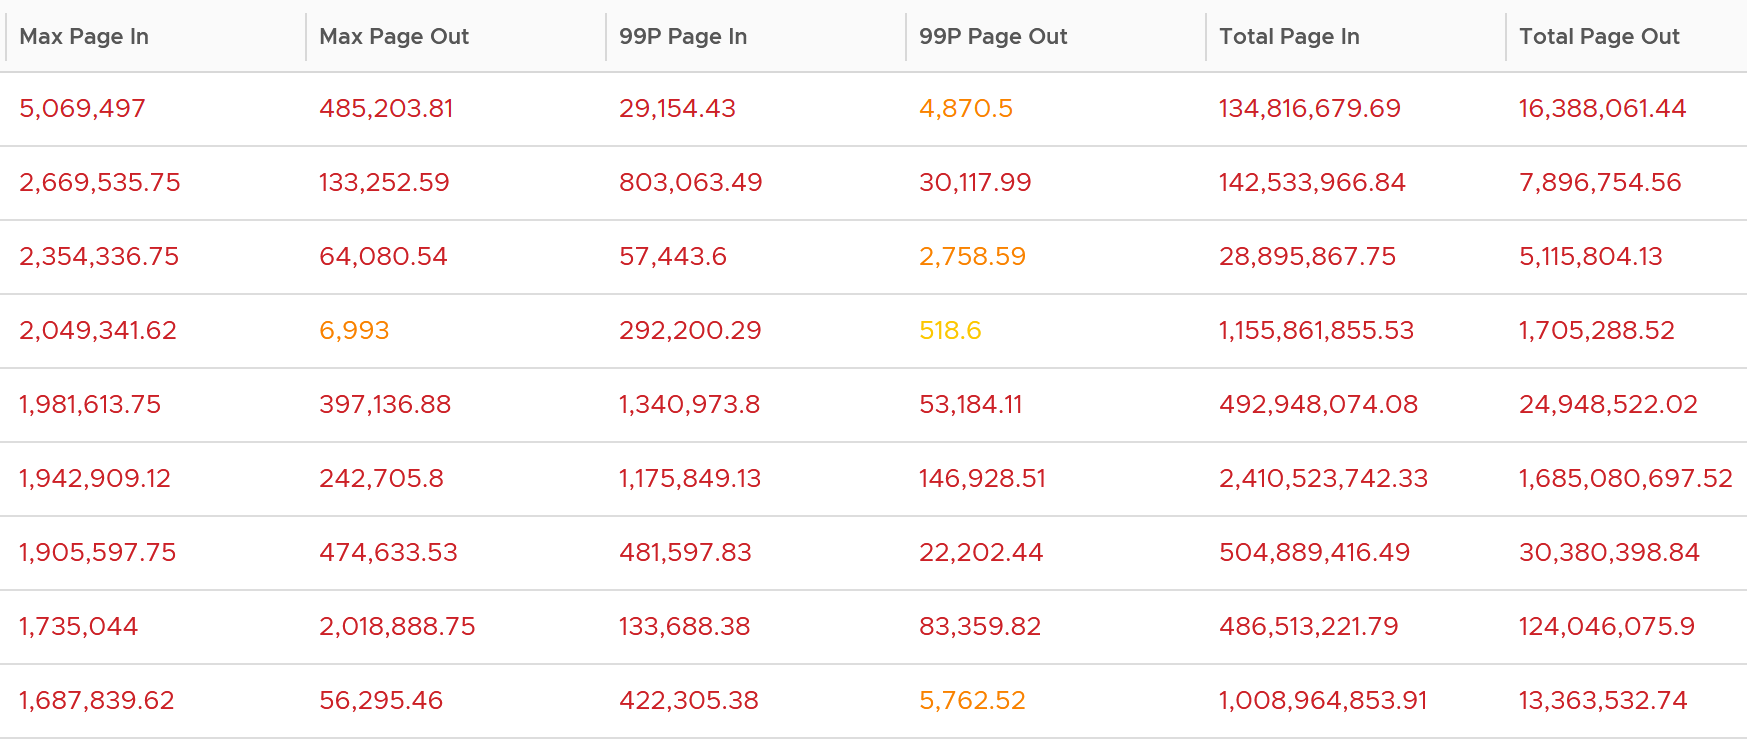
For a start, some of those numbers are really high!
They are above 1 millions. Assuming 8K block size, that’s 8 GB per second, sustained for 300 seconds.
What else do you notice?
Page-In is higher than Page-Out. I average all the 3K VMs and I got the following result:
Page-In is 4x higher in the max value. Page-In also sustains longer, while Page-Out drops significantly. At the 99th percentile mark, Page-In is 9x higher. I suspect it is the non-modifiable page, like binary. Since it cannot be modified, it does not need to be paged out. It can simply be discarded and retrieved again from disk if required.
The good news is both do not sustain, so the paging is momentary. The following shows that the value at 99th percentile can drop well below 5x.
To confirm the above, I downloaded the data so I can determine if the paging is indeed momentarily. Using a spreadsheet, I build a ratio between the 99th percentile value and the maximum value, where 10% means there is a drop of 10x. I plotted around 1000 value and got the following.
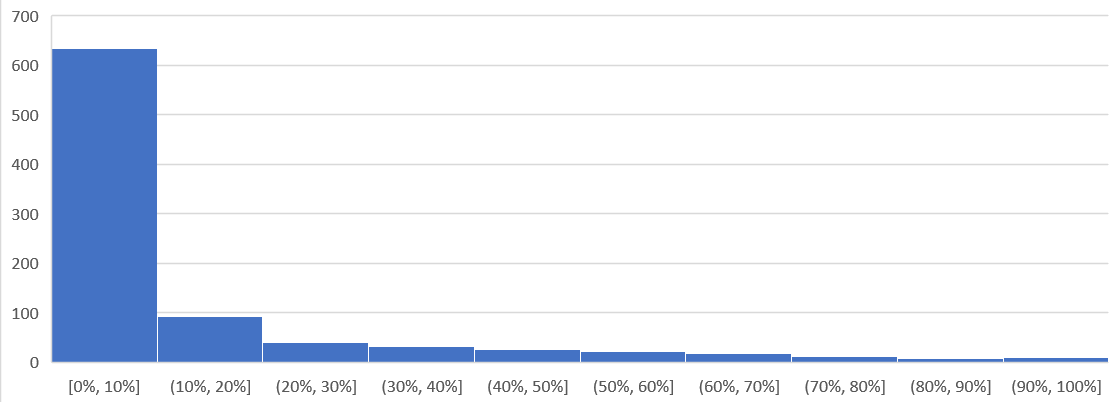
As you can see, majority of the paging drops drastically at 99th percentile.
Let’s dive into a single VM, so we can see pattern over time. I pick a database, as it does heavy paging. The following is a large Oracle RAC VM. Notice this has a closer ratio between page in and page out, and there is correlation between the two.
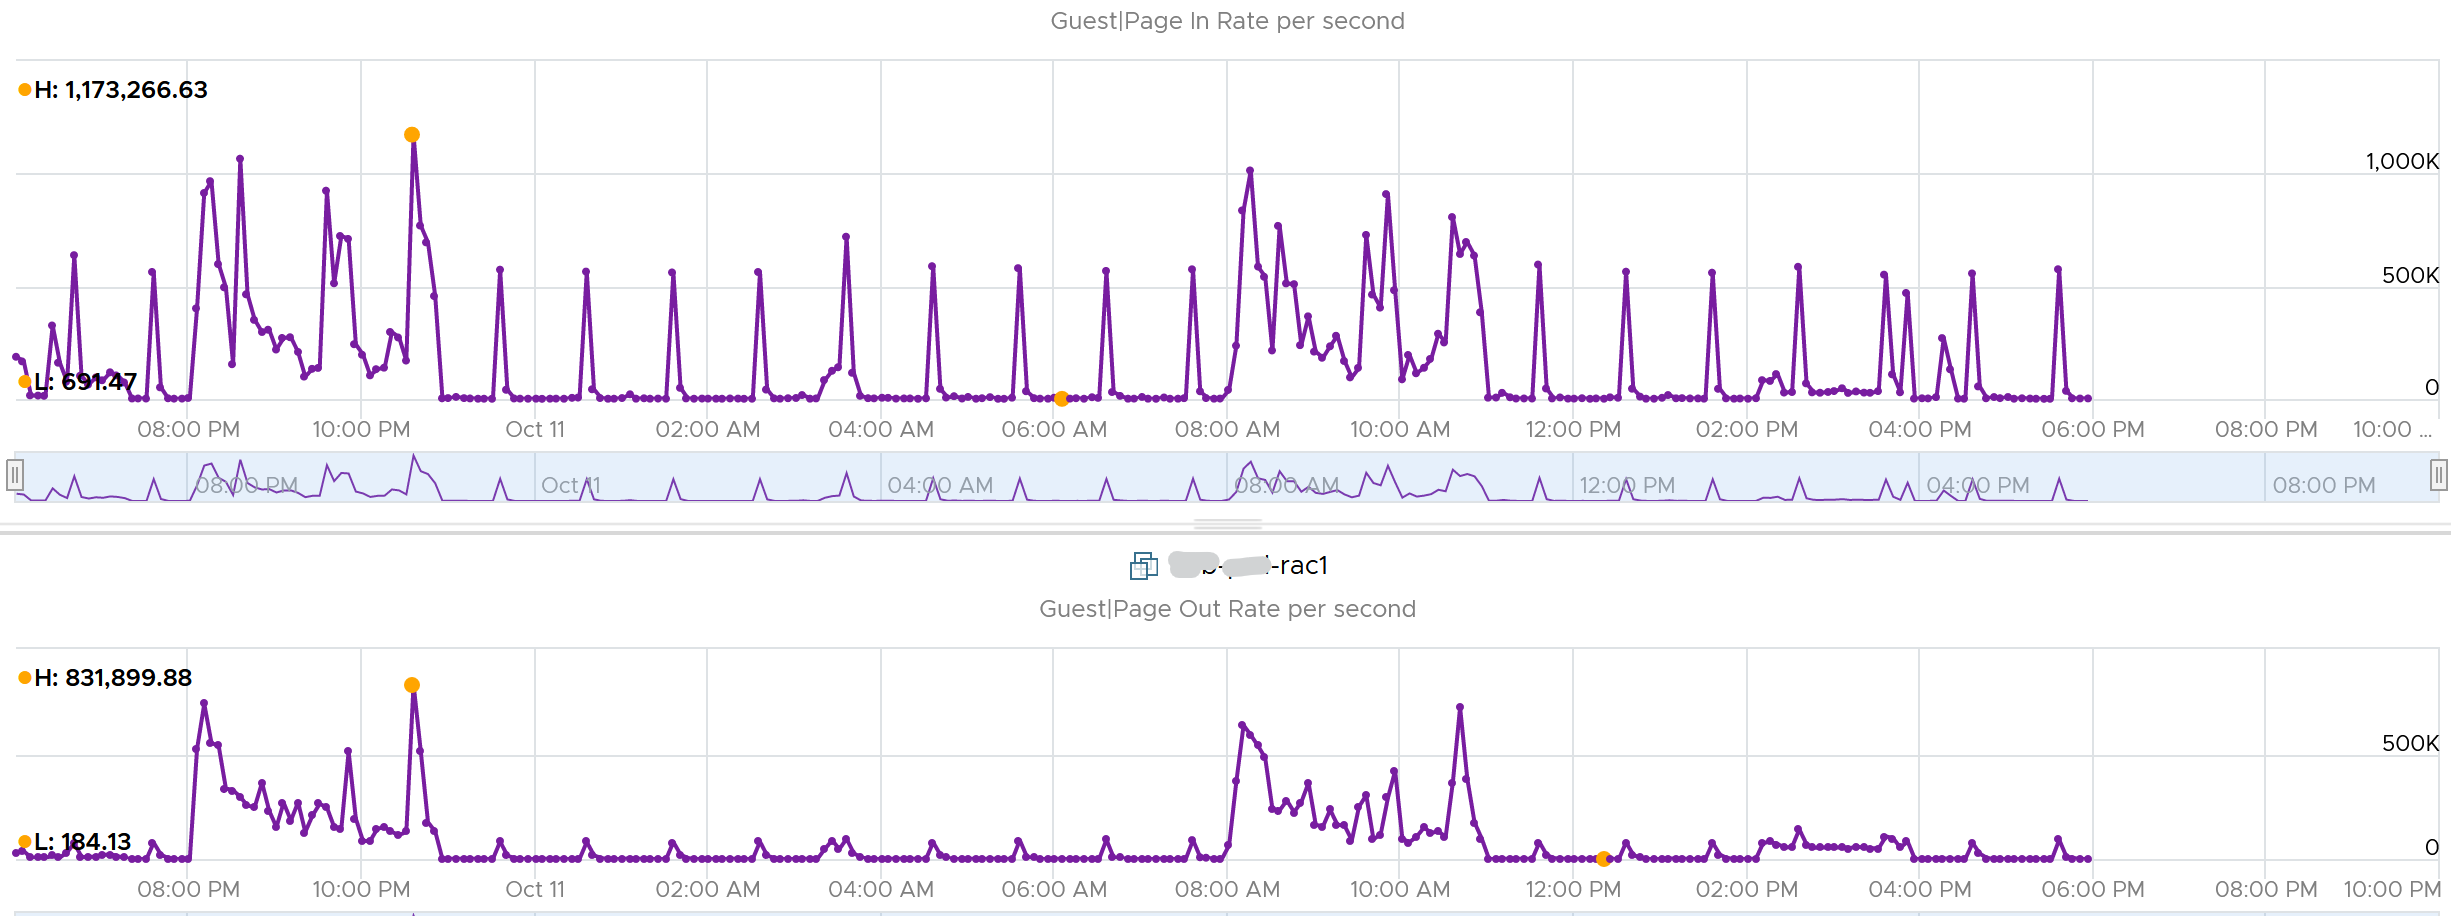
Assuming the page size is 4 KB, that means 100,000 pages = 400 MB/sec. Since VCF Operations averages the value over 300 seconds, that means 400 MB x 300 = 120 GB worth of paging in 5 minutes!
Active File Cache Memory
This is the actively in-use subset of the file cache. Unused file cache and non-file backed anonymous buffers (mallocs etc) are not included.
This is the size of the portion of the system file cache which is currently resident and active in physical memory. The System Cache Resident Bytes and Memory \ Cache Bytes metrics are equivalent. Note that this counter displays the last observed value only; it is not an average during the collection period.
For further reading, refer to Windows
Committed
Commit sounds like a guaranteed reservation, which means it’s the minimum the process can get.
This tracks the currently committed virtual memory, although not all of them are written to the pagefile yet. It measures the demand, so commit can go up without In Use going up, as Brandon Paddock shares here. If Committed exceeds the available memory, paging activity will increase. This can impact performance.
Commit Limit: Commit Limit is physical RAM + size of the page file. Since the pagefile is normally configured to map the physical RAM, the Commit Limit tends to be 2x. Commit Limit is important as a growing value is an early warning sign. The reason is Windows proactively increases its pagefile.sys if it’s under memory pressure.
The pagefile is an integral part of Windows total memory, as explained by Mark Russinovich explains here. There is Reserved Memory, and then there is Committed Memory. Some applications like to have its committed memory in 1 long contiguous block, so it reserves a large chunk up front. Databases and JVM belong in this category. This reserved memory does not actually store meaningful application data or executable. Only when the application commits the page that it becomes used. Mark explains that “when a process commits a region of virtual memory, the OS guarantees that it can maintain all the data the process stores in the memory either in physical memory or on disk”.
Notice the word on disk. Yes, that’s where the pagefile.sys comes in. Windows will use either the physical memory or the pagefile.sys.
So how do we track this committed memory?
The metric you need to track is the Committed Byte. The % Committed metric should not hit 80%. Performance drops when it hits 90%, as if this is a hard threshold used by Windows. We disabled the pagefile to verify the impact on Windows. We noticed a visibly slower performance even though Windows 7 showing >1 GB of Free memory. In fact, Windows gave error message, and some applications crashed. If you use a pagefile, you will not hit this limit.
We have covered Free Memory and Committed Memory. Do they always move in tandem? If a memory is committed by Windows, does it mean it’s no longer free and available?
The answer is no. Brandon Paddock demonstrated here that you can increase the committed page without increasing the memory usage. He wrote a small program and explained how it’s done. The result is Windows committed page is double that of memory usage. The Free Memory & Cached Memory did not change.
Needed Memory
This is not a raw counter from Windows or Linux. This is a derived counter provided by VMware Tools to estimate the memory needed to run with minimum swapping. It’s a more conservative estimate as it includes some of the cache. It has 5% buffer for spike, based on the general guidance from Microsoft. Below this amount, the Guest OS may swap.
= physical memory - Maximum of (0, ( Unneeded - 5 % of physical ))
where Unneeded = Free + Reserve Cache + Normal Priority Cache
Example: the VM has 10 GB of RAM. So the Physical RAM = 10 GB
So 5% of physical = 0.5 GB
*Situation 1: max memory utilization.*
Memory Available = 0 GB.\
Tools will calculate Needed memory as\
= 10 GB - Maximum (0, 0 – 0.5)\
= 10 - Maximum (0, -0.5)\
= 10 - 0 GB\
= 10 GB\
Needed memory is the same as it’s already maxed.
*Situation 2: high memory utilization.*
Memory Available = 2 GB.\
Tools will calculate Needed memory as\
= 10 GB - Maximum (0, 2 – 0.5)\
= 10 - Maximum (0, 1.5 GB)\
= 10 - 1.5 GB\
= 8.5 GB\
You actually still have 2 GB here. But Tools adds around 5%
*Situation 3: low memory utilization.*
Memory Available = 8 GB.\
Tools will calculate Needed memory as\
= 10 GB - Maximum (0, 8 – 0.5)\
= 10 - Maximum (0, 7.5 GB)\
= 10 - 7.5 GB\
= 2.5 GB\
Again, Tools adds around 5%.
We’ve covered that you need to look at more than 1 metric before you decide to add more memory. I’m afraid it is case by case, as shown in the following table. All these VMs are low on free memory, but other than VM on row no 3, the rest has sufficient memory.