CPU
Performance Monitor is still the main tool for Microsoft Windows, despite the fact it has not been enhanced for decades. Go to docs.microsoft.com and browse for Windows Server. It took me to this article, which cover PerfMon. Many explanations on metrics at https://learn.microsoft.com/ are still based on end-of-life Windows.
PerfMon groups the counters under Processor group. However, it places the Processor Queue Length and Context Switches metrics under the System group. The System group covers system wide metrics, not just CPU.
The following screenshot shows the counters under Processor group.
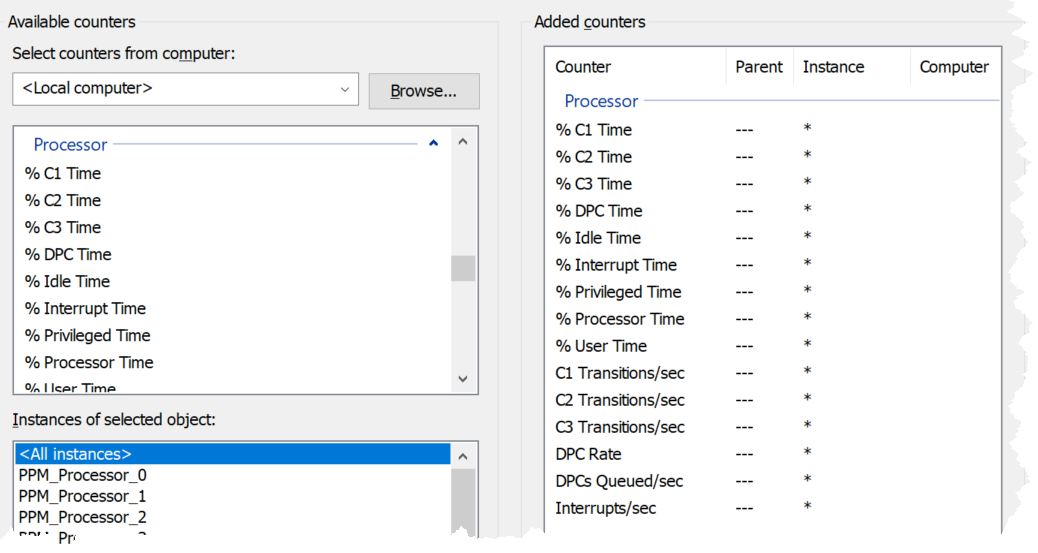
PerfMon UI provides a description, which I use as a reference below:
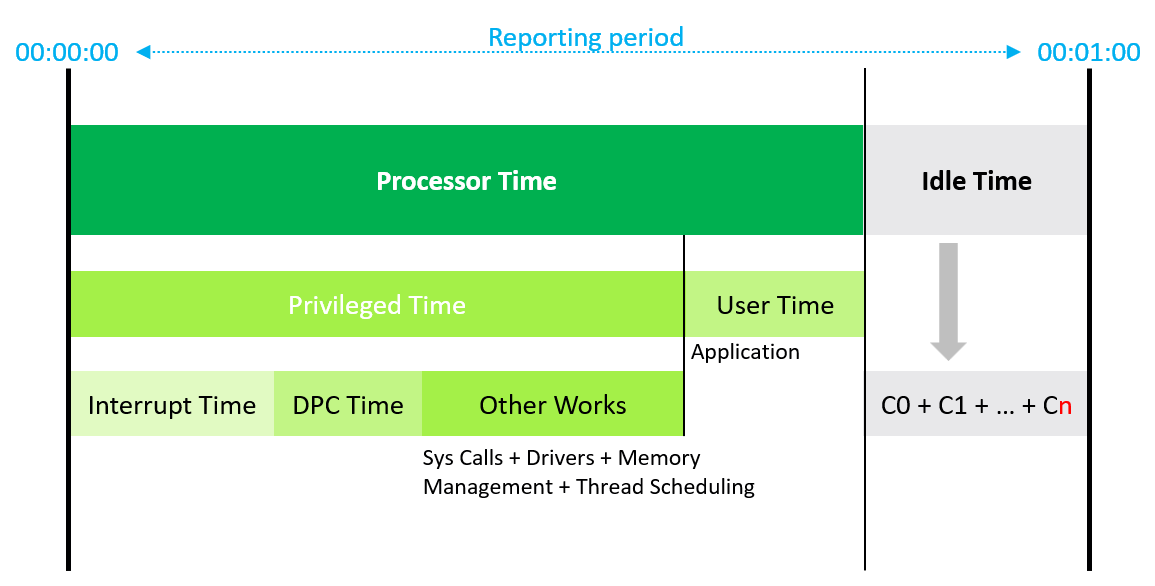
% C1 Time % C2 Time % C3 Time | Based on this April 2004 article, Windows can operate in 4 different power levels. The C0 is the highest, while C3 consumes the least amount of power. C1 + C2 + C3 may not add to Idle Time. If you set dynamic power management, expect the lower power to be registering higher value during idle period. Reference: here. |
|---|---|
C1 Transitions/sec C2 Transitions/sec C3 Transitions/sec | The amount of time on each power level does not tell the full picture. You also need to know how frequent you enter and exit that level. These 3 metrics track the number of transitions into the respective level. For example, a high number on all 3 counters mean Windows is fluctuating greatly, resulting in inconsistent speed. |
| % DPC Time | Deferred Procedure Calls (DPC). According to this, this counter is a part of the Privileged Time (%) because DPCs are executed in privileged mode. They are counted separately and are not a component of the interrupt counters. |
| % Interrupt Time | Interrupt means the processor was interrupted from executing normal thread. This can happen for a variety of reasons, such as system clock, incoming network packets, mouse and keyboard activity. Interrupt can happen on regular basis, not just ad hoc. For example, the system clock does it every 10 milliseconds in the background. |
| A high interrupt value can impact performance. | |
% Processor Time % Idle Time | These 2 metrics add up to 100% |
% User Time % Privileged Time | These 2 metrics add up to 100%. A program’s process can switch between user mode and kernel mode (when executing system service call). This does not incur CPU context switch as it’s the same thread. As a result, I’m not seeing the use case of knowing the split between kernel mode and user mode. Reference: Windows |
| DPCs Queued/sec | Unlike the CPU Run Queue, this metric captures per processor. It can be handy to compare across processors as there can be imbalance. Note this is a rate counter, not a count of the present queue. It tracks the speed per second. |
| DPC Rate | This is an input to the above, as the above is calculated as the delta of 2 rates, divided over sampling period. |
| Interrupts/sec | As above, but for interrupts. |
| Priority Time | It is a subset of % Processor Time — specifically the portion of busy CPU time consumed by threads running at elevated scheduling priorities |
System Calls/second
-
It is not a CPU metric but is commonly used next to the queue and context-switch counters.
-
A call is a request to the kernel to do work on behalf. It occurs because the program cannot perform a task itself because it involves protected resources (like hardware or memory belonging to other processes). This instruction forces the CPU to switch from Ring 3 (User Mode) to Ring 0 (Kernel Mode).
-
It measures the number of times a software application transitions from User Mode to Kernel Mode to request a service from the kernel.
-
If System Calls/sec is high and Privileged Time (%) is also high (e.g., >30%), the CPU is spending too much time on OS management rather than running your actual application code.
-
Values consistently exceeding 20,000 per processor core are generally considered high and warrant investigation. In most cases, it’s below 2000 per core.
-
This metric is not collected by Tools.
Thread State
In Windows, an application consists of ≥ 1 process. A process consists of ≥ threads. Thread is what is scheduled in the CPU.
It’s easier to understand the CPU scheduling when you think in terms of 2 distinct objects:
-
Processors
-
Threads.
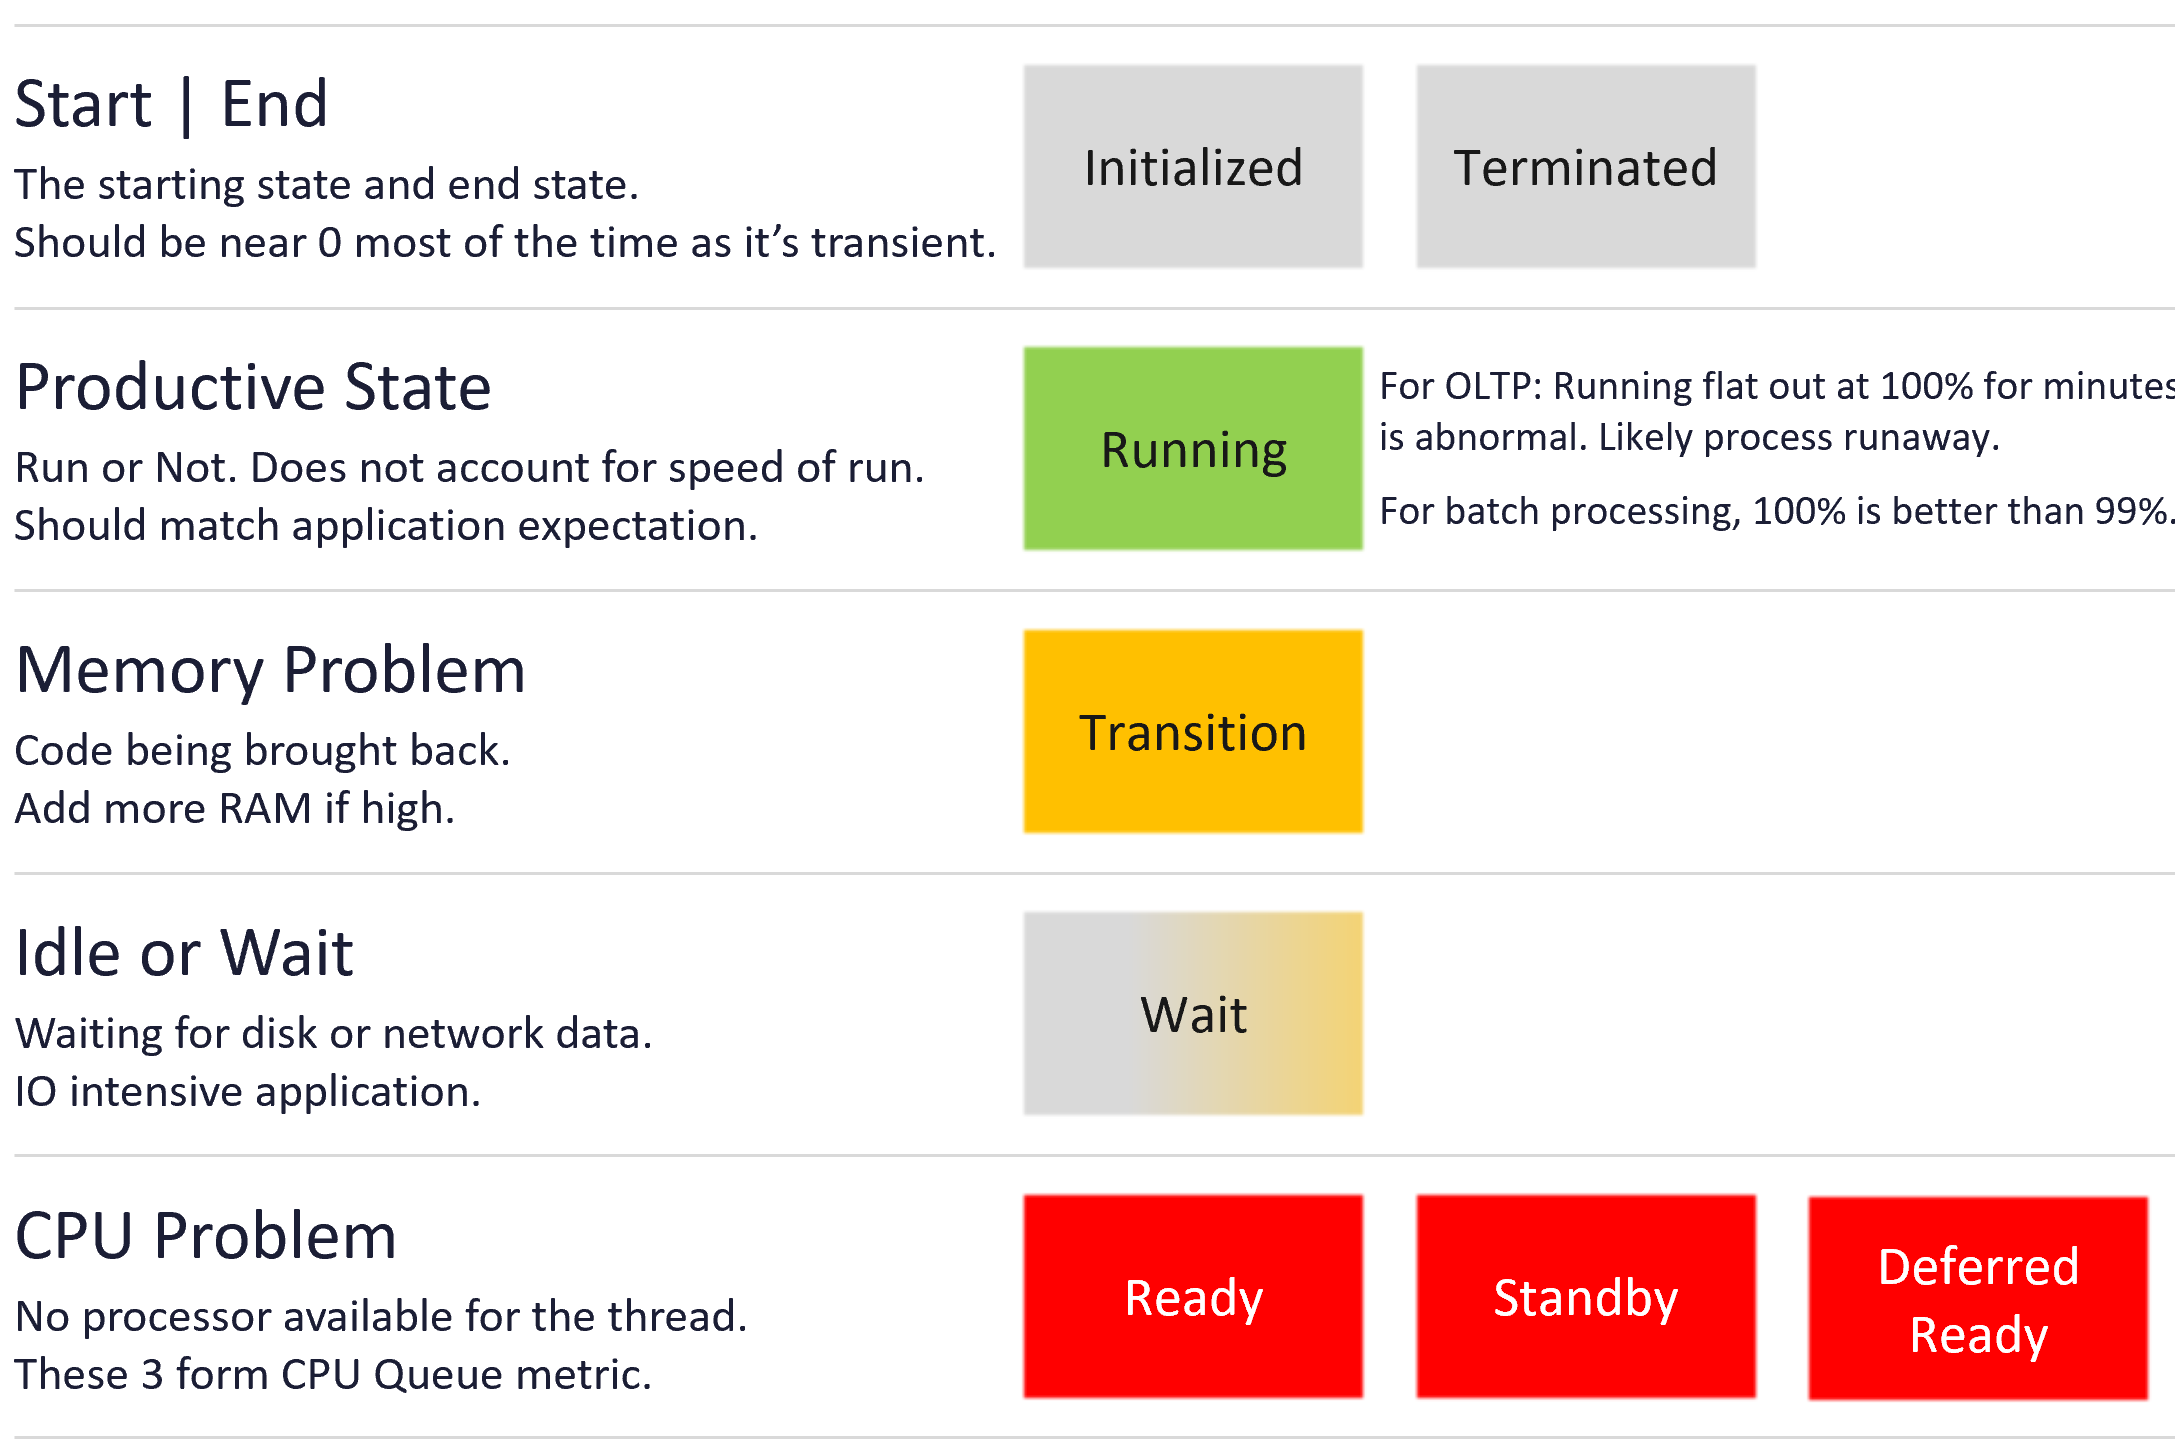
The following information is taken from the famous Windows Internal book, 7th edition and from this Microsoft link. A thread is always in one of these 8 possible states.
You may see a higher or lower number than the number of processors as the observability tools counts the threads, not the processors. Windows PerfMon or WMI code cycles through each thread and get the state. It collects the state at that particular moment. In the 100 milliseconds or so it takes to finish counting thousands of threads, the "Standby" slots on the CPUs could have been emptied and refilled hundreds of times.
CPU Issue
This means there is not enough CPU, or there is the performance issue is with CPU.
| Ready | The thread is waiting to use a processor because all processors are busy running. The thread is prepared to run on the next available processor. When looking for a thread to execute, the CPU dispatcher considers only the threads in this state. |
|---|---|
| It also counts when a thread is waiting to be in-swapped after completing a wait state. | |
| It also counts when a thread was interrupted by higher priority thread, as preemption moves the thread into Ready state. However, it puts the thread at the front of the queue, so it can complete its remaining time slice. | |
The number should be near 0 for most of the time. However, it can be high if you have many high-priority threads constantly "bumping" lower-priority threads. Even though work is technically getting done, the lower-priority threads are "stacking up" in the Ready state, waiting for their chance to finish their interrupted tasks. | |
| Standby | The thread has been selected by Windows as the next thread to run on this processor. Only one thread can be in the standby state for each processor on the system. A Windows OS with 10 processors will have up to 10 threads. When the correct conditions exist, the dispatcher performs a context switch to this thread. Naturally, just because you’re next to be run, does not mean you get to run. A higher priority, typically IO interrupt, can be the thread that got the CPU time. |
| Deferred Ready | When a thread is ready to run (e.g., an I/O operation finishes), the kernel needs to pick a processor for it. Instead of immediately locking that target processor's Ready queue, the kernel puts the thread into a general Deferred Ready list. So the thread has ben selected to run on a specific processor but have not actually started running there. This non-processor specific state exists so that the kernel can minimize the amount of time the per-processor lock on the scheduling database is held. The lock would slow down the CPU currently doing work. |
In Performance Monitor and WMI (Win32_PerfRawData_PerfProc_Thread), the label is typically "Unknown." However, in the actual Windows Kernel logic, it actually means Deferred Ready. |
Non-CPU Issue
CPU is much faster than memory, disk or network. These 2 states capture times where CPU is waiting for data.
| Idle or Wait | "Waiting" is the natural state for 99% of threads. At any given moment, Windows might have 3,000 threads, but 2,950 of them are "Waiting" for user interaction or for a background update to ping a server. |
|---|---|
Possible reasons:
| |
| When the thread’s wait ends, depending on its priority, the thread either begins running immediately or is moved back to the ready state. | |
| The performance issue could be disk or network. | |
| Transition | The thread is waiting as its kernel stack was paged out of memory. After its kernel stack is brought back into memory, the thread enters the ready. You should notice a corresponding increase in Memory Page Faults counter. |
| This indicate the performance issue is with memory, not CPU. Increase memory to the application. |
Other States
| Initialized | A state that indicates the thread is being created, hence it cannot be run yet. |
|---|---|
| The value at this state should be near 0 most of the time. A high value indicates a problem. Check if the application is spawning threads excessively. If not, check why a quick process is taking a long time. | |
| Terminated | A state that indicates the thread has finished executing and has exited. This is not a performance problem if it ends as per planned. |
| Running | A state that indicates the thread is currently using a processor. This is the productive state, meaning work is being done, hence it’s the only state in green. |
The value should be close to the sum of infrastructure team sizing and application team sizing. Infrastructure team size based on Windows or Linux, plus the standard software such as VMware Tools and Security Agents. This is fairly standardized across all virtual machines. Application team size based on their application workload. It can be profiled by before versus after of the application loading. |
Run Queue
Number of threads in the processor queue. Unlike Linux, Windows excludes the threads that are running (being executed).
Let’s take a VM configured with 8 vCPUs. The Guest OS sees 8 threads so it will schedule up to 8 parallel processes. If there is more demand, it will have to queue them. This means the queue needs to be accounted for in Guest OS sizing.
Because it reports the queue, this is the primary counter to measure Guest OS CPU performance. It tells you if the CPU is struggling to serve the demand or not.
What is a healthy value?
Here is my take:
| | 2 - 4 per processor |
|-----|---------------------|
| | 4 – 8 per processor |
| | > 8 per processor |
Windows Performance Monitor UI description is not consistent with MSDN documentation (based on Windows Server 2016 documentation). The description shown in Windows UI is “Processor Queue Length is the number of threads in the processor queue. Unlike the disk counters, this counter shows ready threads only, not threads that are running. There is a single queue for processor time even on computers with multiple processors. Therefore, if a computer has multiple processors, you need to divide this value by the number of processors servicing the workload. A sustained processor queue of less than 10 threads per processor is normally acceptable, dependent of the workload.”
MSDN document states that a sustained processor queue of greater than 2 threads generally indicate processor congestion. SQL Server document states 3 as the threshold. Let me know if you have seen other recommendations from Microsoft or Linux.
Windows or Linux utilization may be 100%, but as long as the queue is low, the workload is running as fast as it can. Adding more vCPU will in fact slow down the performance as you have higher chance of context switching.
You should profile your environment, because the number can be high for some VMs. Just look at the numbers I got below. I profiled 3385 Windows VM in the last 1 month. I plotted the highest value.
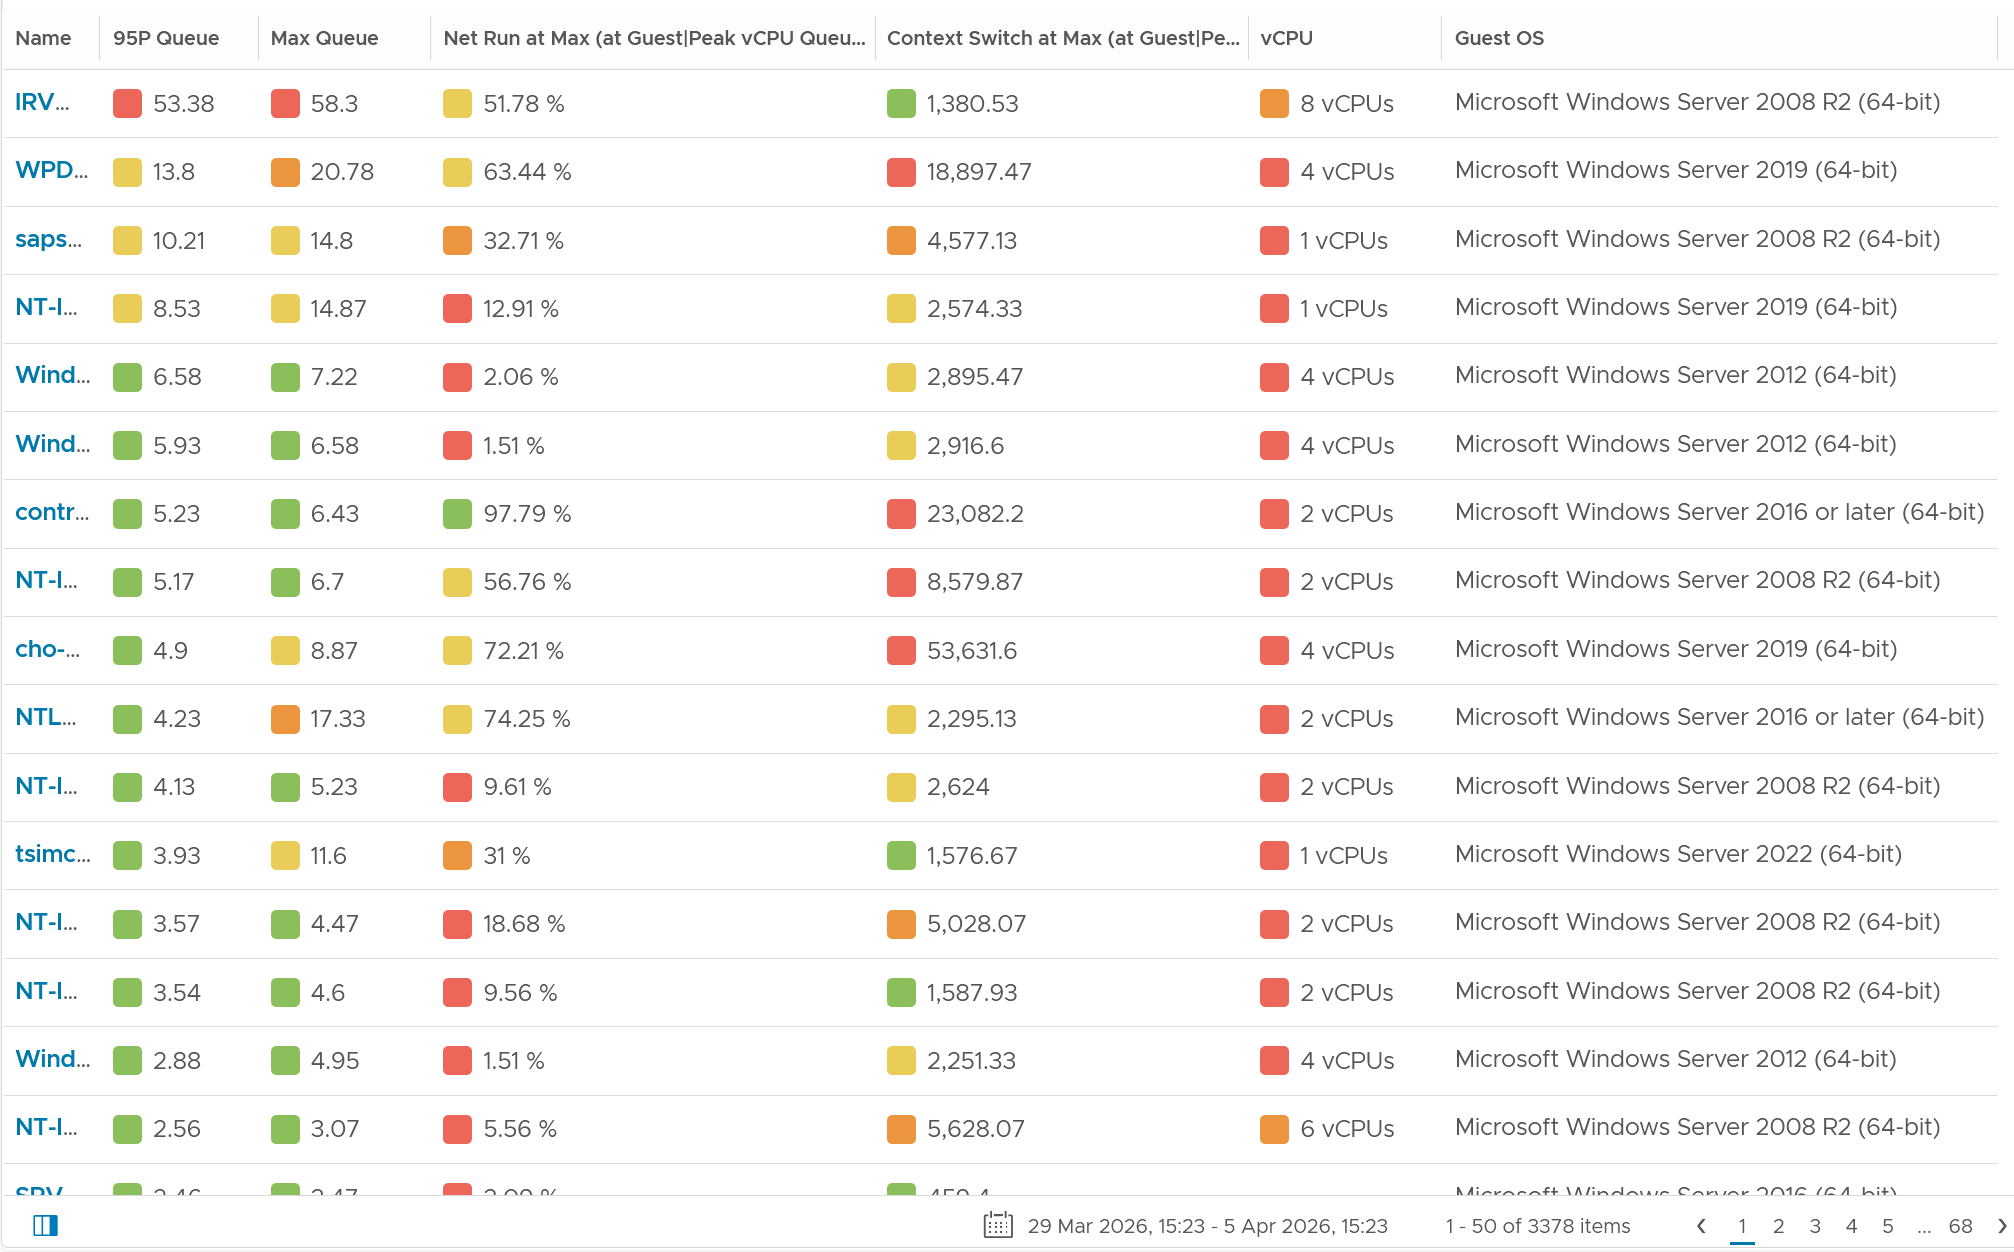
Columns explanation:
-
95P means the value at 95th percentile during the last 1 week.
-
I take 95th percentile because there are 30240 data points.
-
While the collection is every 5 minutes, the value is a snapshot taken every 20 seconds. It is the highest among 15 data points. There are 15 data points * 7 days * 24 hours * 12 = 30240 data points.
-
-
Max Queue means the highest in the last 1 week. That means it is the highest of 30240 data points.
-
Net Run at Max means the value of CPU Net Run when the value of vCPU Queue is at the highest. Using the first VM as an example, Net Run showed 52% when CPU Queue was at 58%. It’s a correlated number.
-
Context Switch as Max means the value of Microsoft Windows CPU Context Switch when the value of vCPU Queue is at the highest.
-
vCPU is the present configured CPU. This number is generally stable, hence I took the present.
High CPU Queue
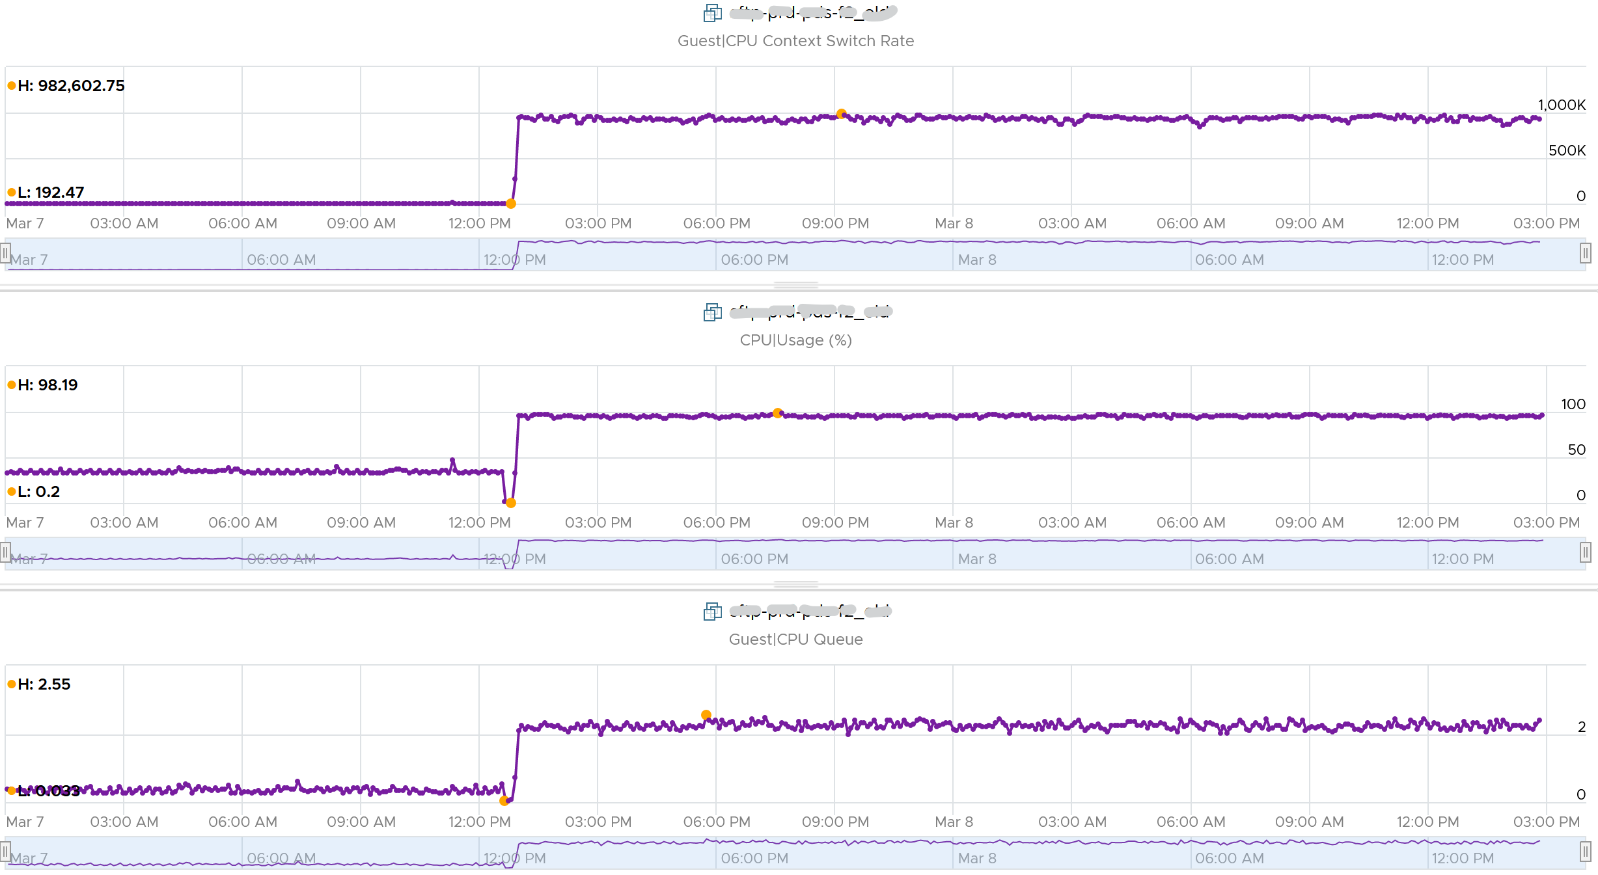
Let’s drill down to the first VM in the preceding table.
How can an 8 vCPU Windows Server VM have CPU Queue of 53 when only running at 52%?
We expect the number to be around 8 since only half the CPU are running. Basically it should be 0 Ready + 8 Standby + 0 Deferred Ready.
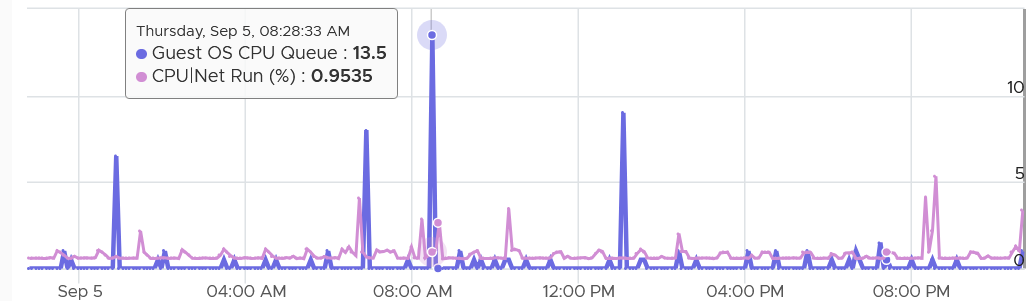
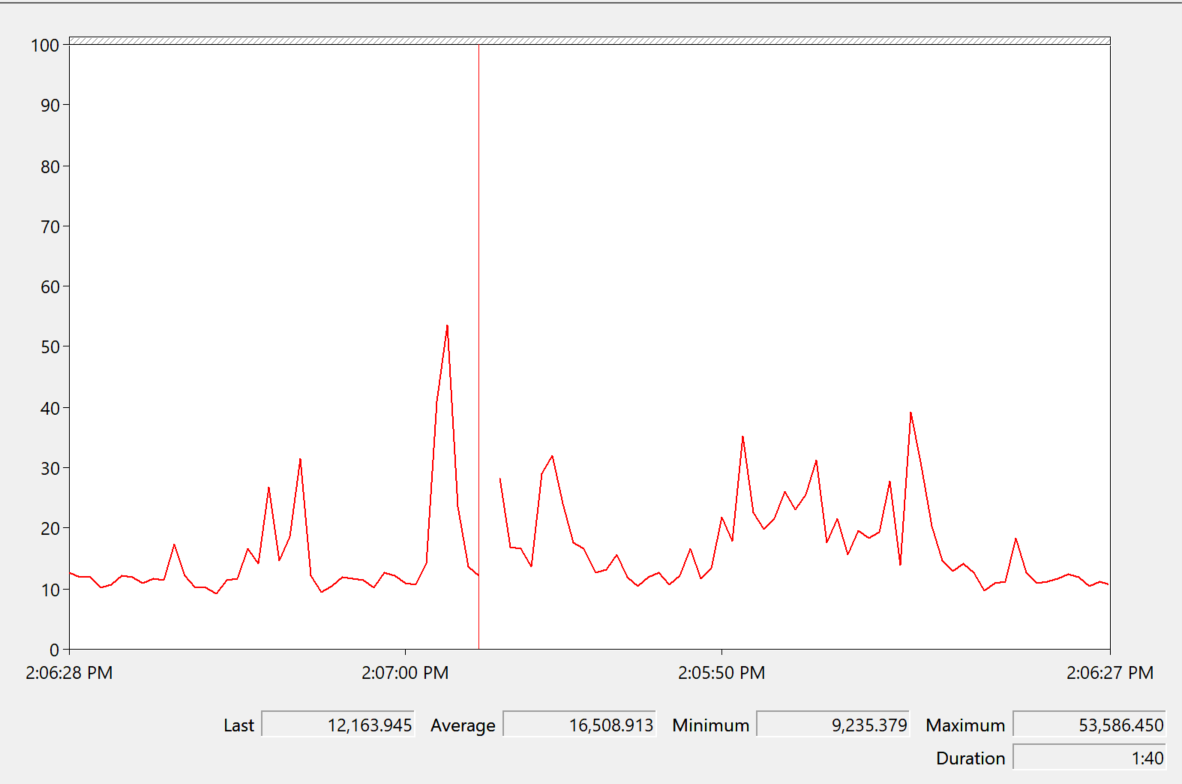
What do you notice from the following chart?
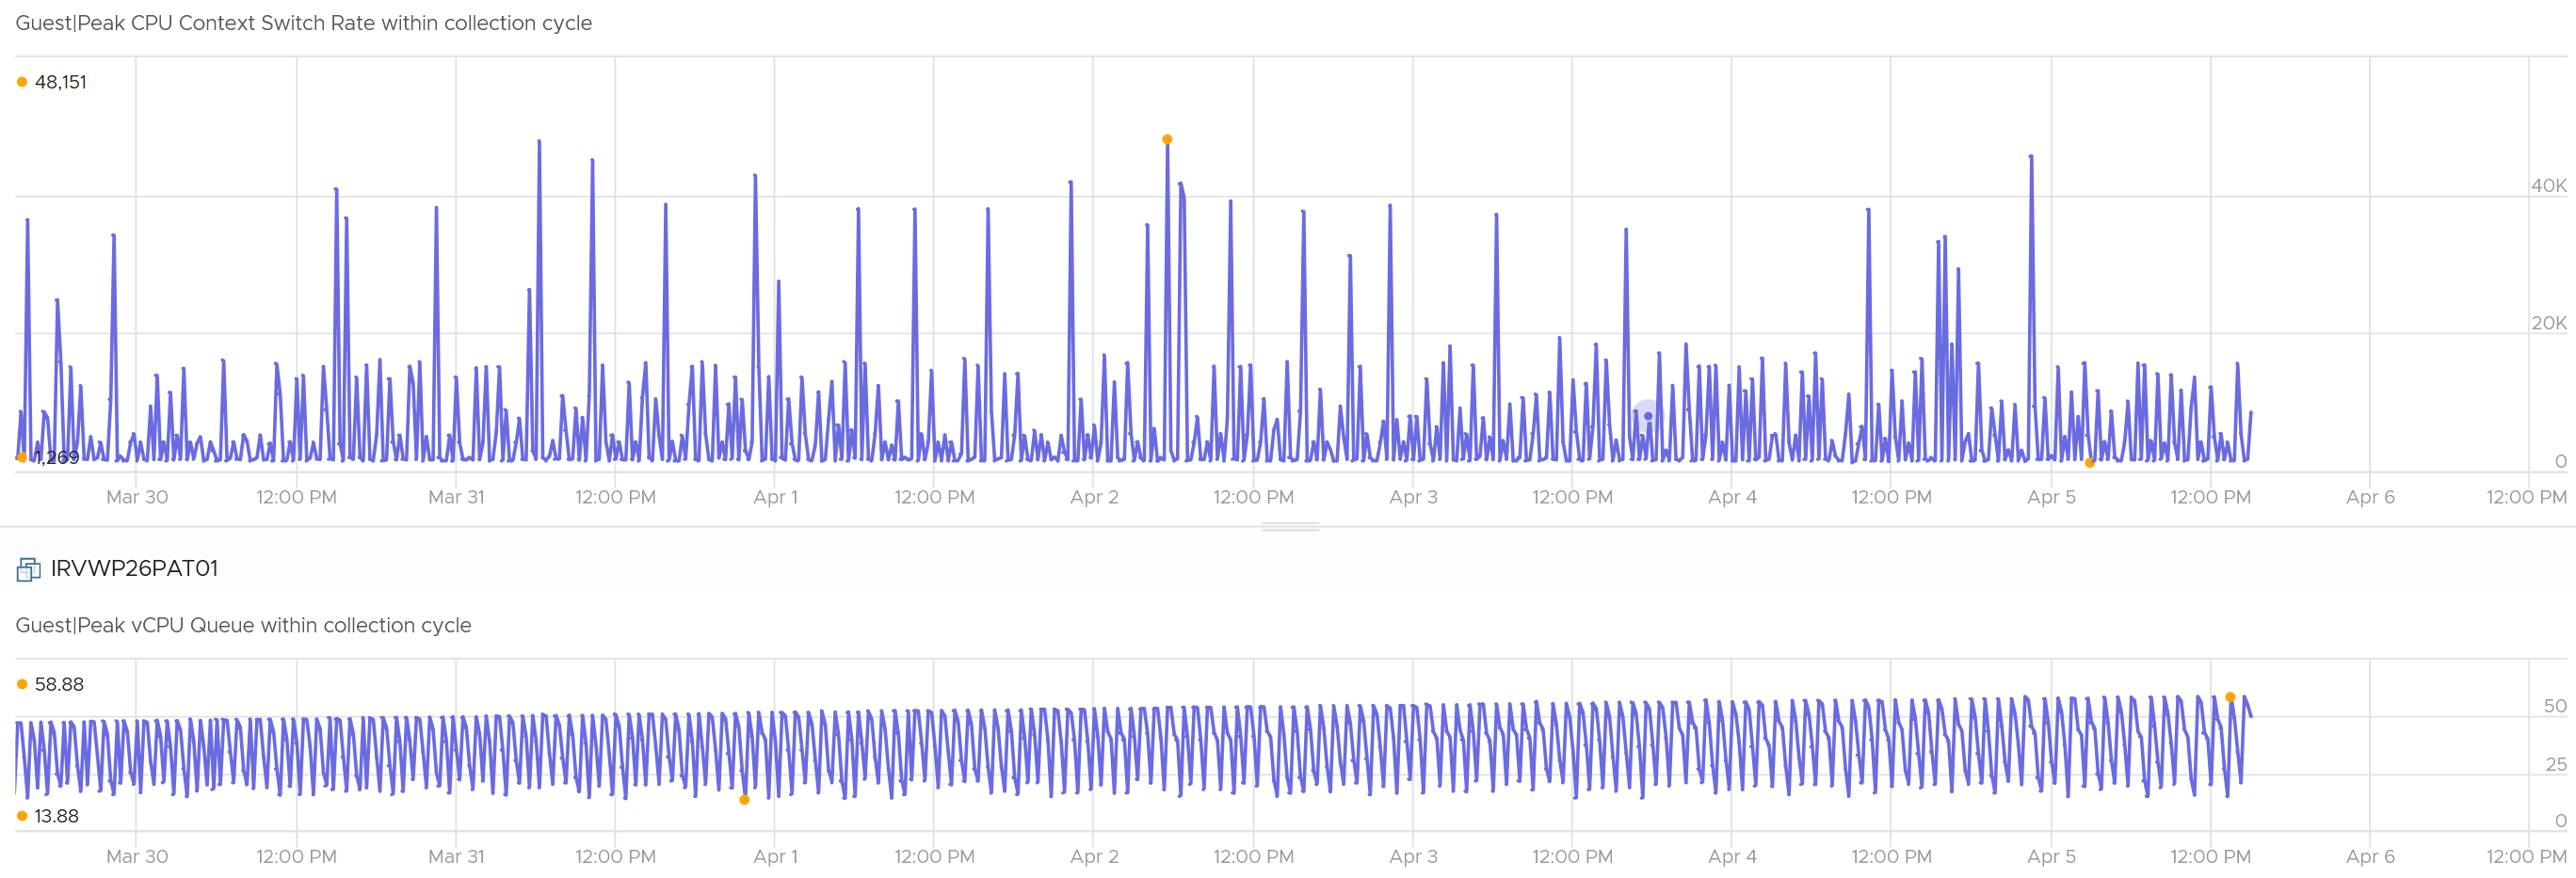
There seems to be no strong correlation between CPU Queue and CPU Context Switch.
The CPU Queue:
-
Fluctuates from 14 to 59 constantly. The pattern is repeatable. When I zoomed in, each cycle has a sharp jump within 5 – 10 minutes, then slowly drops over 1 hour.
-
Trend upwards over 7 days. It’s a gentle trend. This means something that slowly deteriorates caused it. Memory leak?
FYI:
-
CPU Ready, CPU Co-Stop and CPU Other Wait are all low. This means NUMA is not an issue.
-
Memory contention is flat 0.
-
Virtual Disk latency is low most of the time, and did not correspond to the above 3 charts.
Here is CPU consumption metrics:
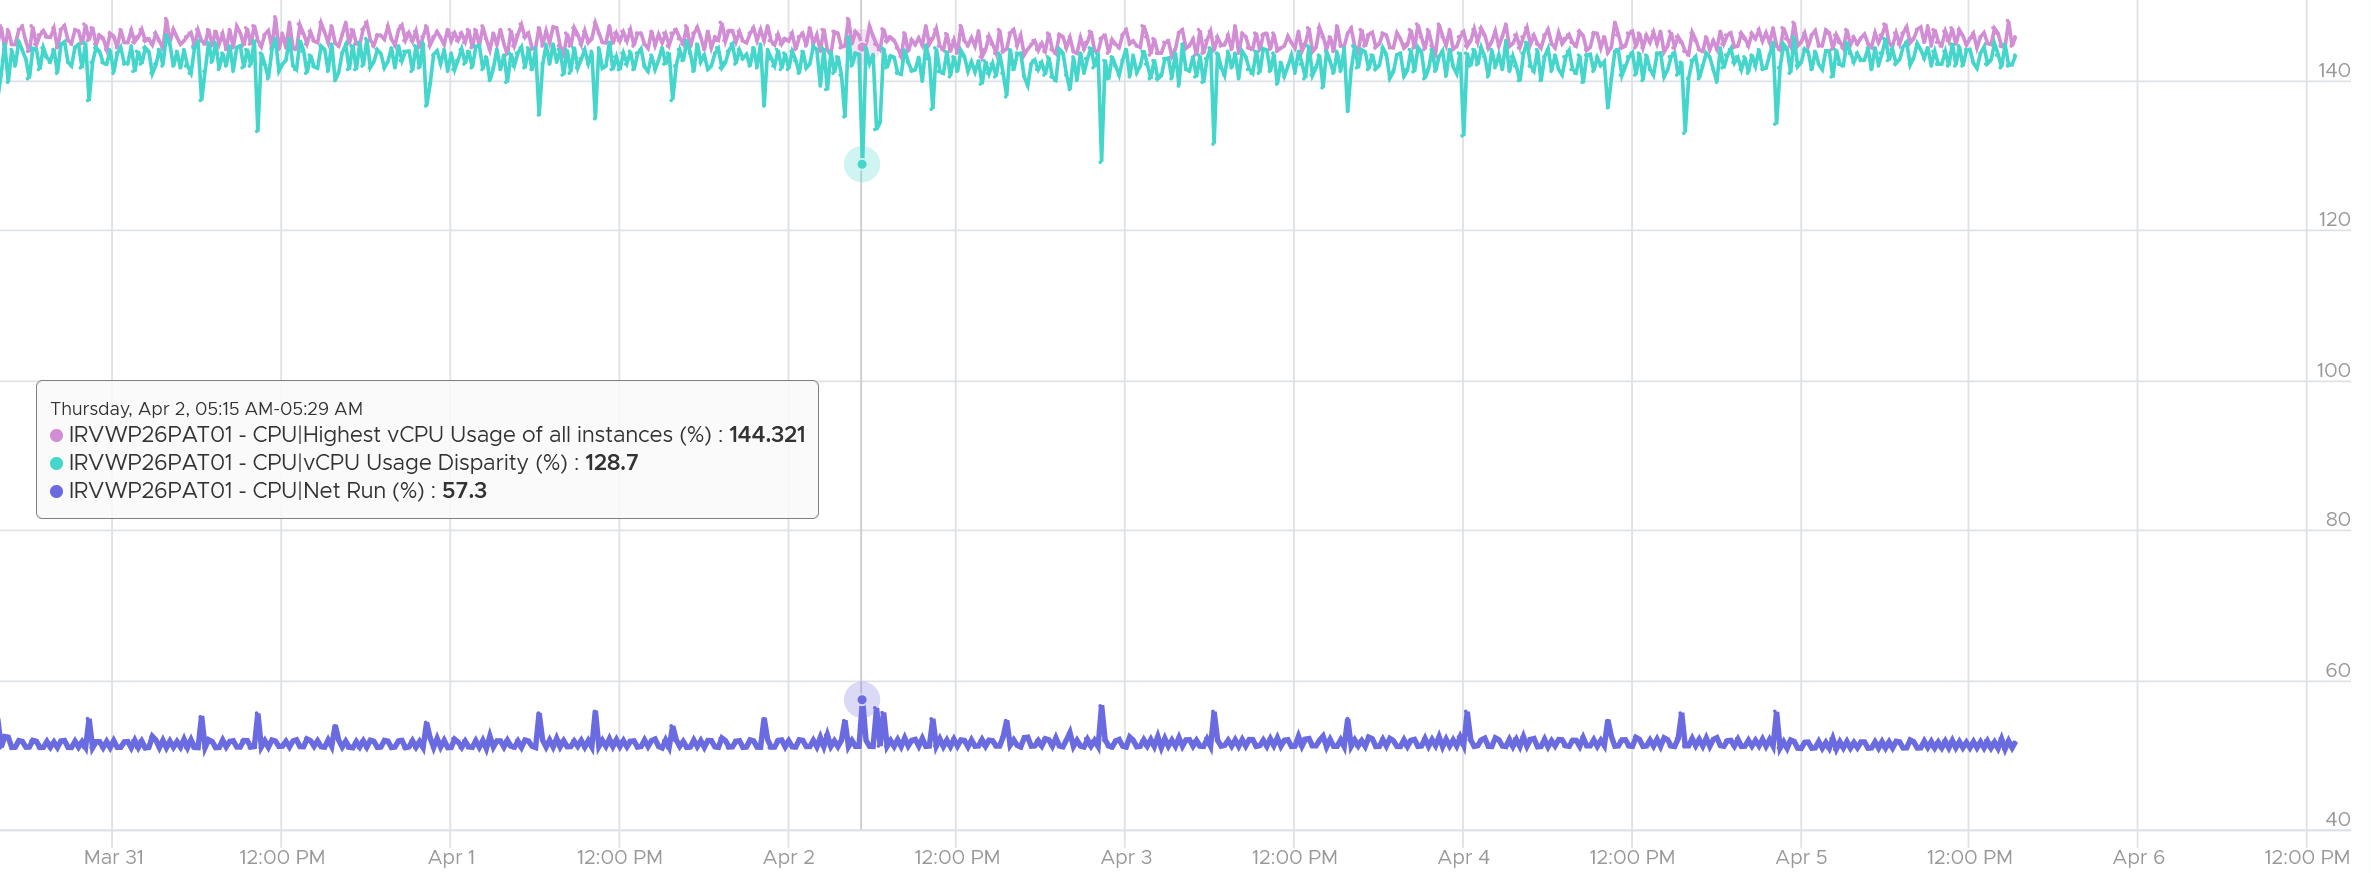
We can see massive imbalance. While the average CPU Run is 50%, the gap between the busiest vCPU and the least busy is >140%. Seems like the threads congregate in some of the CPU.
I don’t have the details of the invidual vCPU. It will be interesting to plot each to see if there is high thread migation.
Let’s pick a shorter time window so we can see the chart clearly.
The following chart shows the pattern over 6 hours.
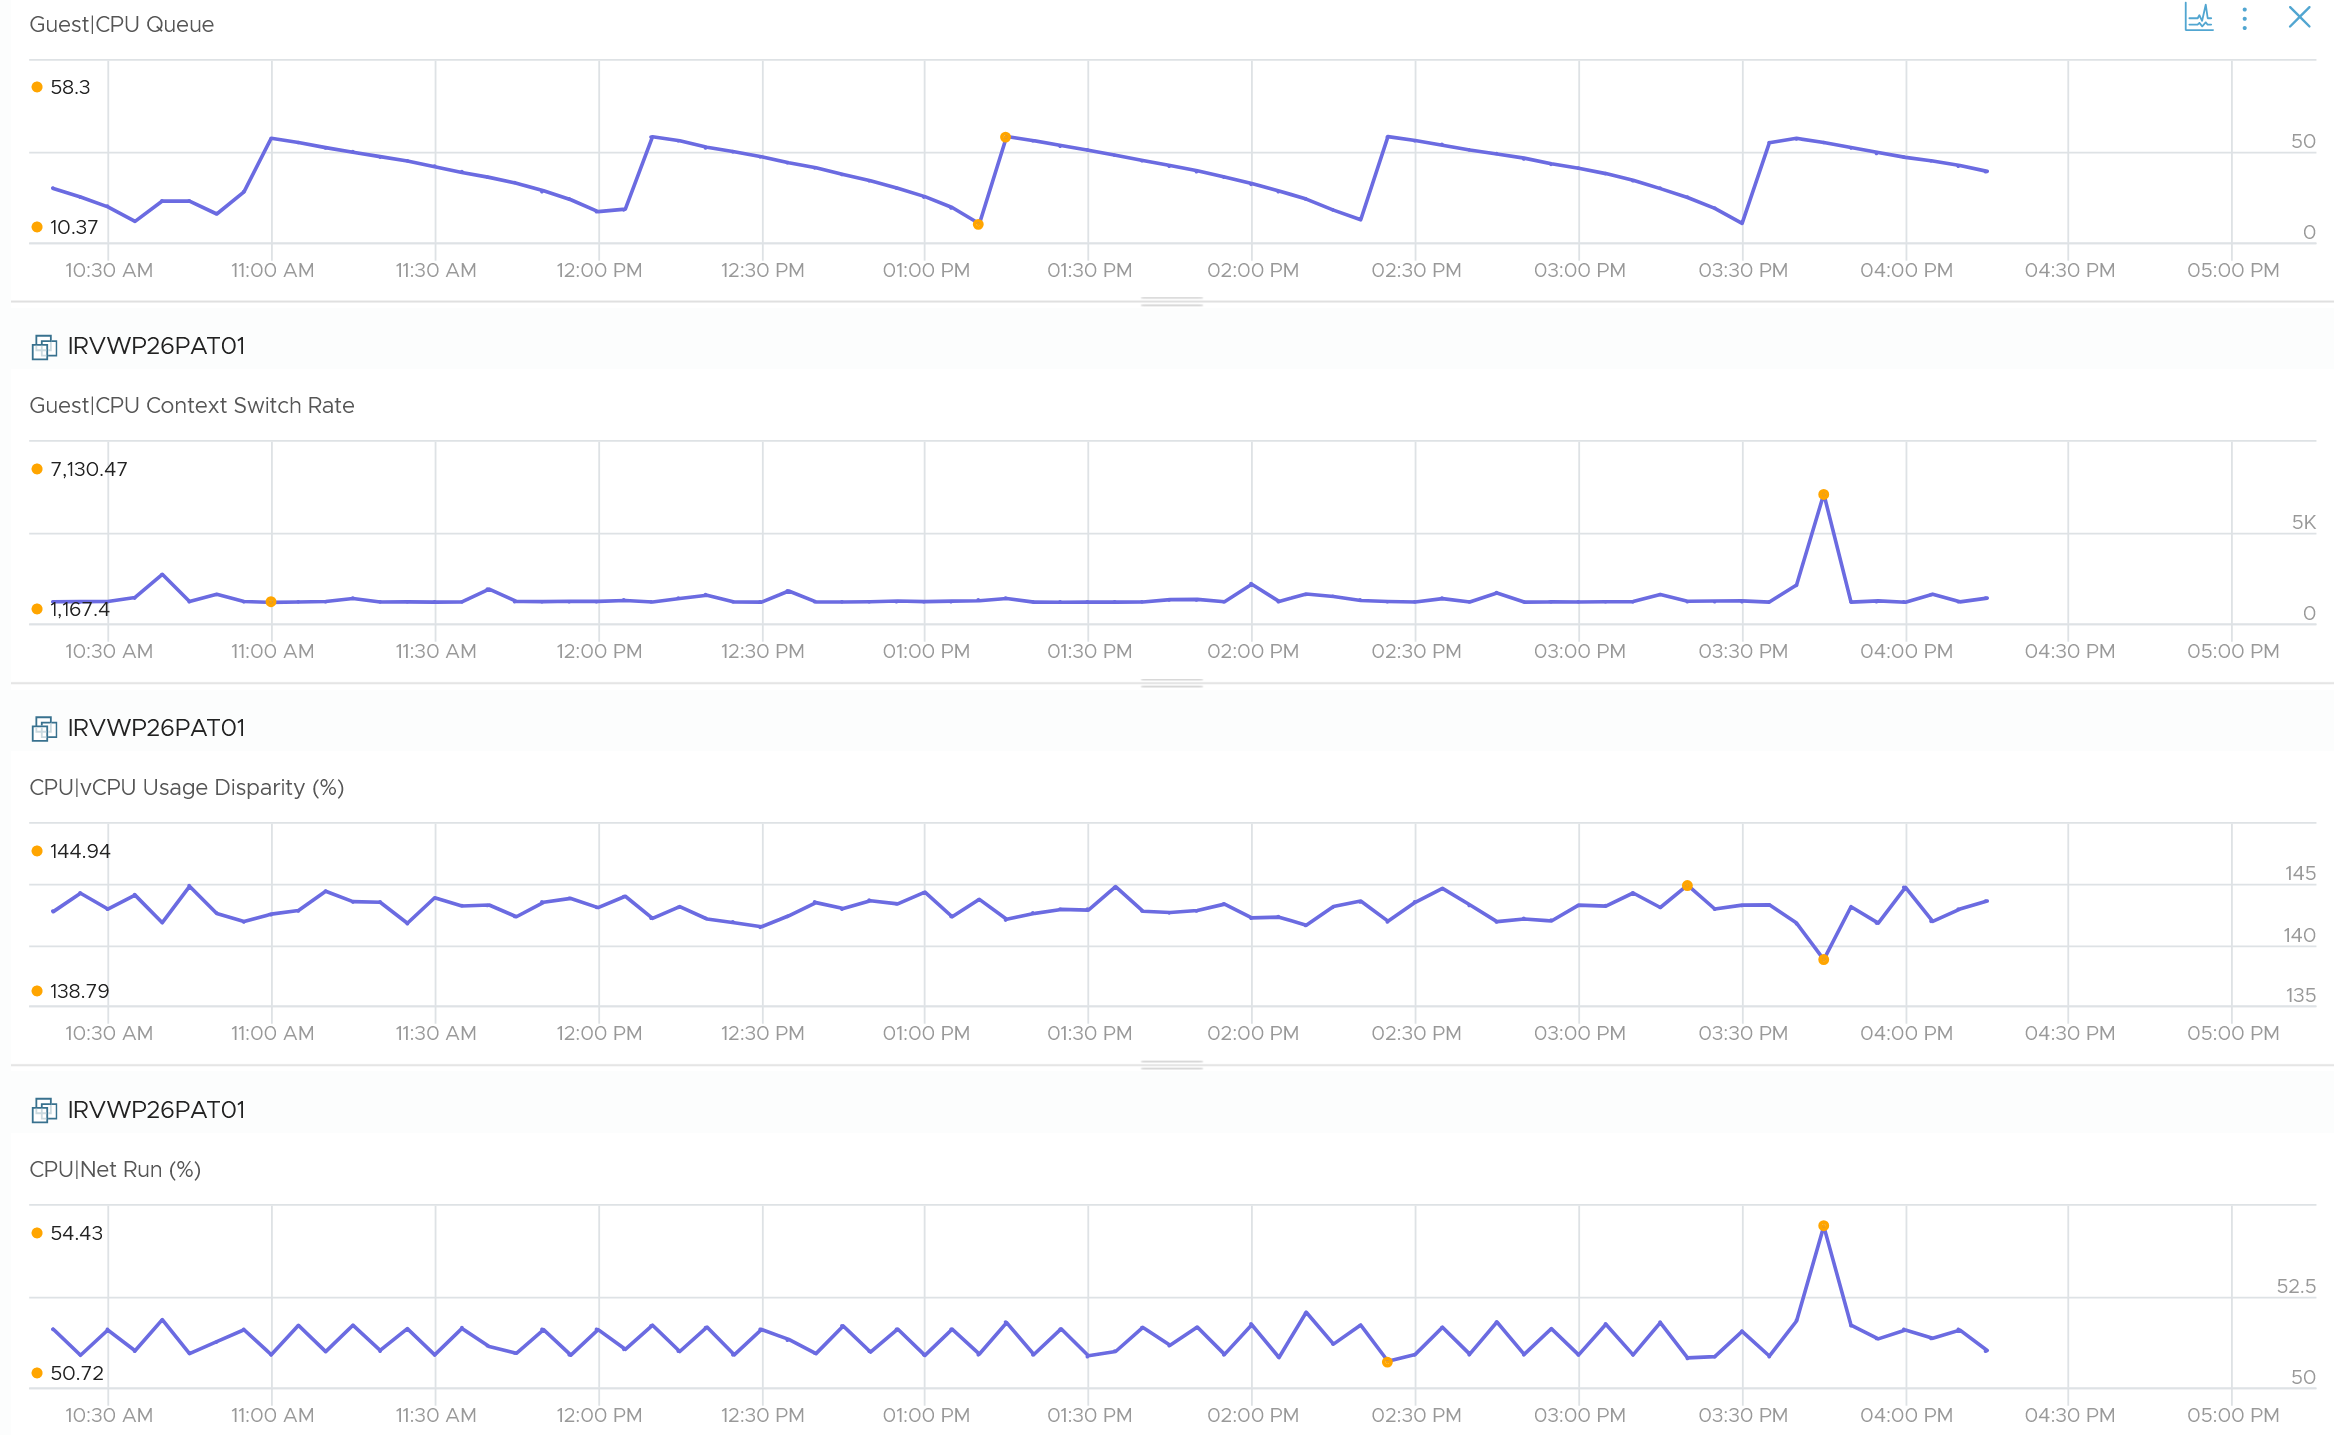
The spike on CPU Context switch does not match the CPU Queue. There is a match to CPU Run, which makes sense. CPU Usage Disparity went down, because the overall CPU Run went up.
Other things to check:
-
Is it running a multi-threaded application? Some applications spawn many threads. If yes, it’s possible that many threads are waiting for a Software Lock (like a Mutex or Semaphore). The threads in the queue cannot be distributed to those idle cores because they are all waiting for a specific resource held by a thread on a different core. They are marked as "Ready" because they aren't waiting on I/O, but they are effectively stuck in a bottlenecked pipeline.
-
If Processor% Privileged Time counter is high but User Time counter is low, the kernel (drivers/interrupts) is hogging the CPU, not the application. We have a driver or kernel-locking.
Low CPU Run
How about when Net Run (%) is low?
The following Microsoft Windows server VM has 2 vCPU only.
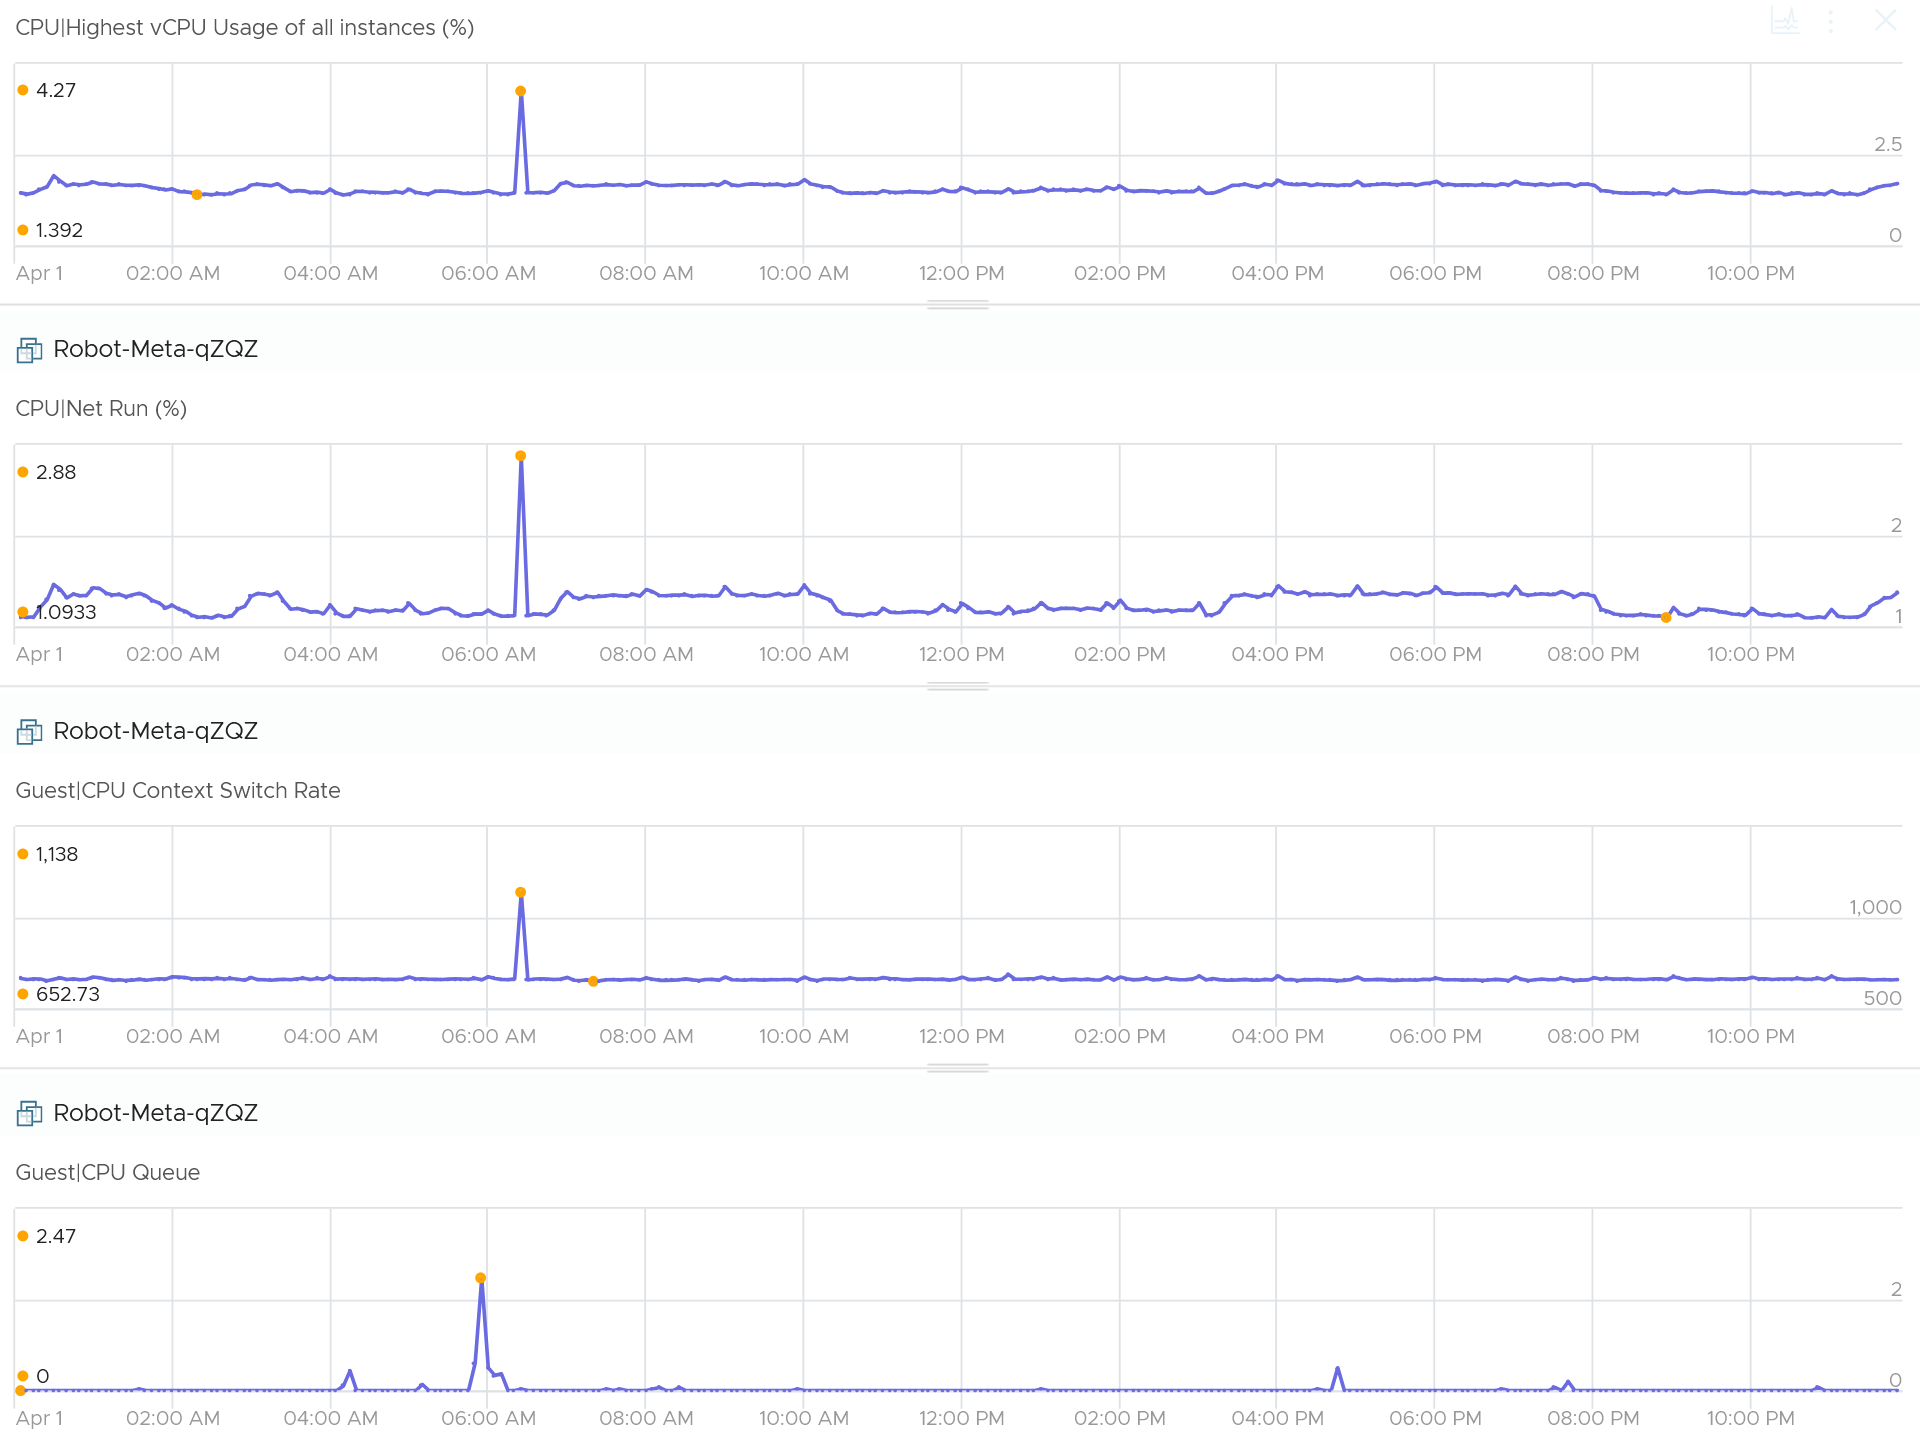
FYI:
-
CPU Ready is below 0.5%. CPU Co-Stop and CPU Other Wait are all low. This is expected as the VM is basically idle.
-
Memory contention is flat 0.
-
Virtual Disk latency is 1 ms, and did not correspond to the above 3 charts.
Queue and Idle
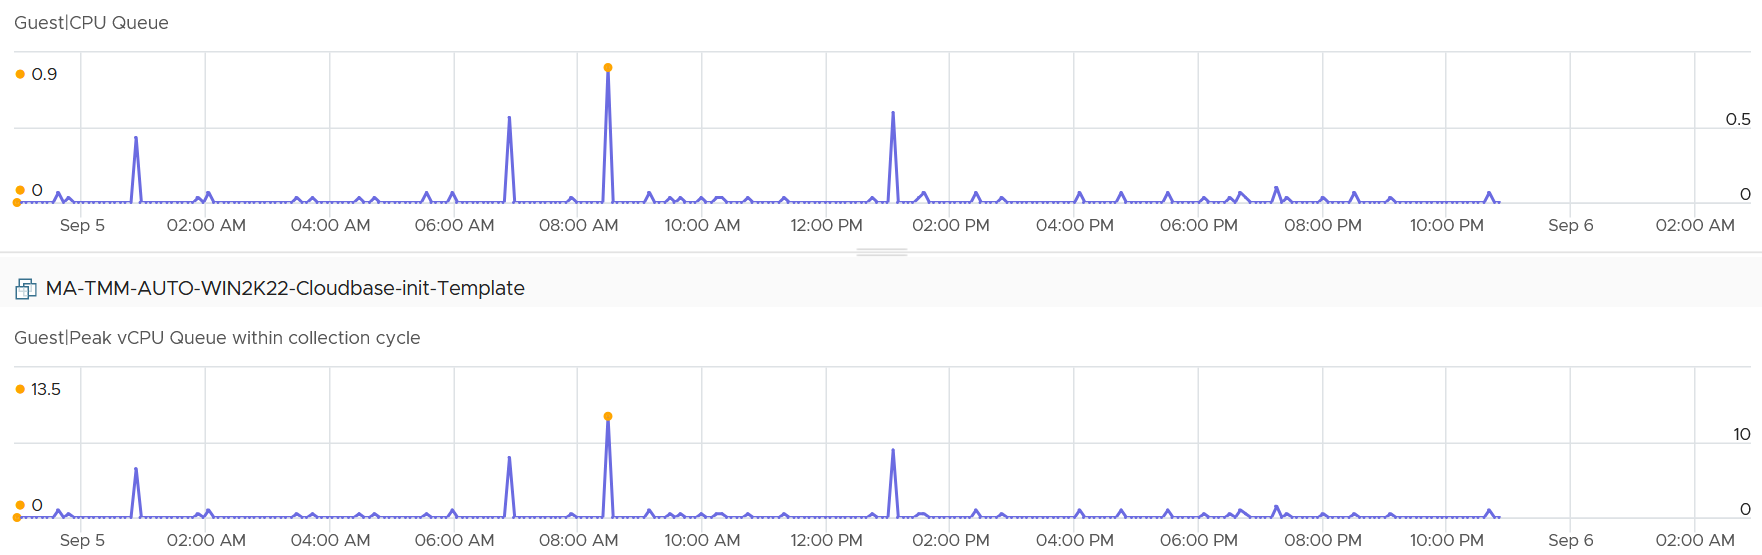
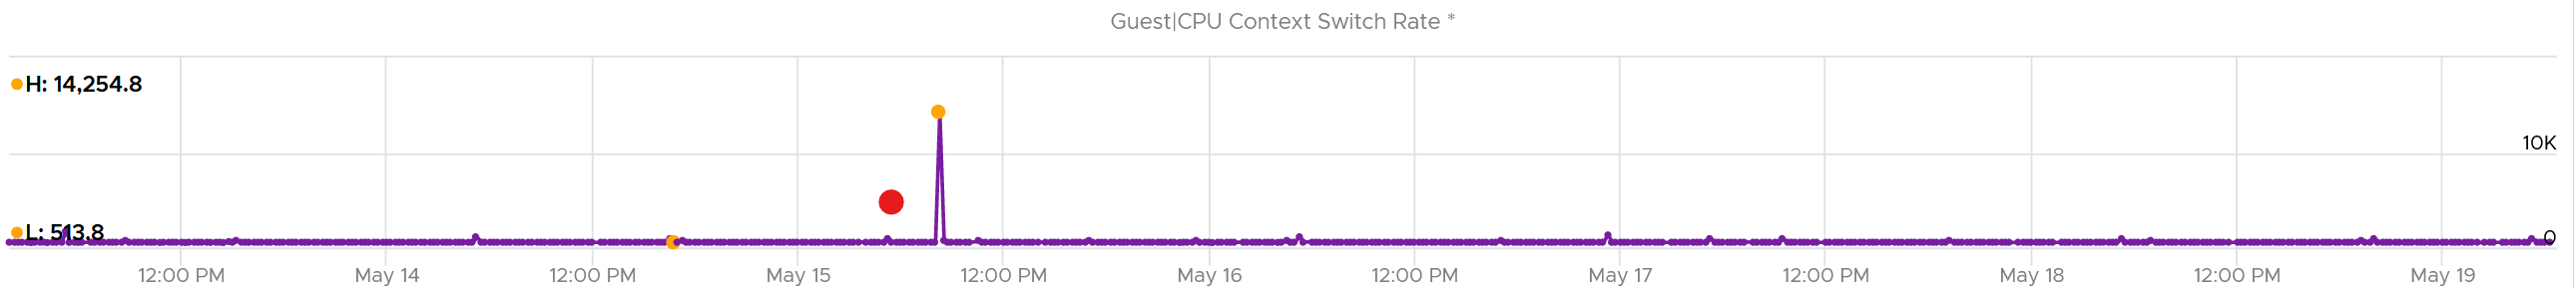
It is possible that Guest OS shows high CPU queue when it was idling. This is abnormal, indicating the application created a lot of threads. The following shows the application was idling while having high queue.
The CPU Run Queue spikes multiple times. It does not match the CPU Usage. It also did not match CPU Context Switch Rate pattern. The spike only last 20 seconds, as the 5-minute average shows identical pattern but much smaller number.
Overall Behaviour
What is the behaviour of CPU Queue?
I profiled 800 VM in the last 1 month. For each VM, I extracted the peak value and the 99th percentile value. From the following scatter chart, you can see that the value at 99th percentile is less than half. Using a spreadsheet, the average value of the 99th percentile is 34% for peak that is ≥ 3.
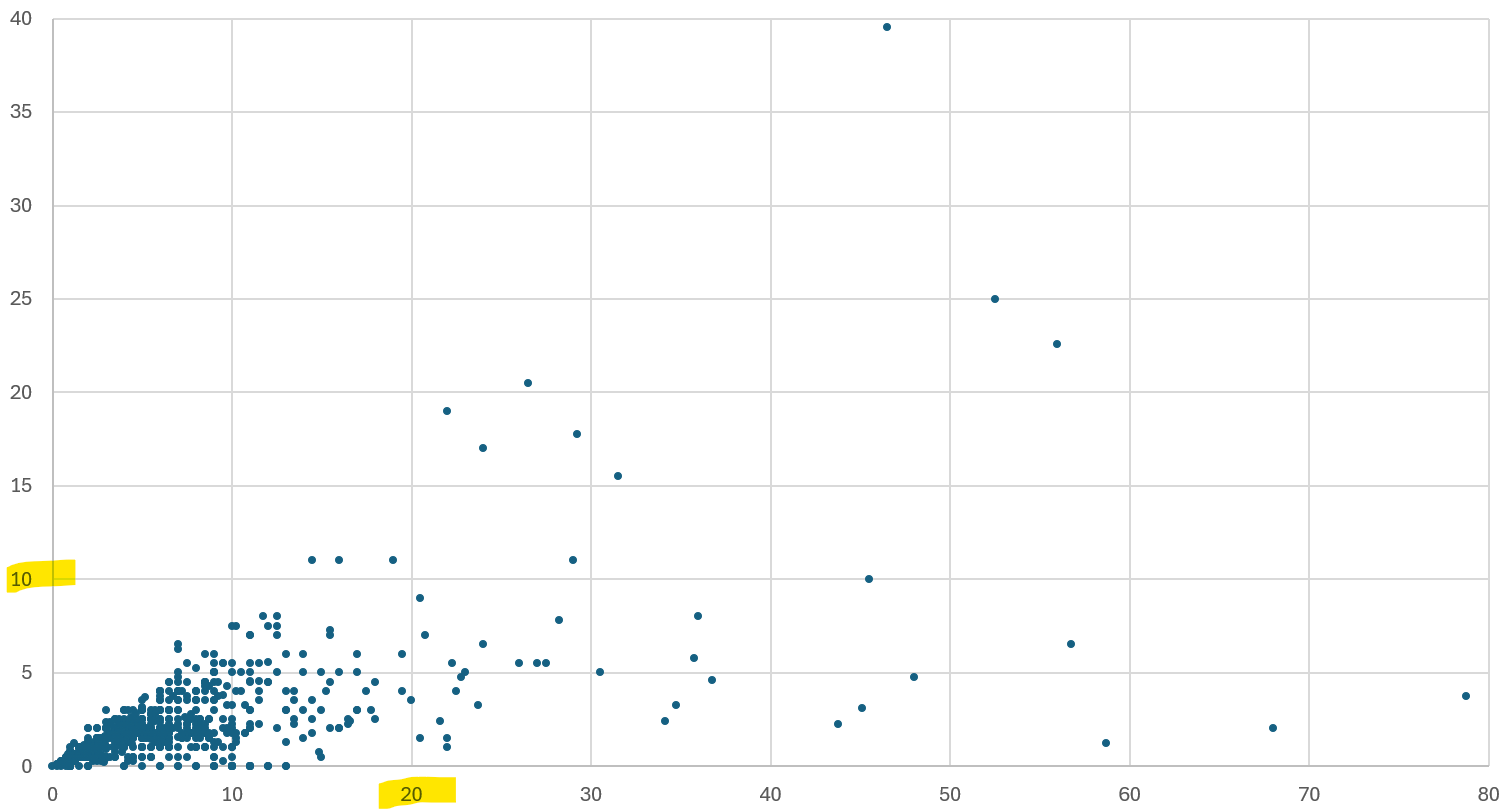
BTW, the value from Guest OS displays the last observed value only; it is not an average. Windows & Linux do not provide the highest and lowest variants either.
The counter name in Tools is guest.processor.queue. For Windows, it is based on Win32_PerfFormattedData_PerfOS_System = @#ProcessorQueueLength from WMI
Reference: Windows
I can’t find documentation that states if CPU Hyper Threading (HT) technology provides 2x the number of queue length. Logically it should as the threads are at the start of the CPU pipelines, and both threads are interspersed in the core pipeline.
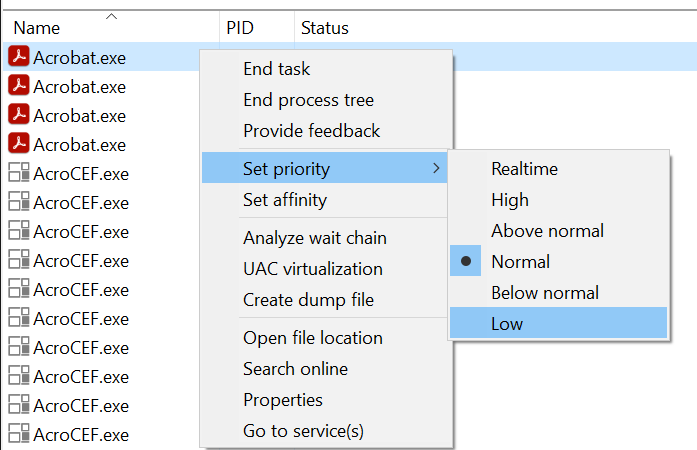
CPU Priority
If a process is often in queue, one possility is it has lower relative priority. Priority is a concept of Windows that ESXi does not have. ESXi uses a fair-share scheduler instead, as it does not have foreground processes.
Windows or Linux provides priority for foreground activities, as that’s what the user experience. For Windows, there are 6 levels as shown below. Ensure all your agents are given lower priority and limited CPU resource.
Context Switch
CPU Context Switch costs performance “due to running the task scheduler, TLB flushes, and indirectly due to sharing the CPU cache between multiple tasks”. It’s important to track this counter and at least know what’s an acceptable behaviour for that specific application.
Context switches are considered “expensive” operations, as the CPU can complete many instructions within the time taken to switch context from one process to another. A sustained high number degrade performance noticeably through "cache pollution" — where the CPU has to constantly reload data into L1/L2 caches because the previous thread was swapped out.
For further reading, read this paper.
Based on Windows 10 Performance Monitor documentation, context switches/sec is the combined rate at which all processors on the computer are switched from one thread to another. All else being equal, the more the processors, the higher the context switch. Note that thread switches can occur either inside of a single multi-thread process or across processes. A thread switch can be caused either by one thread asking another for information, or by a thread being pre-empted by another, higher priority thread becoming ready to run.
Here is my take:
| | 2K – 4K per processor |
|-----|-----------------------|
| | 4K – 8K per processor |
| | > 8K per processor |
There are context switch metrics on the System and Thread objects. VCF Operations only report the total.
The rate of Windows or Linux switching CPU context per second ranges widely. The following is taken from a Windows 10 desktop with 8 physical threads, which runs around 10% CPU. I observe the value hovers from 10K to 50K.
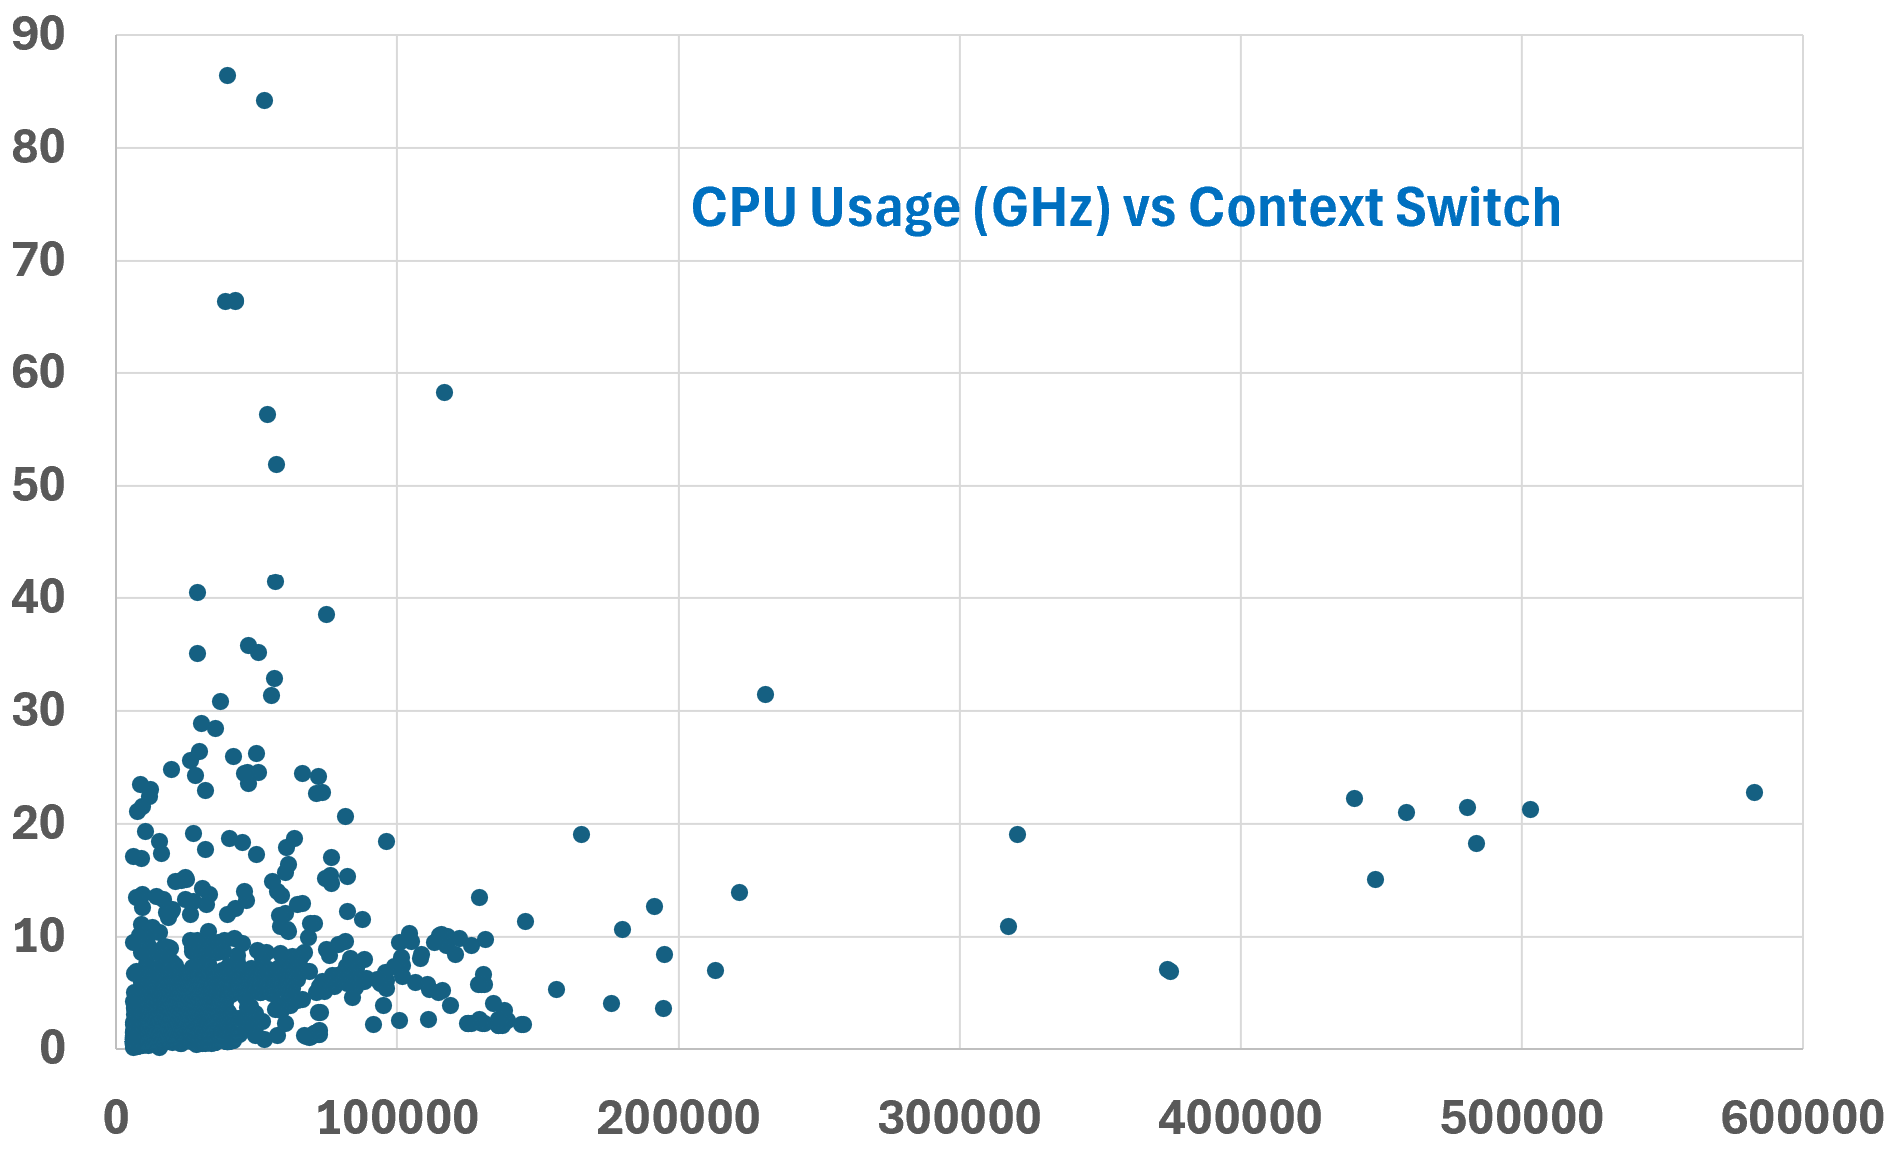
Correlation
The value does not correlate well with CPU “utilization”, because not all CPU instructions require context switching. Overall, the higher the utilization the higher the chance of CPU context switch. I plotted 3328 VM on a scatter chart.
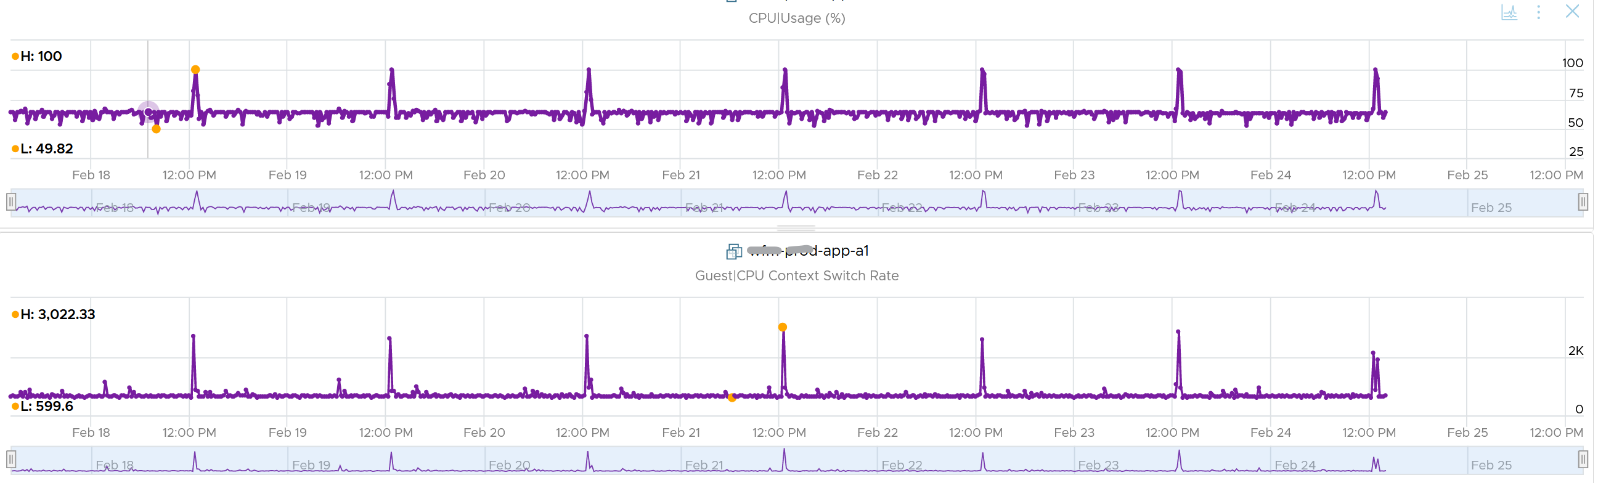
The above does not mean there is no correlation. The following chart shows a near perfect corelation. Every time CPU Usage went up, CPU Context Switch also. I should have plotted the disk IO or network IO as IO operations tend to require context switch.
CPU context switch can happen even in a single thread application. The following shows a VDI VM with 4 vCPU. I plotted the CPU Usage Disparity vs CPU Context Switch. You can see the usage disparity went up to 78%, meaning the gap between the busiest vCPU and the idlest vCPU is 78%. This was running a security agent, which is unlikely to be designed to occupy multiple vCPU.
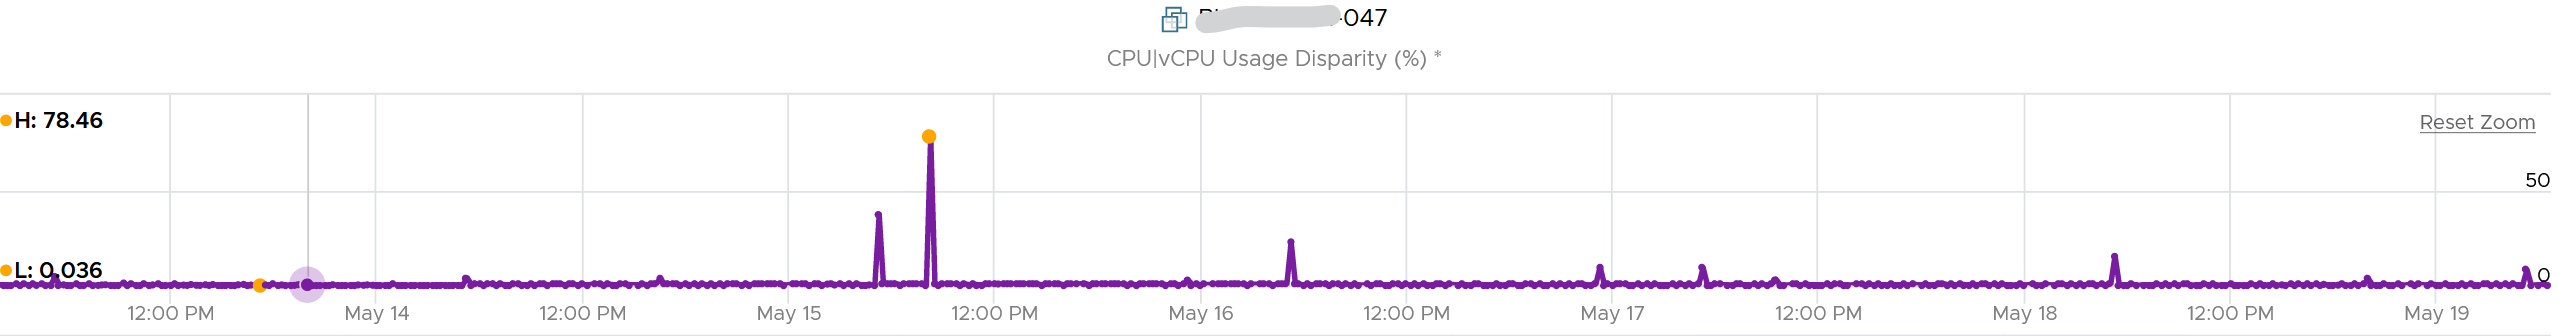
Let’s plot the context switch at the same period. There is a spike at the same time, indicating that the agent was busy context switching. Note that it does not always have to be this way. The red dot shows there is no spike in context switch even though the vCPU Usage Disparity went up.
Range Analysis
The values of CPU Context Switch vary widely. For many VM, the values will be in low hundreds. In extreme situation, it can sustain well beyond 10 millions, as shown in the preceding chart. The above VM was not doing heavy IOPS nor high CPU usage. There was no correlation with these 2 metrics either.
Because of above, it’s important to profile and establish a normal base line for that specific application. What is healthy for 1 VM may not be healthy for another.
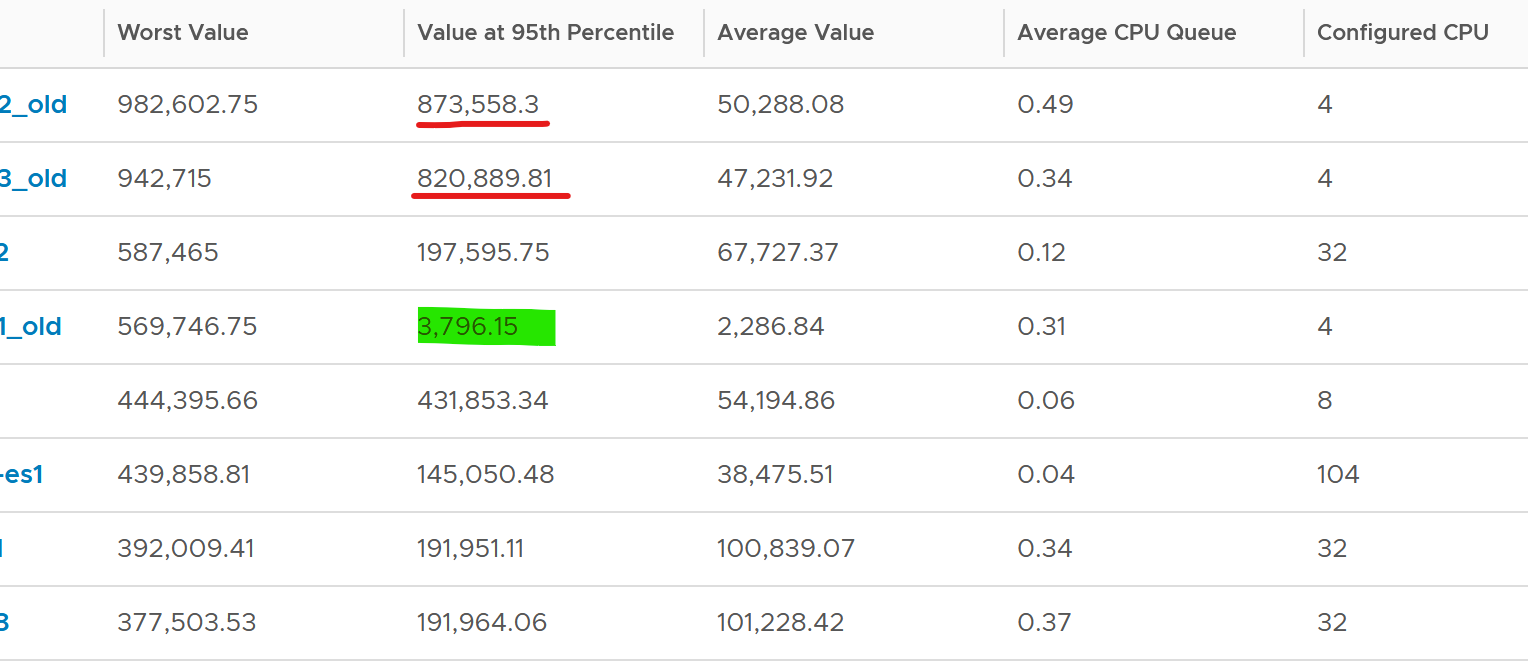
You can see from the table that some VM experience prolonged CPU context switch, while others do not. The VM #4 only has a short burst as the value at worst 5th percentile dropped to 3796. Momentary peak of context switch may not cause performance problem so in general it’s wiser to take the value somewhere between 95th and 99th percentile.
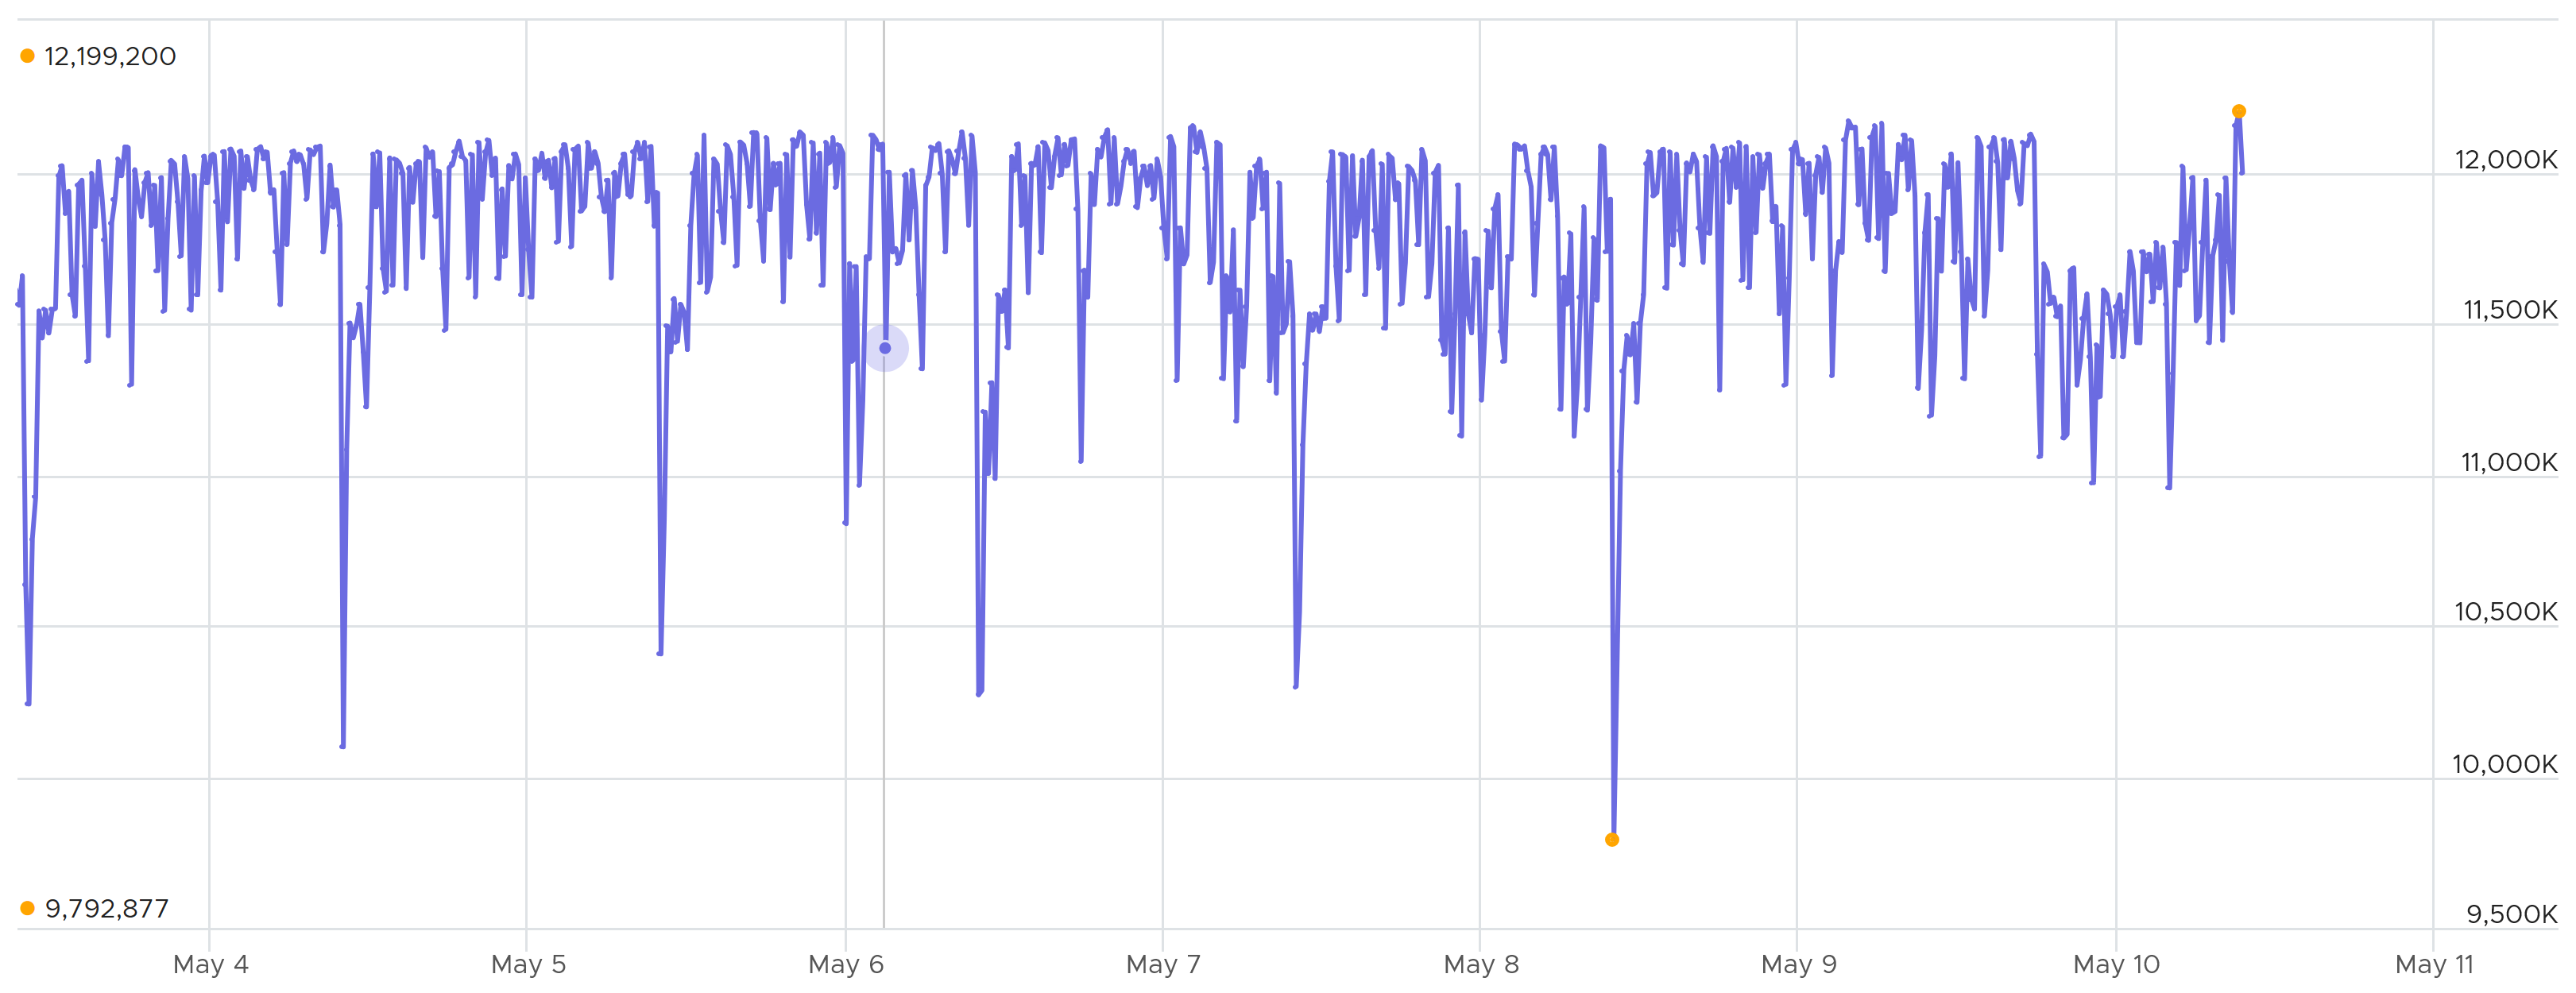
Let’s drill down to see the first VM. This CentOS VM sporting only 4 vCPU constantly hit almost 1 million context switches. The pattern match CPU Usage.
Do you add more CPU?
You should not, as the queue remain manageable. Check what the queue like on a more granular reading.
The following distribution chart shows the values from 11372 VMs. I had to use log-10 scale as the values vary wildly.
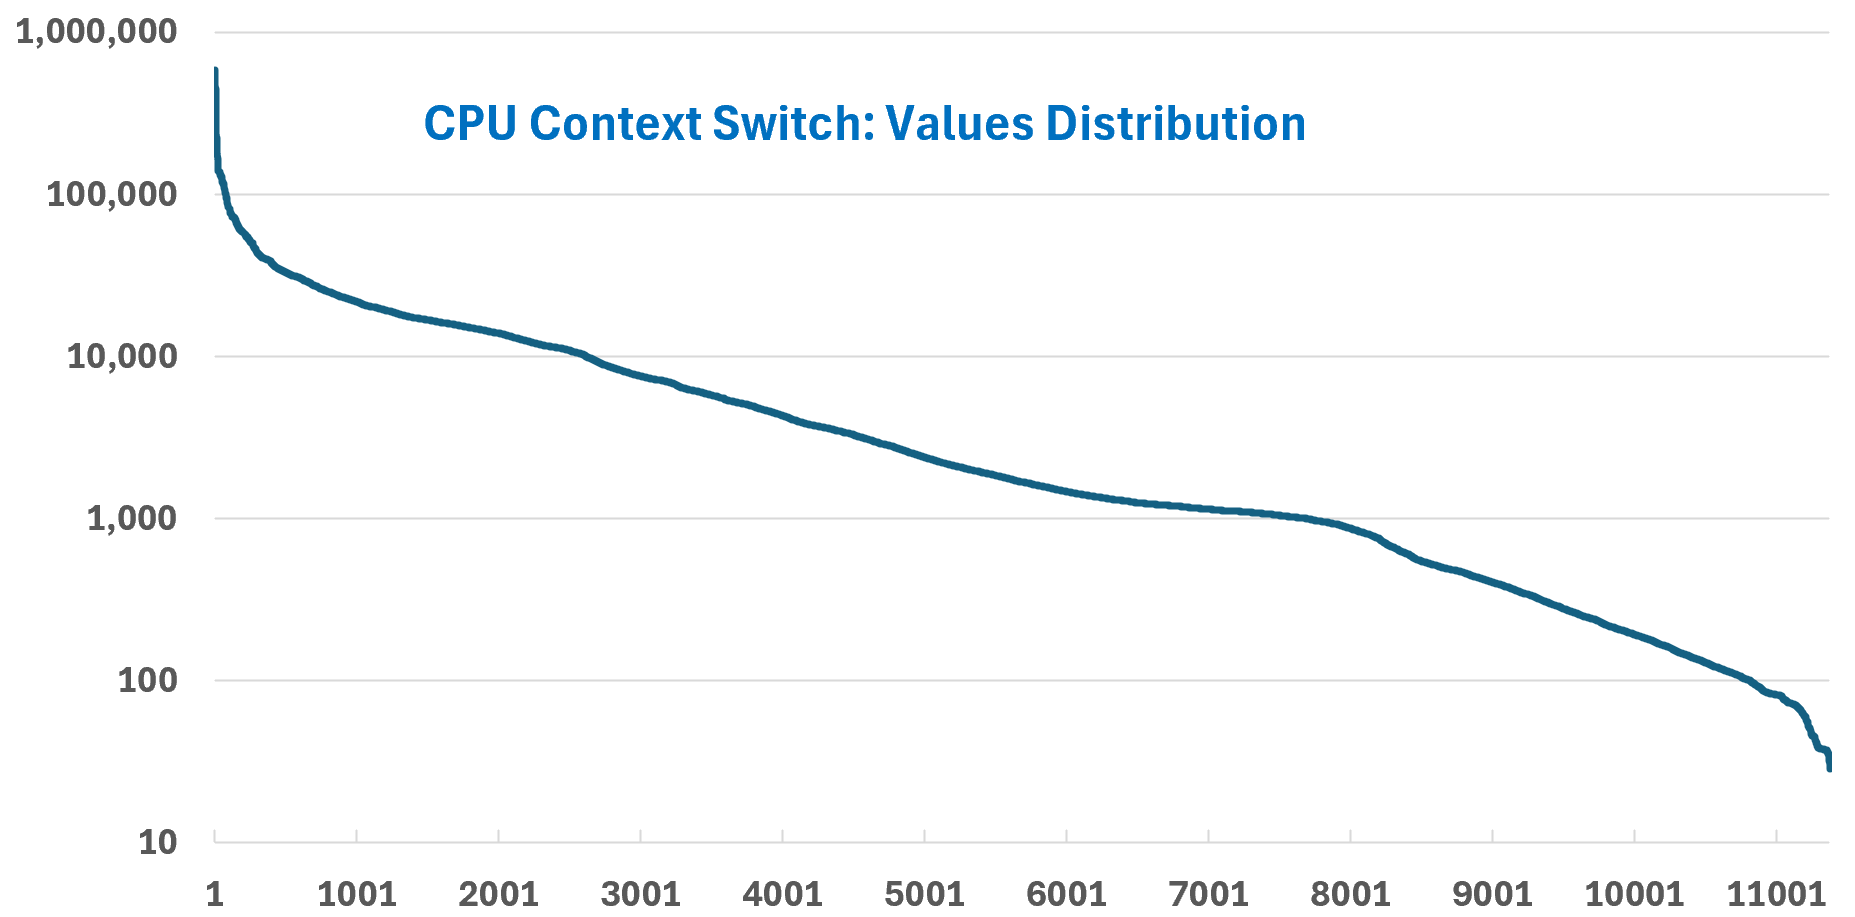
Majority of Guest OS spends well below 10K. You can see that the values between 0 – 10000 accounts for 80%.
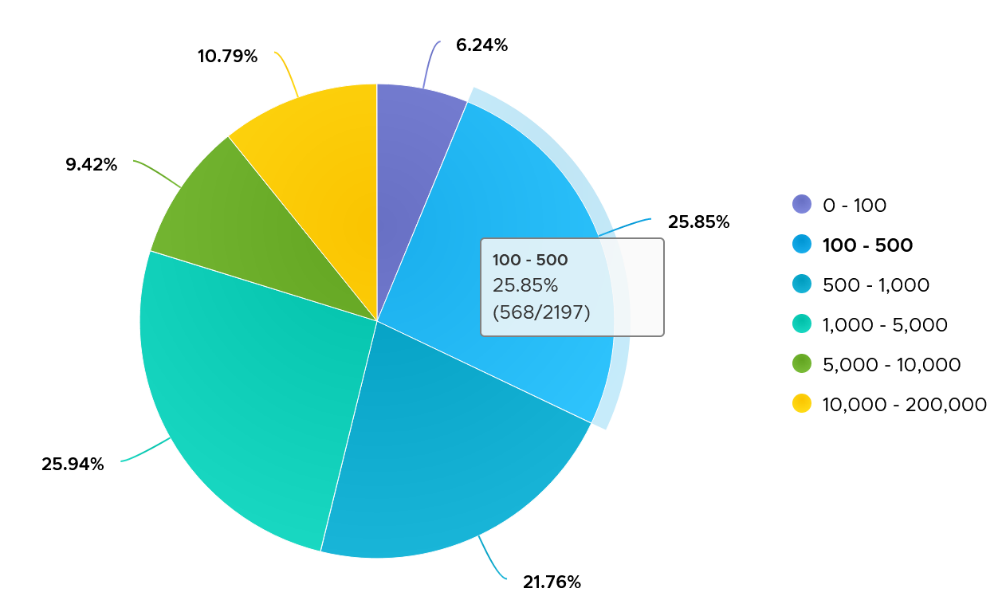
Now that you know the wide distribution, you can use buckets. Adjust the bucket size by grouping all the values above 10K as one bucket, and splitting 0 – 10K bucket into multiple buckets. You can see more than half has < 1000 CPU Context Switch Rate.
Thread Ping Pong
The following is a Windows Server 2019 DC edition VM with 10 vCPU. It’s basically idle, as you can see below.
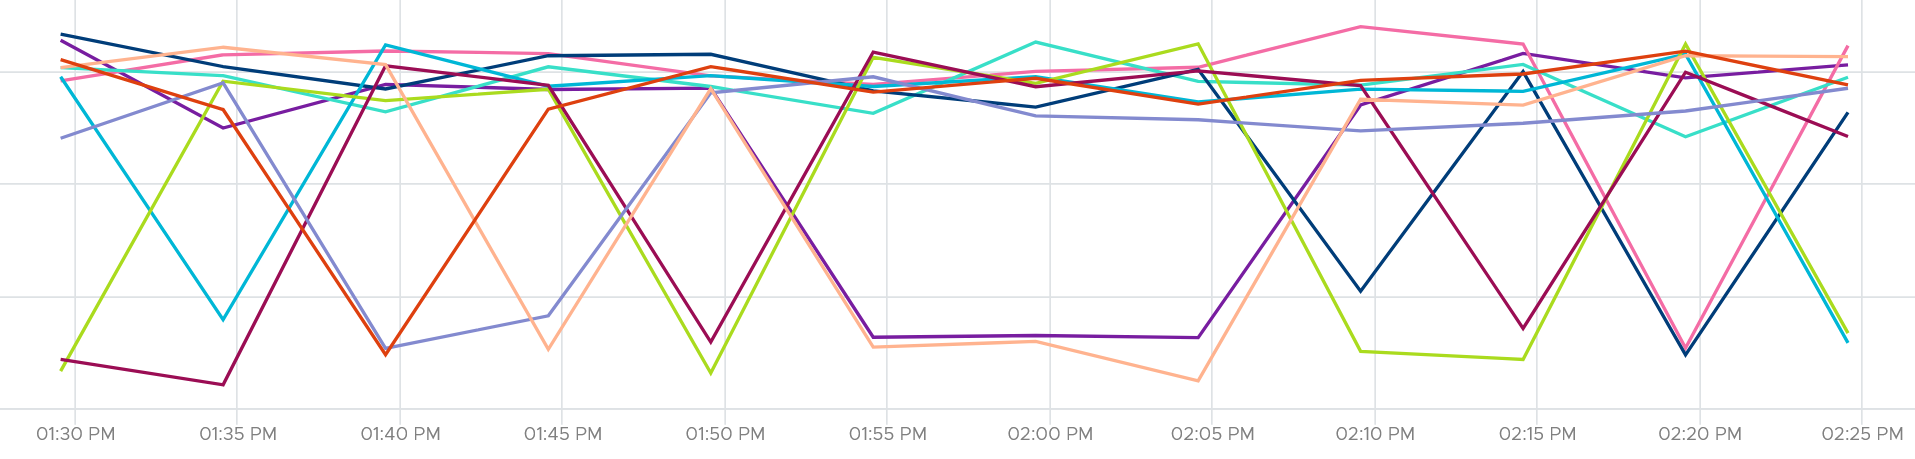
But if we zoom into each vCPU, they are taking turn to be busy.
In the span of just 1 hour, the 10 vCPU inside Windows take turn.
This is a bit illogical. Is this a process ping pong?
It is hard to tell
We can see them clearer if we stack them up. Notice they take turn, except the 3rd one from the top (I drew a green line on it). That one is actually fairly stable.
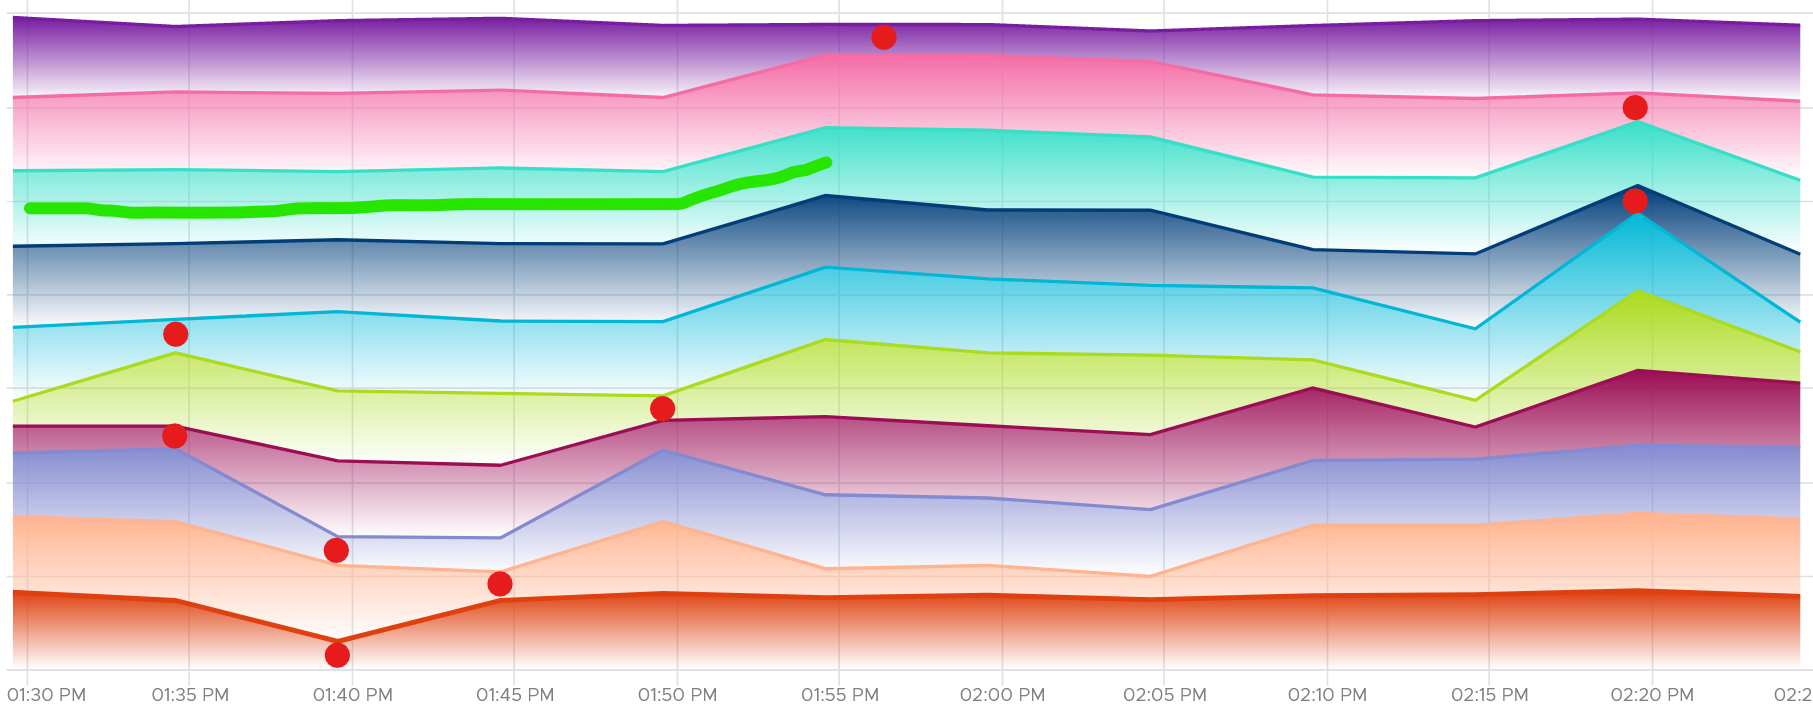
It is running Horizon Connection Server. It has around 118 – 125 processes, but much higher threads counts.
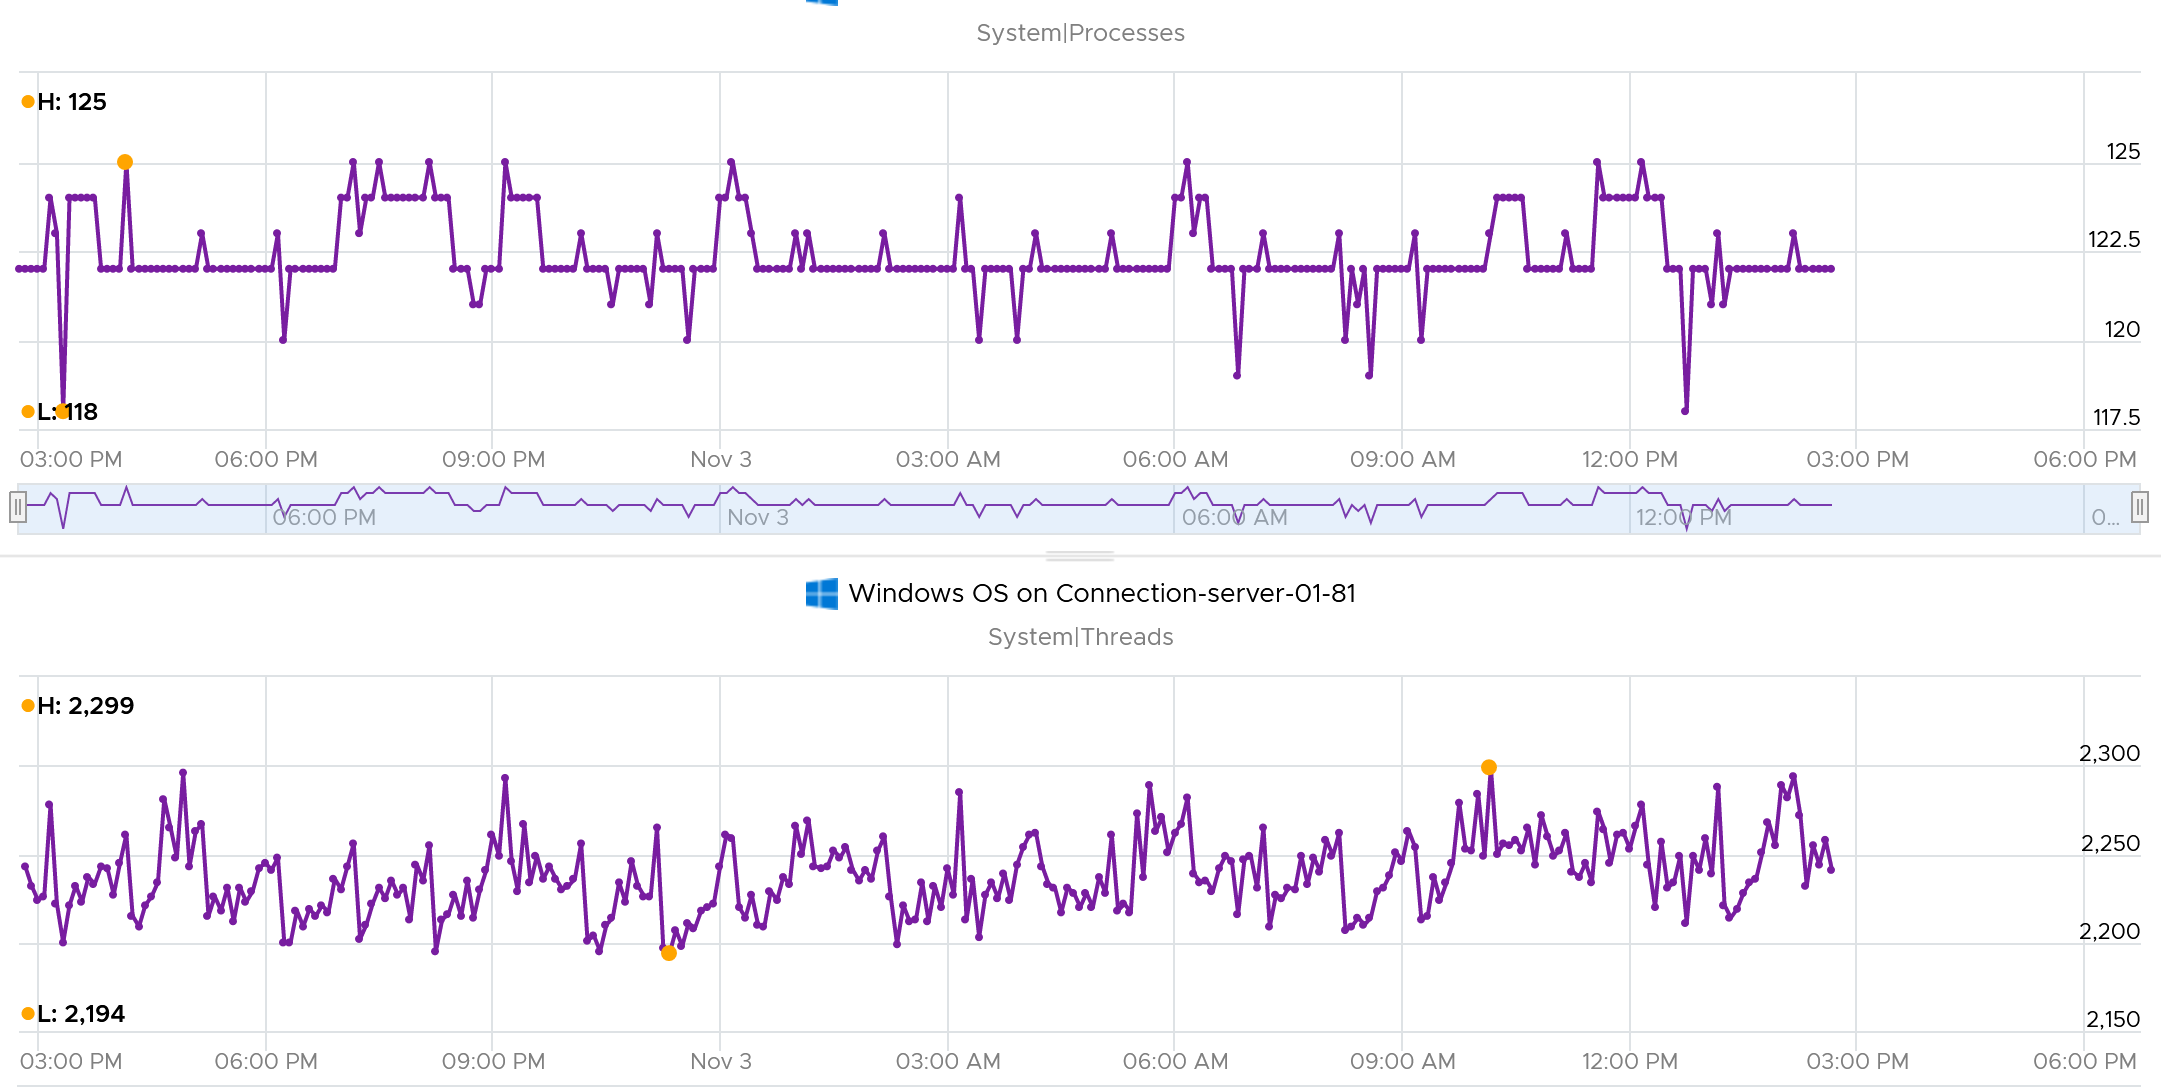
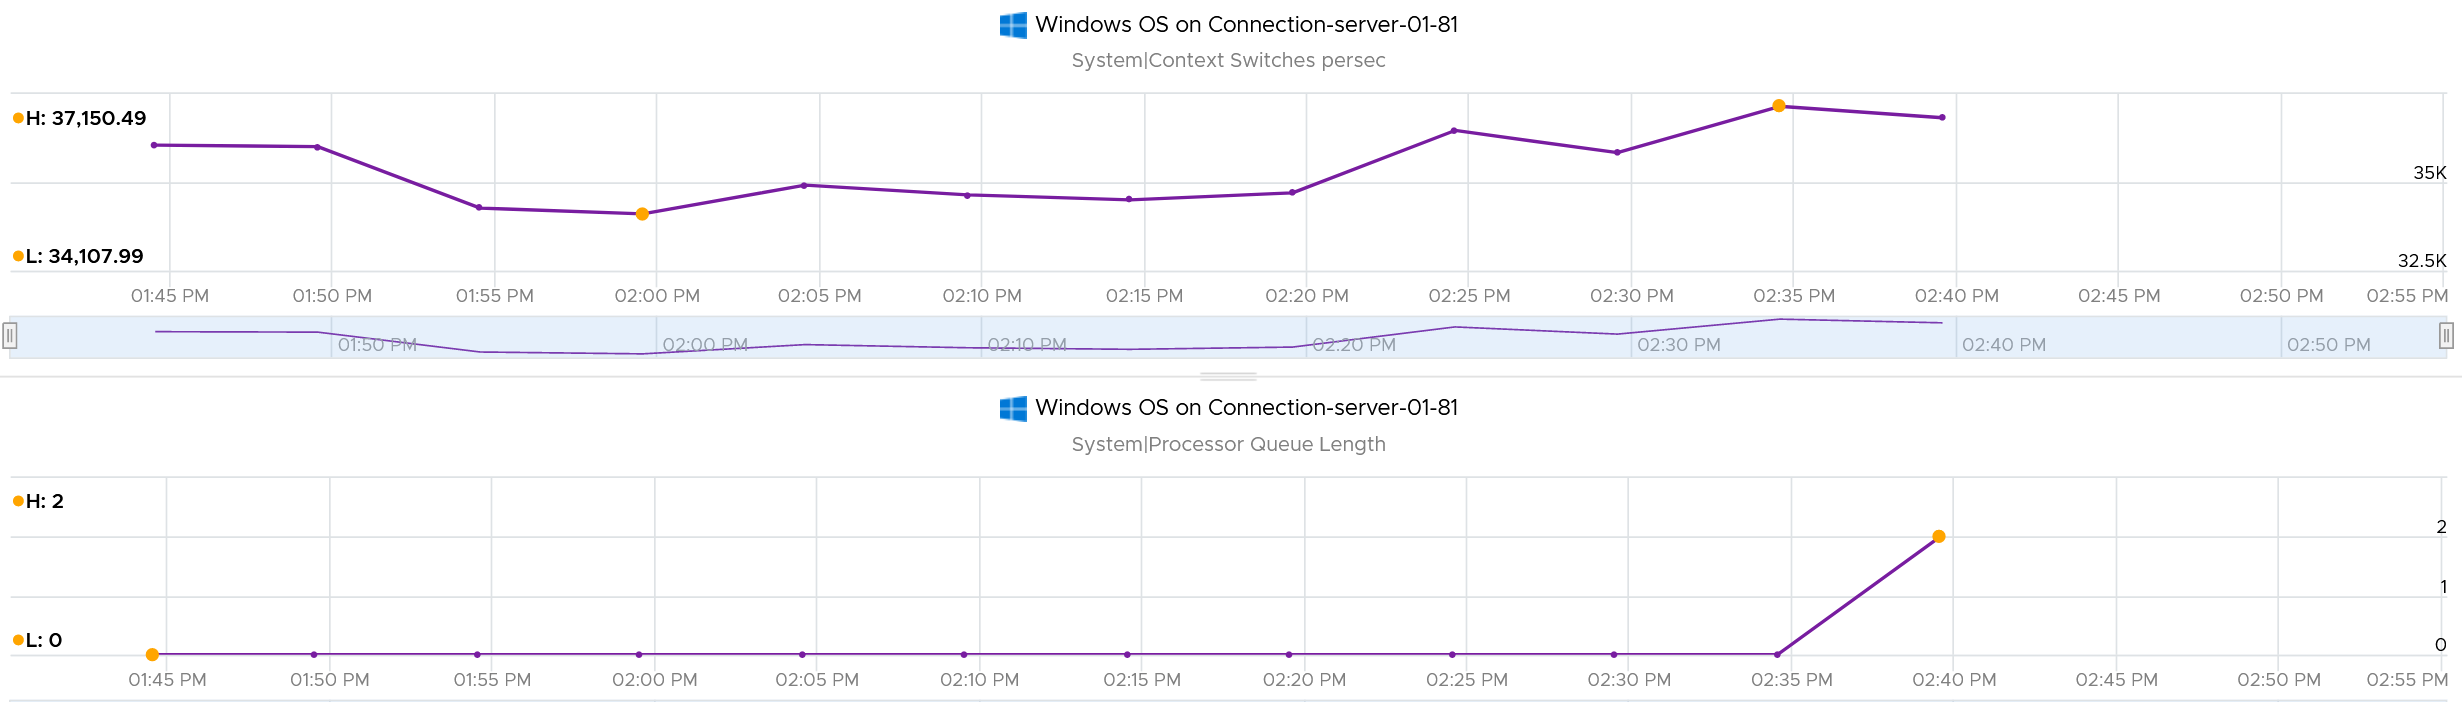
CPU Run Queue is very low, which is expected as the system is basically idle.
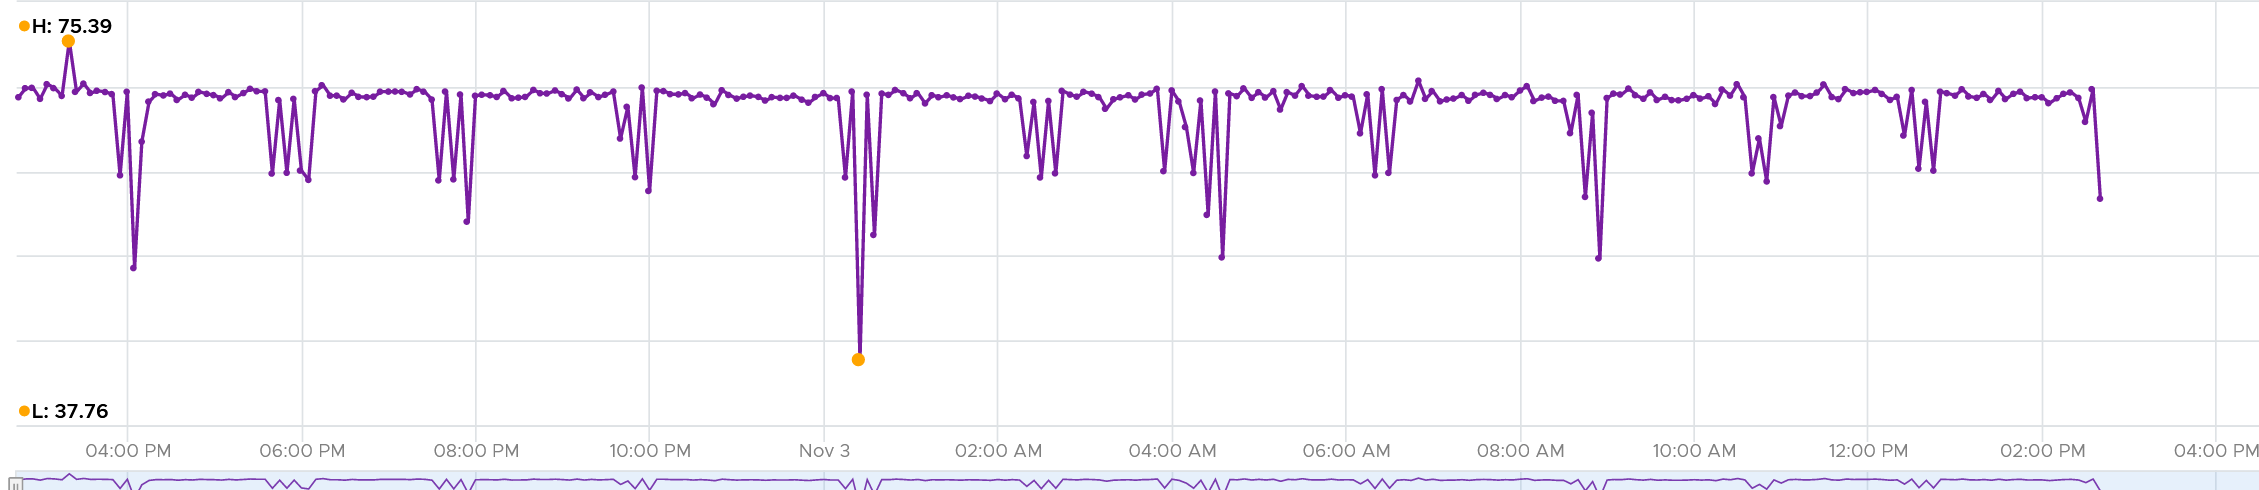
Context switches is fairly steady. The following screenshot shows it hovers between 34K and 37K switches per second. This is expected as it consistently run >2K threads on >100 processes on just 10 CPU. Each CPU does ~3.5K switches per second.
DPC Time
According to System Center wiki, the system calls are deferred as they are lower priority than standard interrupts. A high percentage of deferral means Windows was busy doing higher priority requests.
They can happen even during low CPU utilization if there is issue with driver or application. The following screenshot is taken on Performance Monitor in Windows 11 laptop which was not running high. Notice the DPC time for CPU 0 is consistently higher than CPU 15, indicating imbalance. It did exceed >5% briefly. My Dell laptop has 8 cores 16 threads.
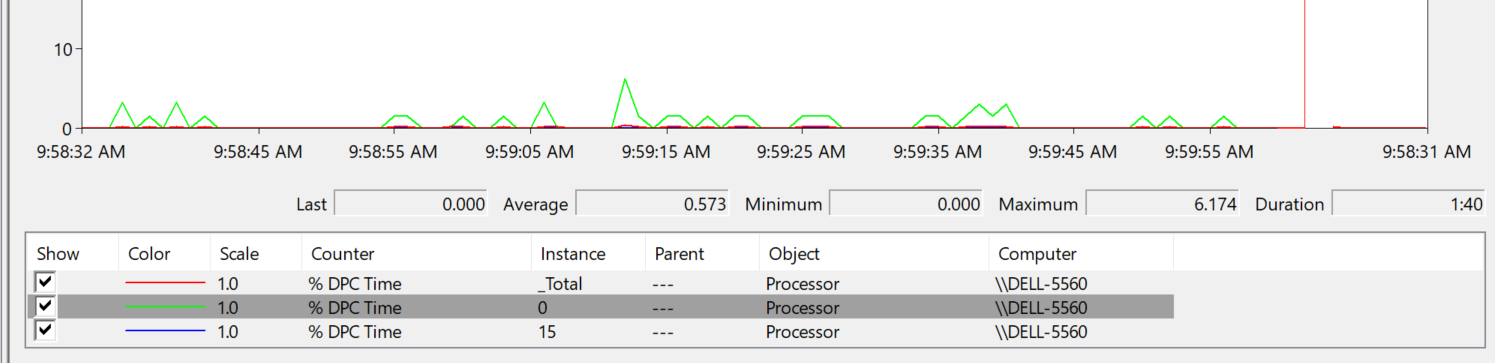
Set the graph scale to 1 for ease of reading, and change the axis scale accordingly.
Runaway Process
What do you see from the CPU charts below?
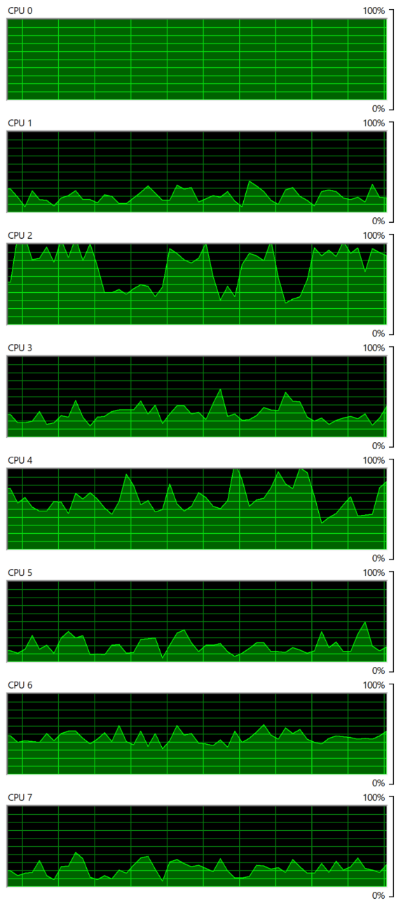 | There are 8 CPU as seen by Windows 10. Hint: look at the total picture, no need to see each in detail. That’s why I made the screenshot tiny. Yes, you’re right. CPU0 is running flat. The reason was one of Windows common service went into infinite loop. Ironically, this is the troubleshooting service (Diagnostic Policy Service) itself. So it’s chewing up CPU flat out non-stop. But since there are 7 other CPU, Windows overall is responsive. I could still do my work. A counter that tracks at entire Guest OS level will not capture it. You need to complement it with a counter that tracks the highest among its CPU. If this is flat out all the time, you likely have a runaway process. |
|---|
Usage | Utilization | Time
The 3 tools in Windows use different names to measure CPU consumption:
-
Performance Monitor uses the name Processor Time.
-
Task Manager uses the name CPU Utilization.
-
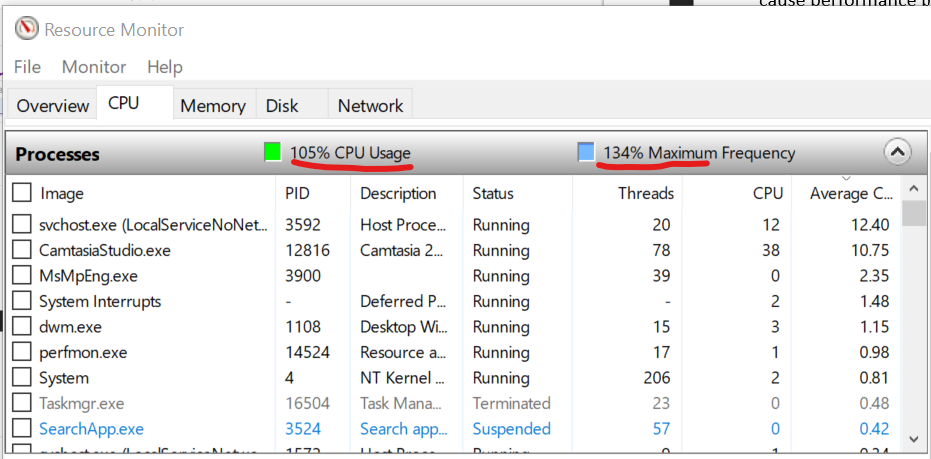
Resource Monitor uses the name CPU Usage.
Looking at the values, they are not measuring the same thing. The following screenshot is a side-by-side comparison between Task Manager and Resource Monitor.
Let’s compare Performance Monitor and Task Manager:
CPU Usage in Windows is not aware of the underlying hypervisor hyper-threading. When Windows run a CPU at 100% flat, that CPU could be competing with another physical thread at ESXi level. In that case, what do you expect the value of VM CPU Usage will be, all else being equal?
62.5%.
Because that’s the hyper-threading effect.
What about VM CPU Demand? It will show 100% .
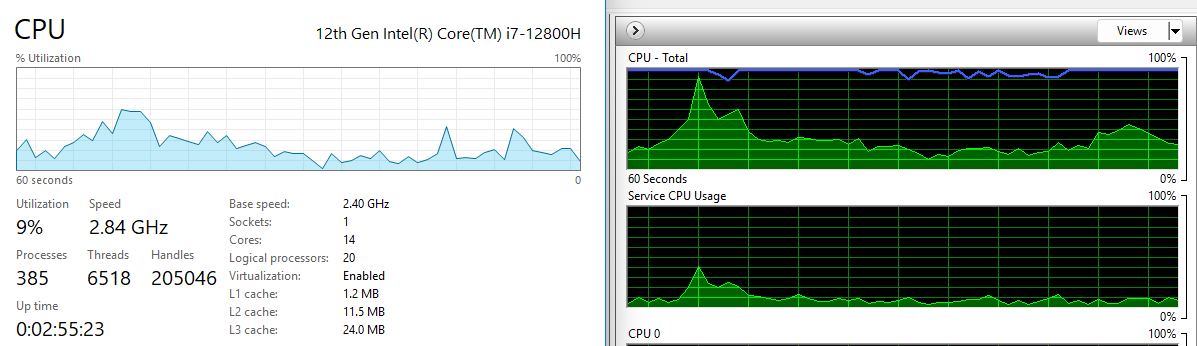
However, CPU Usage is affected by power management. Windows 8 and later will report CPU usage >100% in Task Manager and Performance Monitor when the CPU Frequency is higher than nominal speed. The reason for the change is the same with what we have covered so far, which is the need to distinguish amount of work being done. More here.
BTW, what does the Maximum Frequency mean?
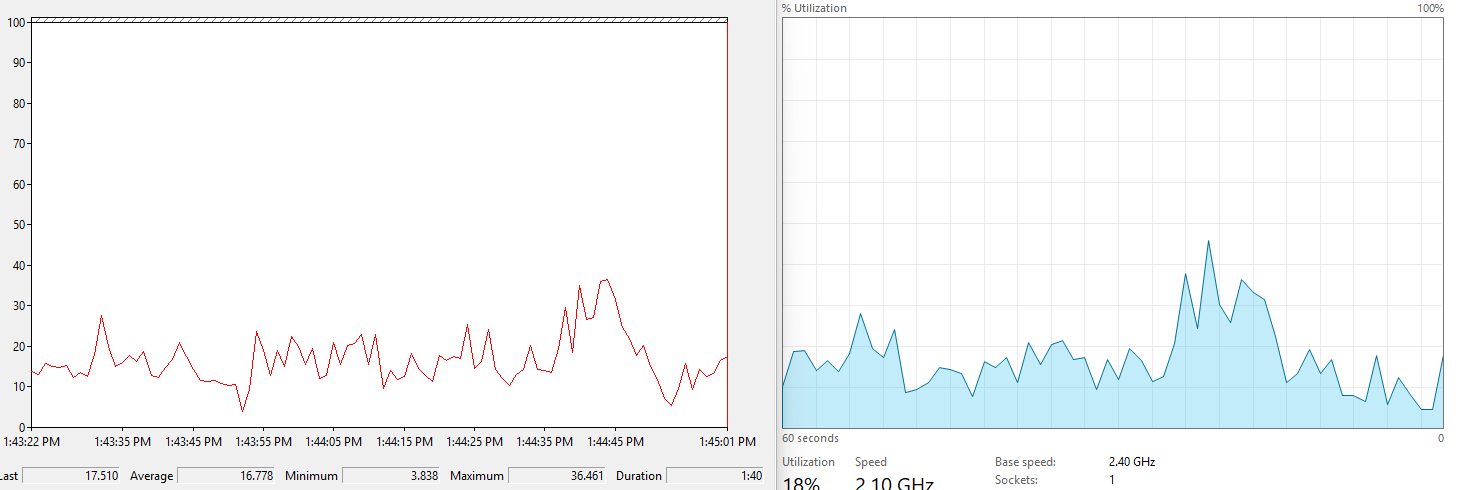
Let’s show an opposite scenario, where CPU Usage (%) is low.
The number means the speed it’s running relative to the nominal frequency. During low utilization, Windows will conserve power by lowering the speed.
In the first screenshot, since it’s running at 134% of the clock speed, the total time exceeded 105%, meaning there were time it did not run. Had it run all the time, it would report 134% instead.
In the first screenshot, it could be running more than 8% of the time. But since it’s only running at 69% of the speed, the CPU productive cycle completed is only 8%. The througput was degraded.
What happens to CPU Usage when VM is experiencing contention? VM Contention = Ready, Co-Stop, Overlap, Other Wait.
Time basically stops. So there is a gap in the system time of Windows. How does it deal with the gap? Does it ignore the gap, or artificially fills it with best guess values? I’m not sure. If you do let me know.
The above nature of CPU Usage brings an interesting question. Which VM counters can be used when you have no visibility into the Guest? Let’s do a comparison:
| Metric | Frequency Scaling | Hyperthreading | VM Contention |
|-----------------|:-----------------:|:--------------:|:-------------:|
| Guest CPU Usage | Yes | No | No |
| VM CPU Run | No | Yes | No |
| VM CPU Usage | Yes | Yes | No |
| VM CPU Demand | Yes | No | Yes |
If there is slowness but utilization is low, it’s worth checking if the utilization is coming from lower power state. This is important for application that requires high frequency (as opposed to just lots of light threads).
Windows provides the time the CPU spent on C1, C2 and C3 state. The following is taken from my laptop. Notice a dip when the total of C1 + C2 + C3 < 100%. That’s basically the time on C0.
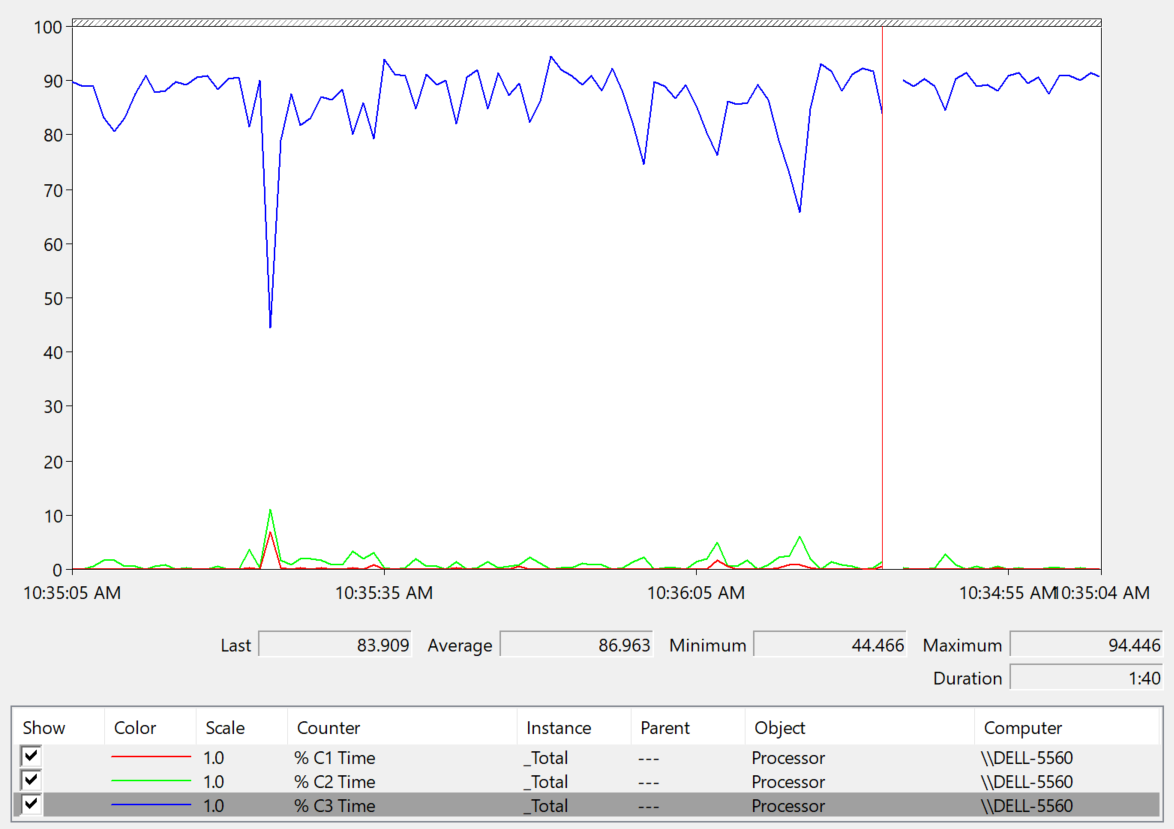
The Idle loop is typically executed on C3. Try plotting the Idle Time (%) and C3 Time (%), and they will be similar.
OS vs Process
CPU imbalance can happen in large VM.
Review the following chart carefully. It’s my physical desktop running Windows 10. The CPU has 1 socket 4 cores 8 threads, so Windows see 8 logical processors. You can see that Microsoft Word is not responding as its window is greyed out. The Task Manager confirms that by showing that none of the 3 documents are responding. Word is also consuming a very high power, as shown in the power usage column.
It became unresponsive because I turned on change tracking on a 500 page document and deleted hundreds of pages. It had to do a lot of processing and it did not like that. Unfortunately I wasn’t able to reproduce the issue after that.
At the operating system, Windows is responding well. I was able to close all other applications, and launched Task Manager and Snip programs. I suspect because Word does not consume all CPUs. So if we track at Windows level, we would not be aware that there is a problem. This is why process-level monitoring is important if you want to monitor the application. Specific to hang state, we should monitor the state and not simply the CPU consumption.
From the Windows task bar, other than Microsoft Word and Task Manager, there is no other applications running. Can you guess why the CPU utilization at Windows level is higher than the sum of its processes? Why Windows show 57% while Word shows 18.9%?
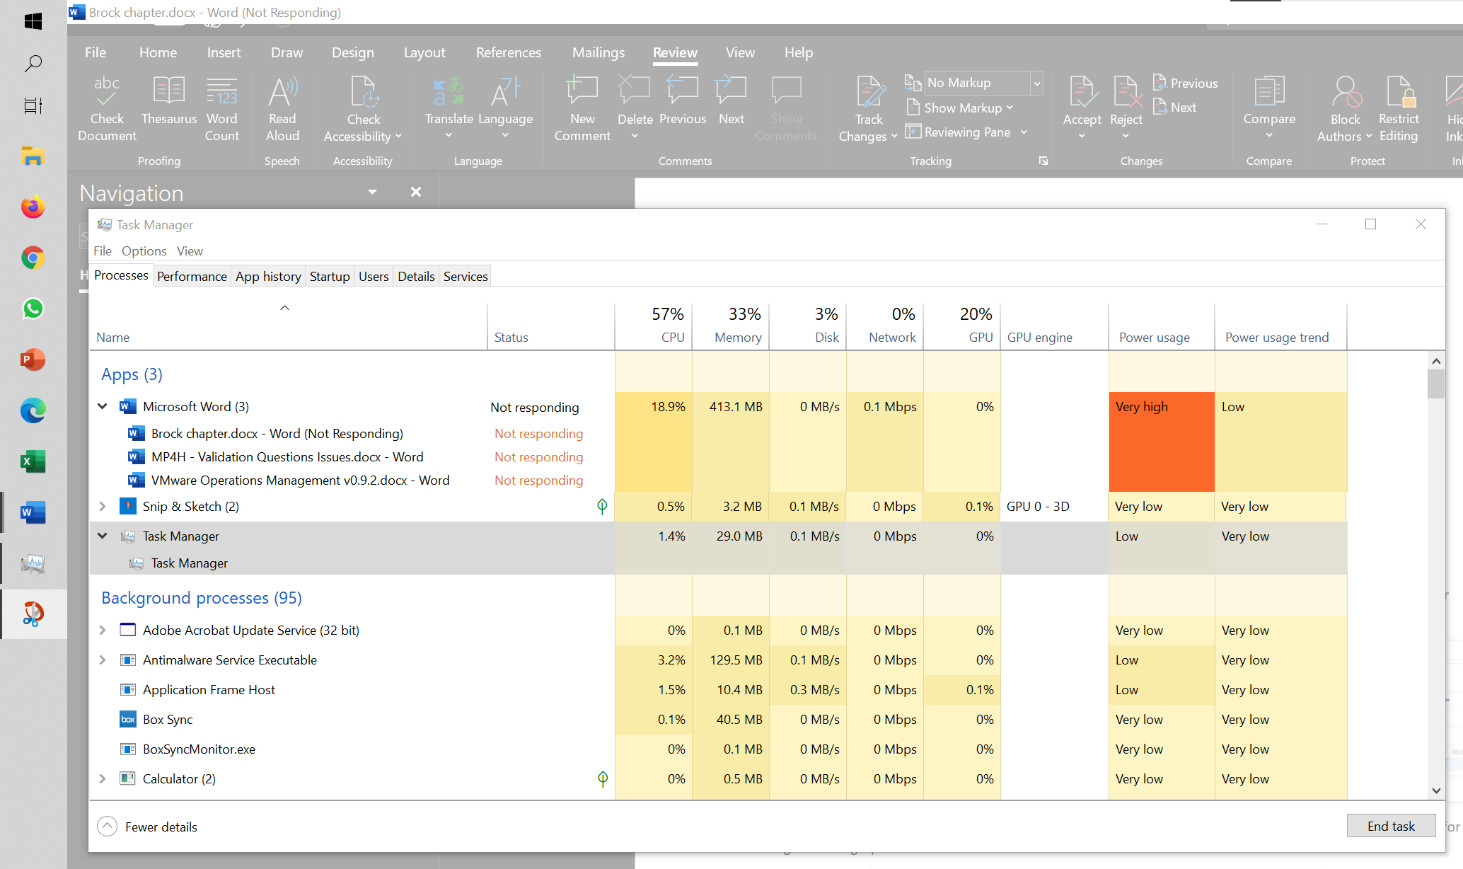
My guess is Turbo Boost. The CPU counter at individual process level does not account for it, while the counter at OS level does.
I left it for 15 minutes and nothing change. So it wasn’t that it needed more time to process the changes. I suspect it encountered a CPU lock, so the CPU where Word is running is running at 100%. Since Windows overall only reports 57%, it’s important to track the peak among Windows CPU. This is why VCF Operations provides the peak value among the VM vCPU.