Storage
This is the layer that application team care as it is what is presented to them.
| Questions | Description |
| Configuration | For each partition, need to know name, filesystem type (e.g. NTFS, ext4), network or local, block size. Ideally, we get the mapping between partition and virtual disk. |
| Capacity | For each partition, need to know the configured space and used space. For free space, we need to know both in absolute (GB) and relative (%). Need to alert before running out of disk space, else the OS crashes. We should not include the networked drive in Guest OS capacity, because the networked drive is typically shared by many. An exception is in VDI use case, where the user personal files is stored on the network. |
| Reclamation | This can be determined from the free space. Reclamation is tricky as it needs to shrink partition. |
| Performance | Queue, Latency (read and write), IOPS, Throughput |
Disk Queue
With VMware Tools, you get Guest OS visibility into the partitions and disk queue. The first one is critical for capacity, while the second is critical for performance.
This counter tracks the queue inside Linux or Windows storage subsystem. It’s not the queue at SCSI driver level, such as LSI Logic or PVSCSI. If this is high then the IO from applications did not reach the underlying OS SCSI driver, let alone the VM. If you are running VMware storage driver, such as PVSCSI, then discuss with VMware Support.
There are actually 2 metrics: One is a point in time and the other is average across the entire collection cycle. Point in time means the snapshot at the collection period. For example, if the collection is every 5 minute, then it’s number on the 300th second, not the average of 300 numbers.
Windows documentation said that “Multi-spindle disk devices can have multiple requests active at one time, but other concurrent requests await service. Requests experience delays proportional to the length of the queue minus the number of spindles on the disks. This difference should average < 2 for good performance.”
| guest.disk.queue | Win32_PerfFormattedData_PerfDisk_PhysicalDisk.Name = \_Total\#CurrentDiskQueueLength" from WMI |
|----|----|
| guest.disk.queueAvg | Win32_PerfFormattedData_PerfDisk_PhysicalDisk.Name = \_Total\#AvgDiskQueueLength" from WMI |
High disk queue in the guest OS, accompanied by low IOPS at the VM, can indicate that the IO commands are stuck waiting on processing by the OS. There is no concrete guidance regarding these IO commands threshold as it varies for different applications. You should view this in relation to the Outstanding Disk IO at the VM layer.
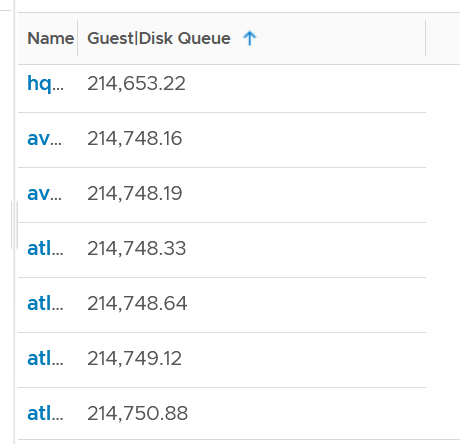
Based on 3000 production VMs in the last 3 months, the value turn out to be sizeable. Almost 70% of the value is below 10. Around 10% is more than 100 though, which I thought it’s rather high.

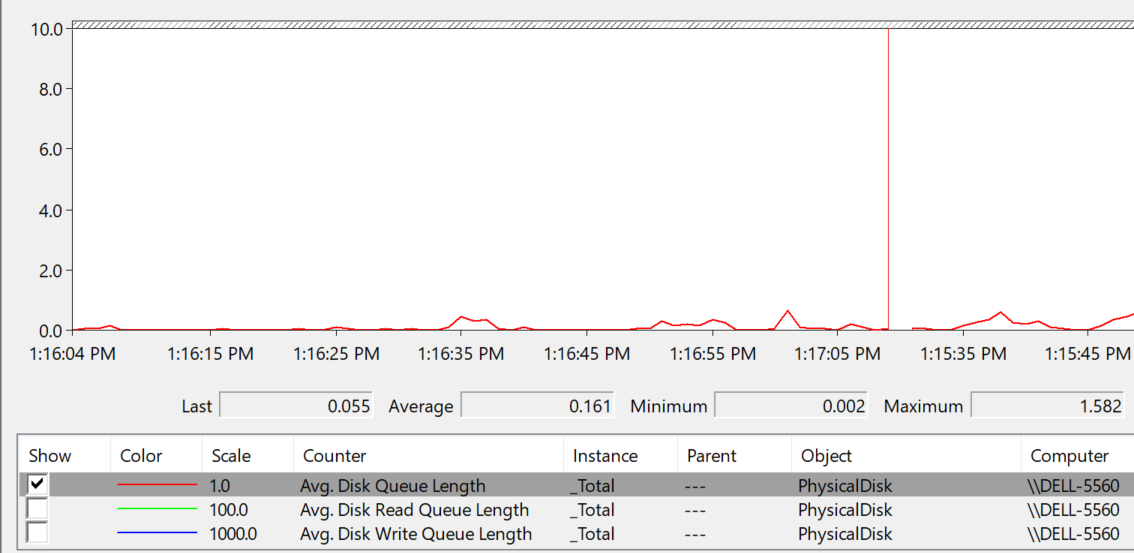
Strangely, there are values that seem to off the chart. I notice this in a few metrics already, including this. Look at the values below. Do they look like a bug in the counter, or severe performance problem?
Unfortunately, we can’t confirm as we do not have latency counter at Guest OS level, or even better, as application level. I am unsure if the queue is above the latency, meaning the latency counter does not start counting until the IO command is executed.
I plot the values at VM level, which unsurprisingly does not correlate. The VM is tracking IO that has been sent, while Guest OS Disk Queue tracks the one that has not been sent.
The preceding line chart also reveals an interesting pattern, which is disk queue only happens rarely. It’s far less frequent than latency.
Let’s find out more. From the following heat map, you can see there are occurrences where the value is >100.
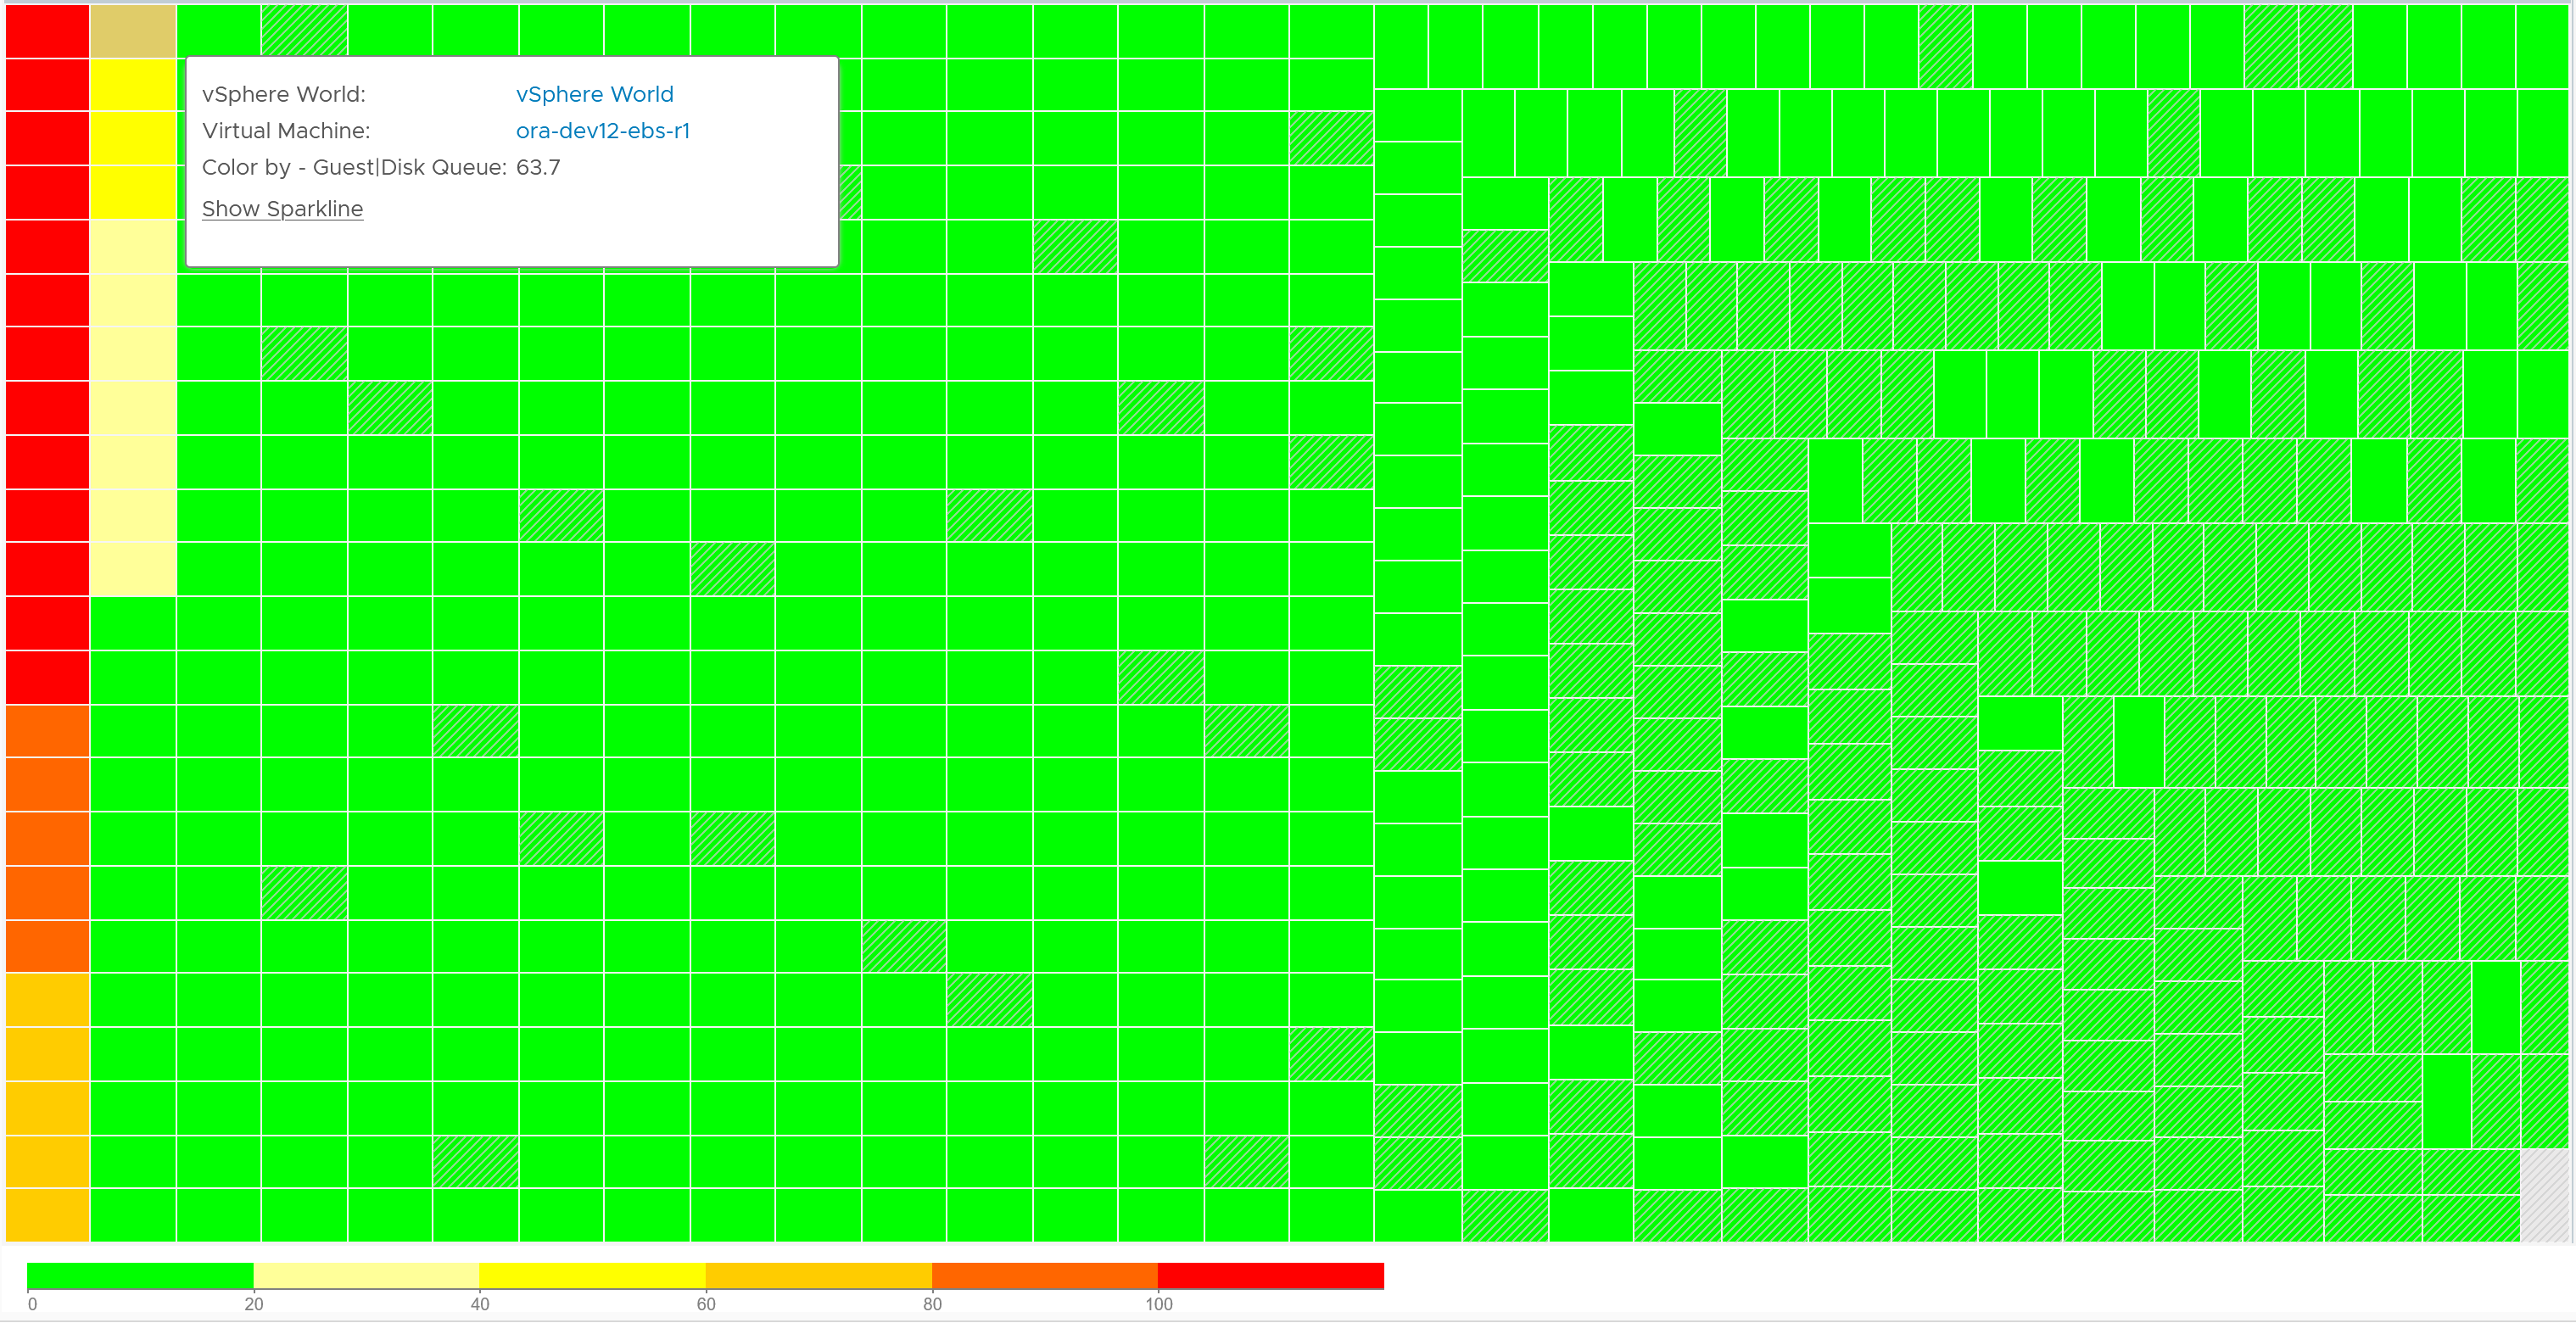
However, when we compare between current value and maximum value, the value can be drastically different.
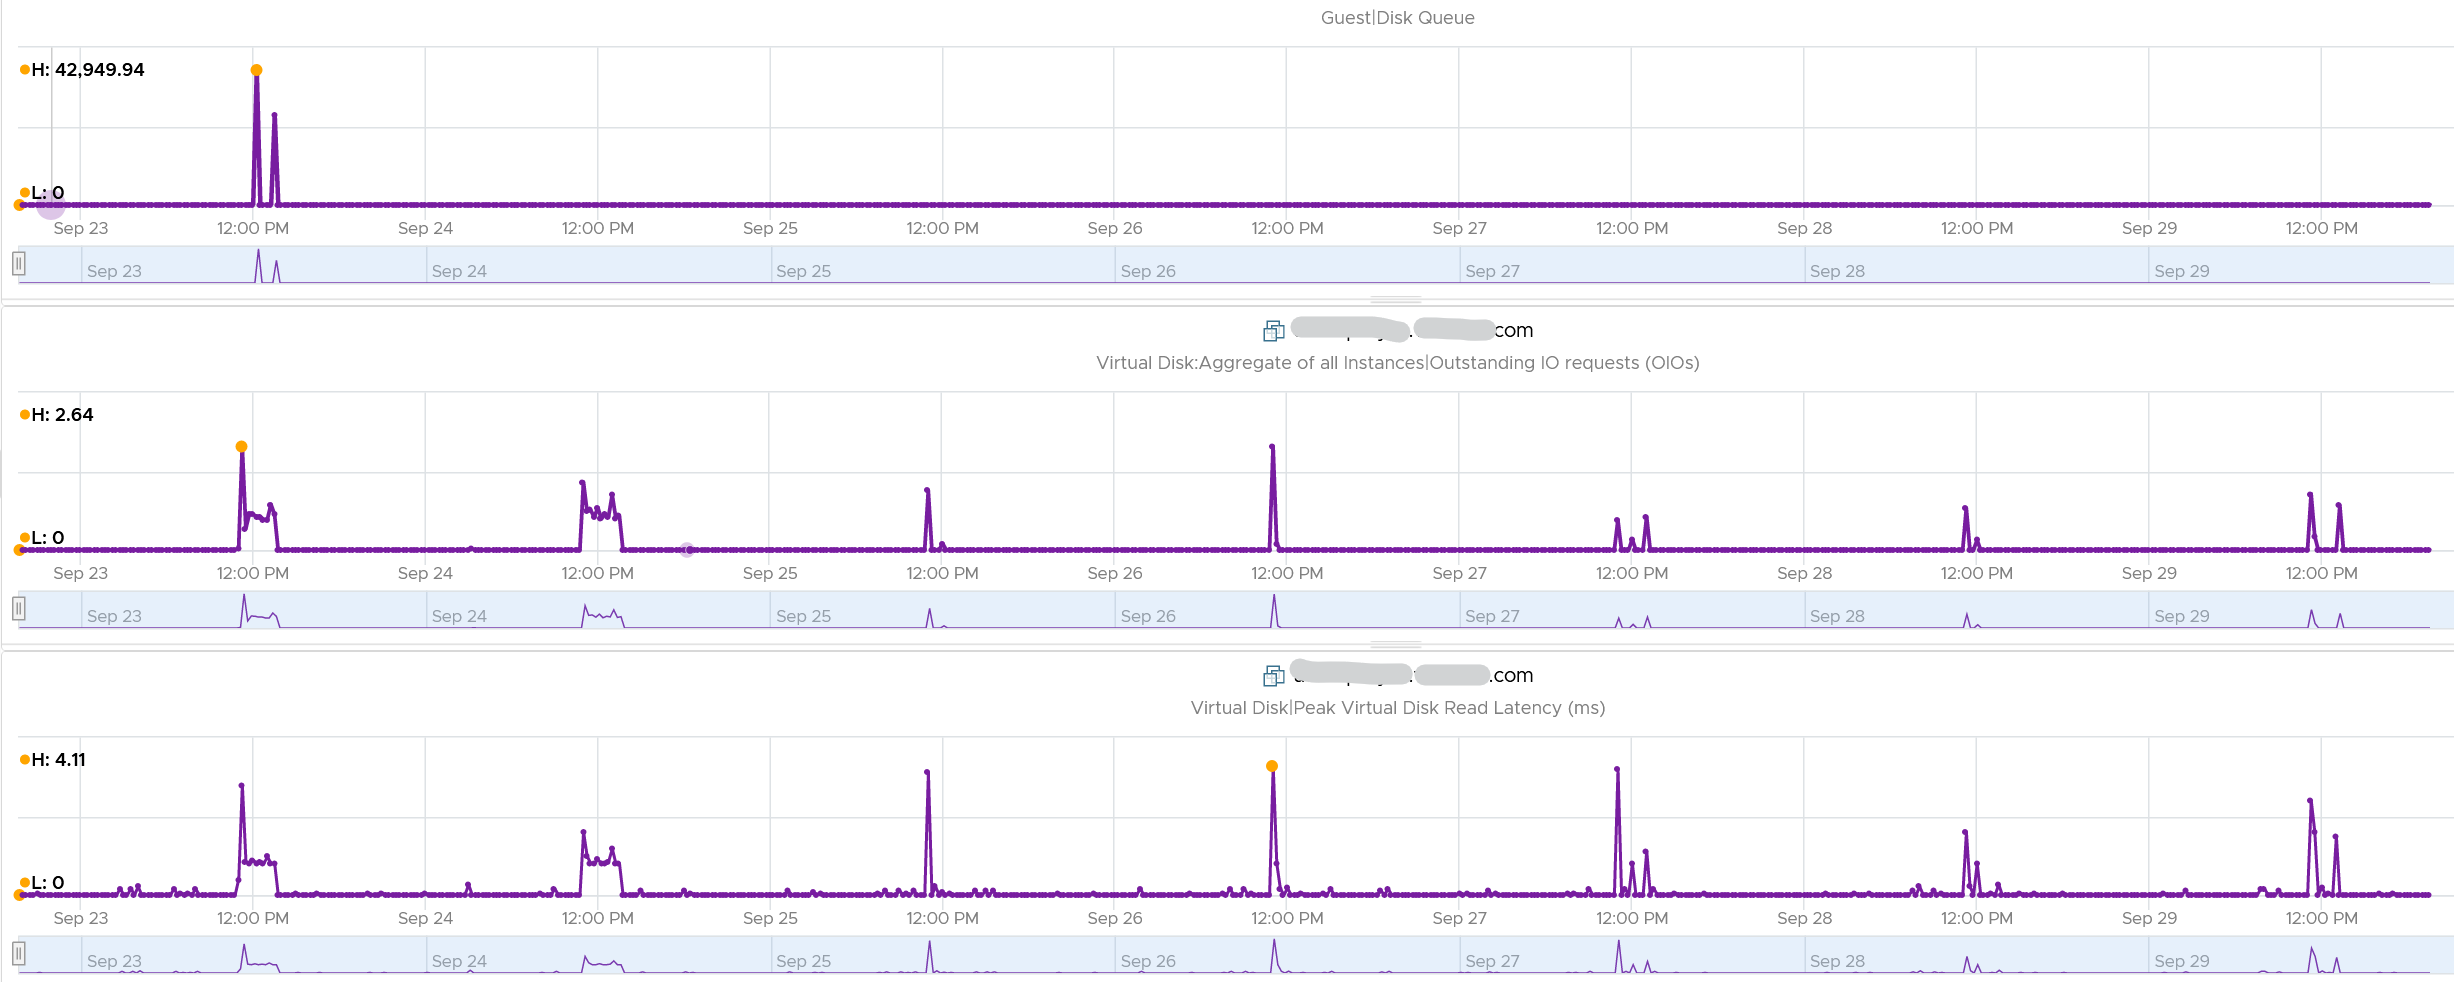
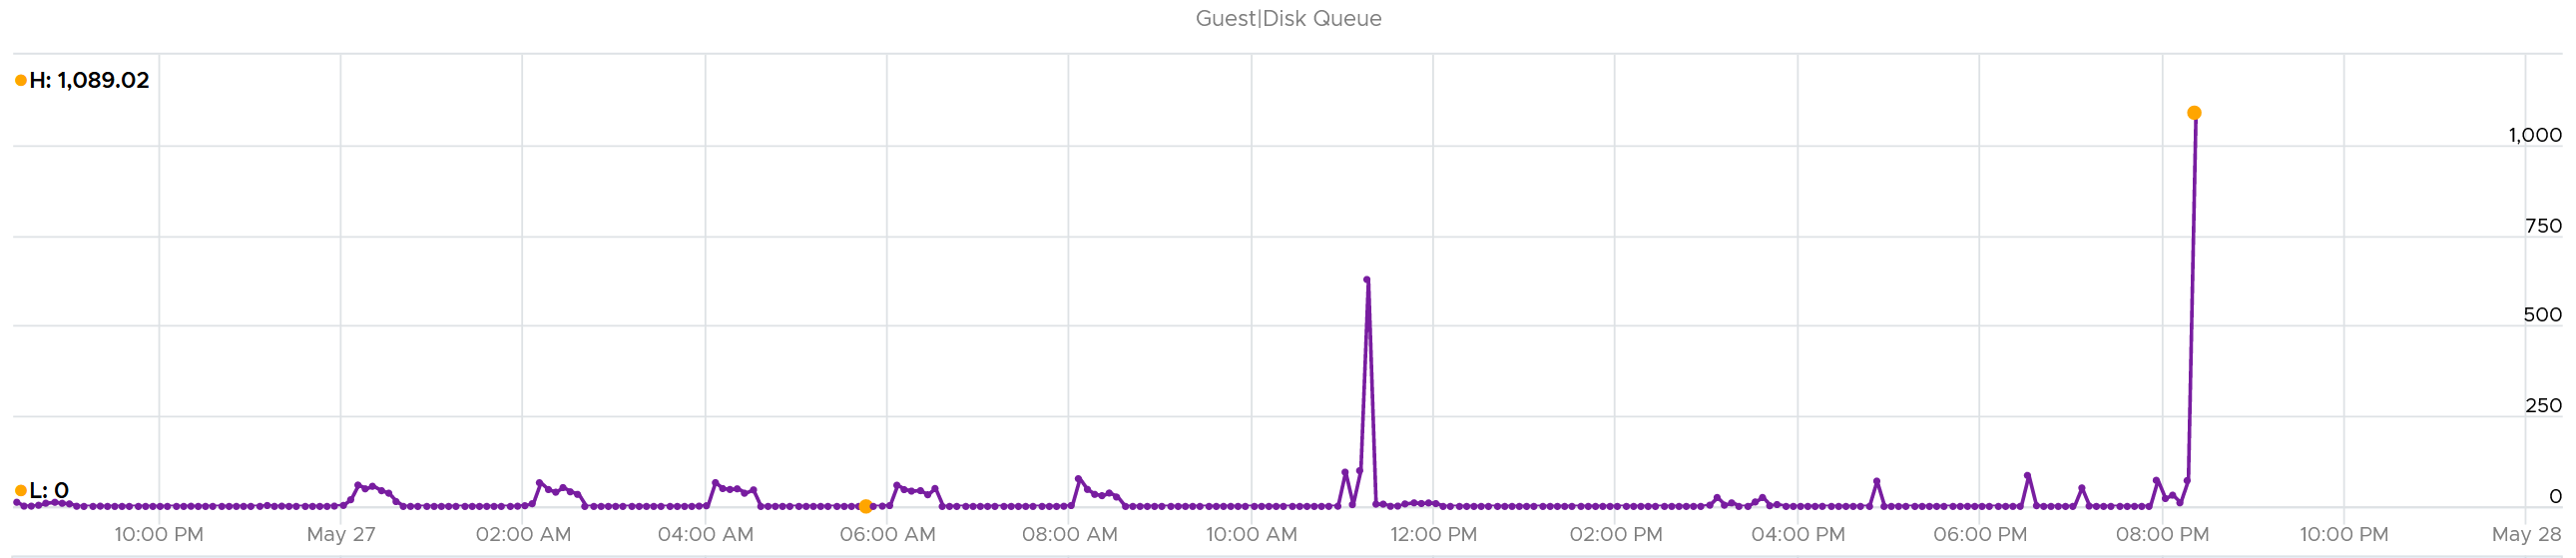
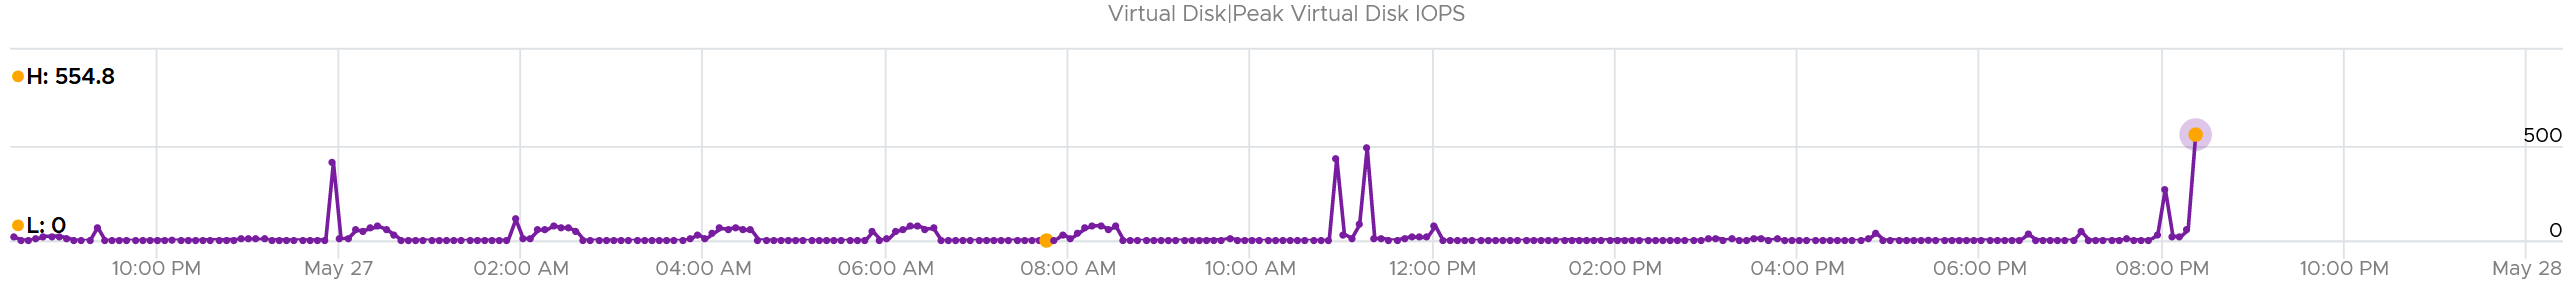
Let’s take one of the VMs and drill down. This VM has regular spikes, with the last one exceeding 1000.
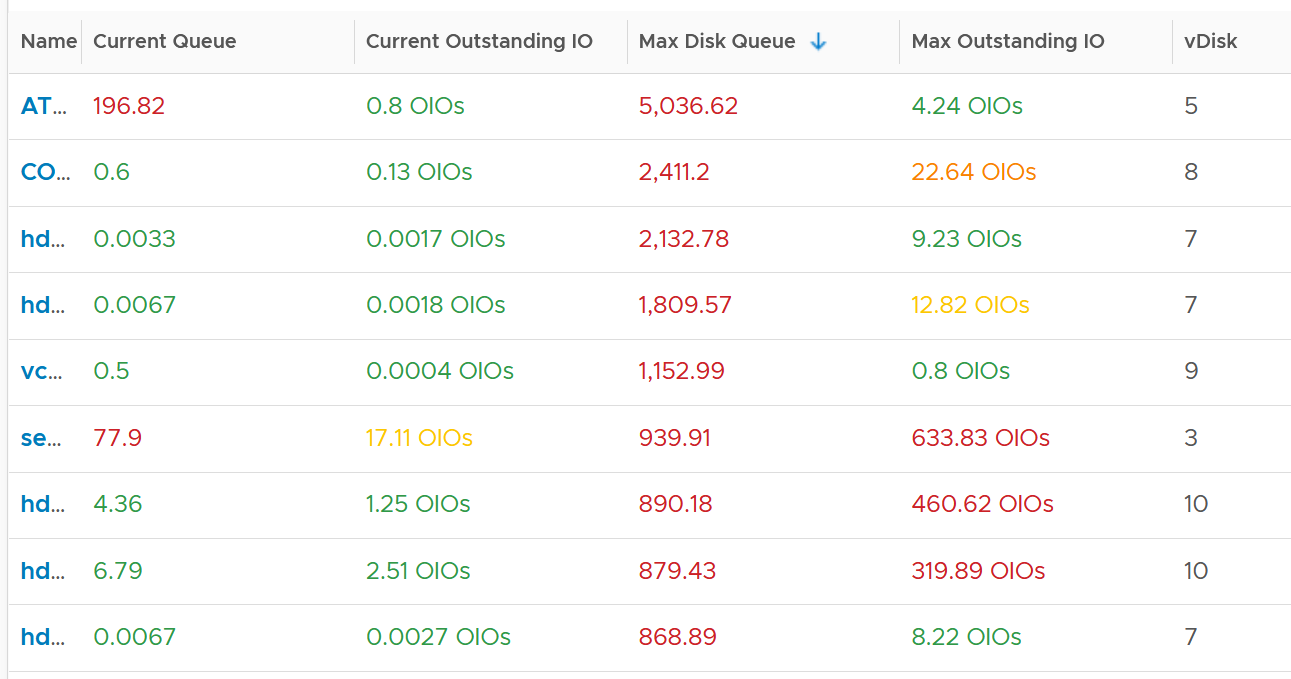
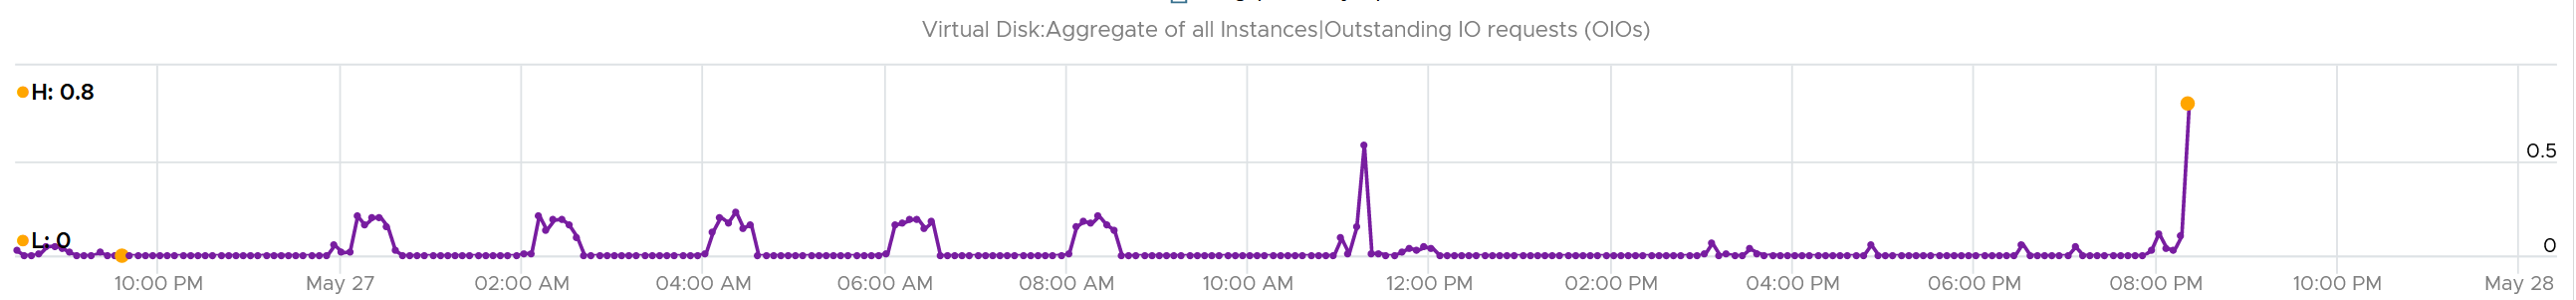
Their values should correlate with disk outstanding IO. However, the values are all low. That means the queue happens inside the Guest OS. The IO is not sent down to the VM.
Which in turn should have some correlation with IOPS, especially if the underlying storage in the Guest OS (not VM) is unable to cope. The queue is caused by high IOPS which cannot be processed.
Finally, it would manifest in latency. Can you explain why the latency is actually still good?
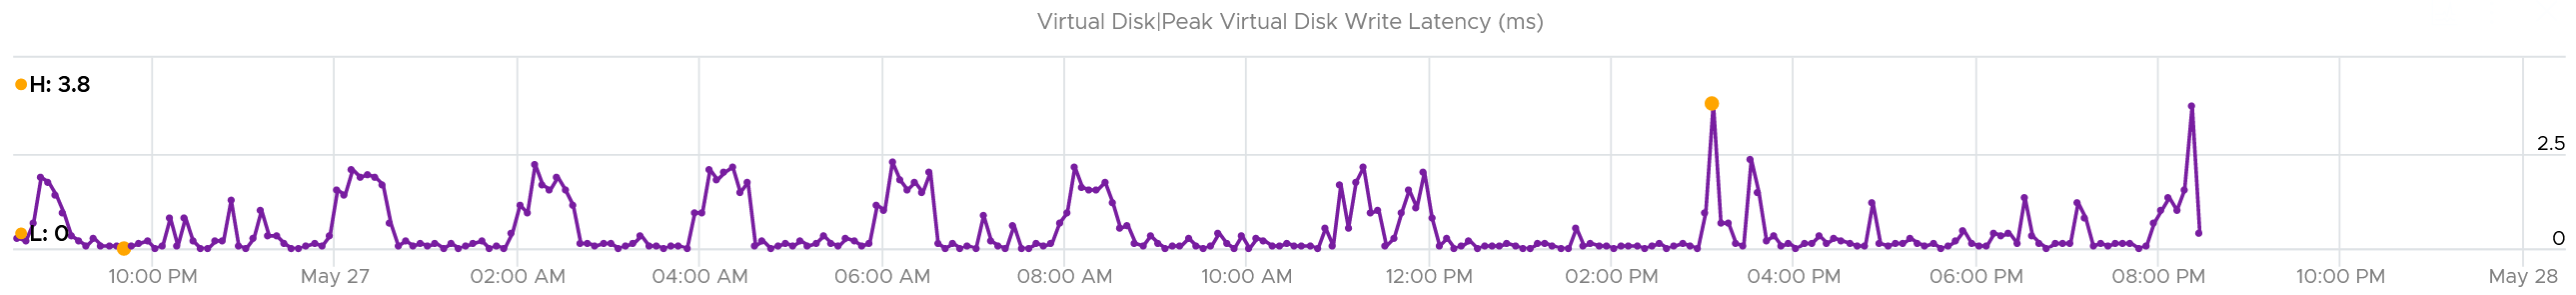
It’s because that’s from the IO that reaches the hypervisor. The IO that was stuck inside Windows is not included here.
The application feels latency is high, but the VM does not show it as the IO is stuck in between.
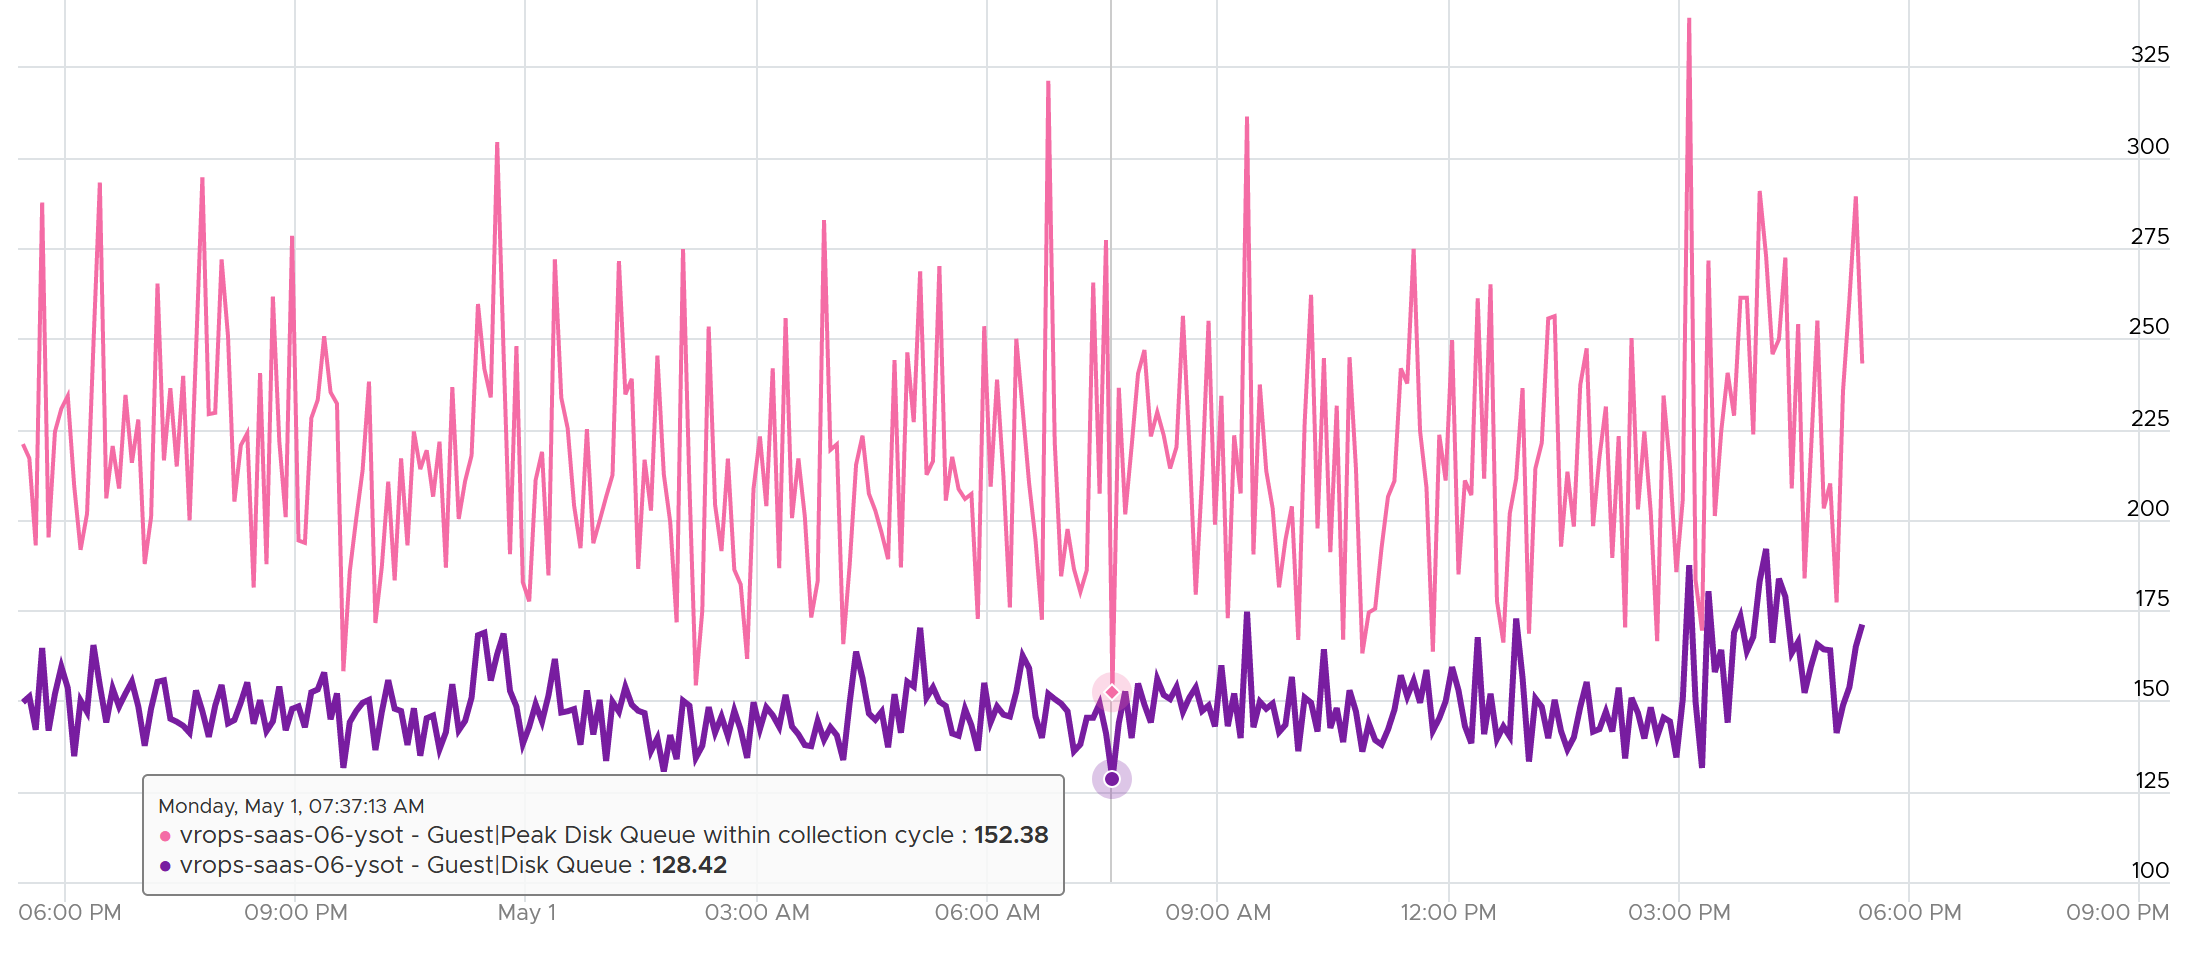
Can the disk queue be constantly above 100?
The following VM shows 2 counters. The 20-second Peak metric is showing ~200 – 250 queue, while the 5-minute average shows above 125 constantly. The first counter is much more volatile, indicating the queue did not sustain.