Overview
A cluster is operationally a collection of ESXi hosts. As a result, the basic counters of CPU, memory, disk and network are basically the sum of the member host.
vSphere Cluster
What makes a cluster more complex than the sum of its hosts is the various cluster-level features and configuration. I see vSphere Cluster as the smallest logical building block. From operations management, it’s basically a single computer. It’s a huge and complex machine, much more than just a group of ESXi hosts sharing a common network and storage.
Let’s start by looking its 2 most basic features:
| Features | Impact | Impacts |
|---|---|---|
| HA | Capacity | The various options of HA complicate usable capacity calculation. |
| Availability | HA results in 2 metrics: actual availability and operational availability. HA event requires VM availability to be verified as application dependency could be affected. The order of booting needs to be kept up to date. HA event needs to be reported and investigated. This typically requires log analysis to find the root cause. | |
| Configuration | ESXi hosts in the cluster should have identical hardware & software configuration. Customers typically have multiple clusters, and need them to be consistently configured. | |
| Inventory | Actual needs to match plan. Not only the amount, but also the movement and their status. | |
| DRS | Performance | Degradation of vMotion stunned time could give a clue to overall ESXi performance. vMotion may impact latency-sensitive application. Rate of vMotion should be measured against expectation. |
| Configuration | Various DRS settings such as automation level should match plan and standard. VM-level exception can get buried in large environment. Customers typically have multiple clusters, and need them to be consistently configured. |
You can see that the above complicate operations, especially in a very large environment with hundreds of clusters. If you add these features on top, you further increase complexity of your operations.
| Features | Impact | Impacts |
|---|---|---|
| Affinity | Configuration | The settings of affinity and anti-affinity should match plan. In large environment with hundreds of clusters this can get buried and hence overlooked. |
| Resource Pool | Capacity | Shares, Limit, Reservation done at resource pool level need to be compatible with those at its children VM. Resource Pool should not be peer of VM. |
| Performance | ||
| Configuration | Complication from cascading resource pools. Need to ensure VMs are not siblings of resource pool | |
| DPM | Capacity | DPM impacts capacity as it changes total capacity. |
| Performance | DPM is only considering the ESXi utilization metrics. It does not check the VM contention metric. | |
| Configuration | DPM settings need to match plan. |
The above cover the standard vSphere cluster. There are 2 other variants, which take the operational complexity higher.
| Features | Impact | Impacts |
|---|---|---|
| Stretched Cluster | Configuration | The configuration of each site needs to be checked so VMs always accessed local storage |
| Capacity | The utilization of the 2 physical sites may be intentionally unbalanced, because one acts as primary site while the other as DR site. | |
| Performance | Horse-shoe traffic between VMs on the same site. Traffic ping pong between VMs on different sites. | |
| Availability | The whole purpose of a stretched cluster is they protect one another. This shall be tested at least once a year. | |
| vSAN Cluster | vSAN impacts all aspects of operations management. It impacts Day 0, Day 1, and Day 2. |
In addition, there are complication simply because there are multiple members in the cluster. For example, is cluster utilization simply the average of all its hosts? What if there is imbalanced? It will get buried if the cluster has many hosts.
While a cluster focuses on compute, it is where VM runs and consumes network and storage. This means network and storage counters must be considered as appropriate. If you’re using vSAN, then it’s mandatory.
Base Metrics
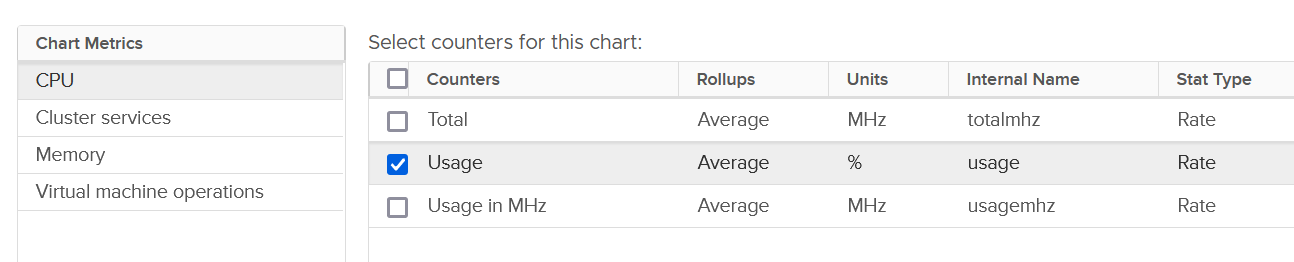
vSphere Client only displays basic set of metrics. They are grouped into 4, as shown in the following screenshot:
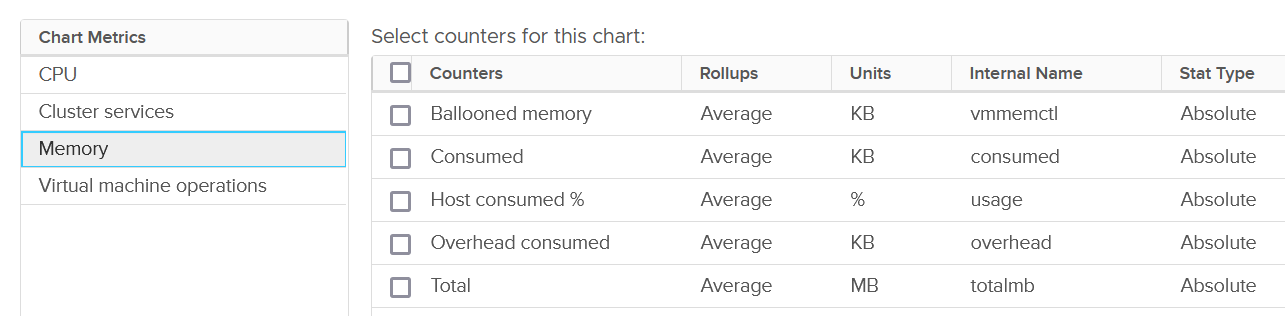
For each of the group, there is basic set of metrics. Here it is for memory:
The group Cluster Services only provides 3 metrics:

VM Operations
vSphere Cluster, being the main object where VM runs, has a set of event metrics. They count the number of times an event, such as a VM gets deleted, happens. This provides insight into the dynamics of the environment.
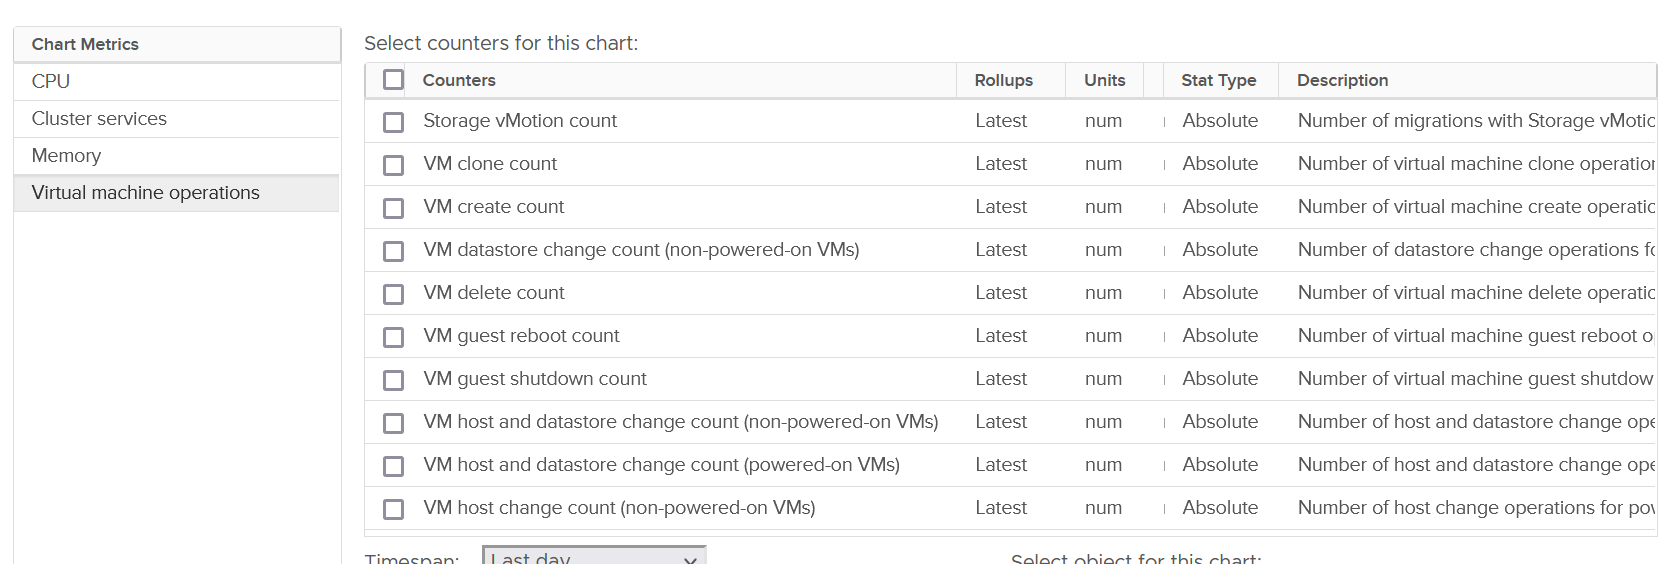
Take note that the metric is accumulative. So it starts since the day the cluster was created. VCF Operations converts into rate, and also make them available at higher level objects (Data Center, vCenter and vSphere World).
| Category | Metric Name | Description |
|---|---|---|
| Change of State | VM guest reboot count | Only a reboot. The underlying VM is not powered off. |
| VM guest shutdown count | I think this triggers VM Power Off too. | |
| VM standby guest count | My guess this also power off the VM | |
| VM power off count | I think this is direct, abrupt power off. It does not include proper shut down from Guest OS. | |
| VM power on count | ||
| VM reset count | Power cycle, different to Guest OS restart as the VM is momentarily powered off. | |
| VM suspend count | Deeper than Guest OS Standby. Is this like hibernate in Windows? | |
| Change of Inventory | VM create count | All creation, be it from template, direct, or cloning. So this is the total amount. |
| VM clone count | Creation via cloning only. | |
| VM template deploy count | Counted separately to separate those VMs not deployed from template. | |
| VM reconfigure count | Log Insight tracks the actual changes. | |
| VM register count | Add into vSphere inventory | |
| VM unregister count | Take note the VM file can still exist in datastore and LUN | |
| VM delete count | All deletion, be it API or UI. | |
| Change of Location | vMotion count | Change of ESXi host only |
| Storage Motion count | Change of datastore only. | |
| VM host and datastore change count | Both change in one event. Powered-on VMs only | |
| VM datastore change count | Only for powered-off VMs | |
| VM host and datastore change count | Only for powered-off VMs | |
| VM host change count | Only for powered-off VMs |
You certainly have some expectation on the dynamics of your environment. Does the reality match your expectation?
In production environment, these numbers should be low. Some numbers such as shutdown should also match the change request and happens during the green zone. Some exceptions apply, such as your VDI design includes scheduled reboot on the weekend.