Provider
Overview
A cluster is operationally a collection of ESXi hosts. As a result, the basic counters of CPU, memory, disk and network are basically the sum of the member host.
vSphere Cluster
What makes a cluster more complex than the sum of its hosts is the various cluster-level features and configuration. I see vSphere Cluster as the smallest logical building block. From operations management, it’s basically a single computer. It’s a huge and complex machine, much more than just a group of ESXi hosts sharing a common network and storage.
Let’s start by looking its 2 most basic features:
| Features | Impact | Impacts |
|---|---|---|
| HA | Capacity | The various options of HA complicate usable capacity calculation. |
| Availability | HA results in 2 metrics: actual availability and operational availability. HA event requires VM availability to be verified as application dependency could be affected. The order of booting needs to be kept up to date. HA event needs to be reported and investigated. This typically requires log analysis to find the root cause. | |
| Configuration | ESXi hosts in the cluster should have identical hardware & software configuration. Customers typically have multiple clusters, and need them to be consistently configured. | |
| Inventory | Actual needs to match plan. Not only the amount, but also the movement and their status. | |
| DRS | Performance | Degradation of vMotion stunned time could give a clue to overall ESXi performance. vMotion may impact latency-sensitive application. Rate of vMotion should be measured against expectation. |
| Configuration | Various DRS settings such as automation level should match plan and standard. VM-level exception can get buried in large environment. Customers typically have multiple clusters, and need them to be consistently configured. |
You can see that the above complicate operations, especially in a very large environment with hundreds of clusters. If you add these features on top, you further increase complexity of your operations.
| Features | Impact | Impacts |
|---|---|---|
| Affinity | Configuration | The settings of affinity and anti-affinity should match plan. In large environment with hundreds of clusters this can get buried and hence overlooked. |
| Resource Pool | Capacity | Shares, Limit, Reservation done at resource pool level need to be compatible with those at its children VM. Resource Pool should not be peer of VM. |
| Performance | ||
| Configuration | Complication from cascading resource pools. Need to ensure VMs are not siblings of resource pool | |
| DPM | Capacity | DPM impacts capacity as it changes total capacity. |
| Performance | DPM is only considering the ESXi utilization metrics. It does not check the VM contention metric. | |
| Configuration | DPM settings need to match plan. |
The above cover the standard vSphere cluster. There are 2 other variants, which take the operational complexity higher.
| Features | Impact | Impacts |
|---|---|---|
| Stretched Cluster | Configuration | The configuration of each site needs to be checked so VMs always accessed local storage |
| Capacity | The utilization of the 2 physical sites may be intentionally unbalanced, because one acts as primary site while the other as DR site. | |
| Performance | Horse-shoe traffic between VMs on the same site. Traffic ping pong between VMs on different sites. | |
| Availability | The whole purpose of a stretched cluster is they protect one another. This shall be tested at least once a year. | |
| vSAN Cluster | vSAN impacts all aspects of operations management. It impacts Day 0, Day 1, and Day 2. |
In addition, there are complication simply because there are multiple members in the cluster. For example, is cluster utilization simply the average of all its hosts? What if there is imbalanced? It will get buried if the cluster has many hosts.
While a cluster focuses on compute, it is where VM runs and consumes network and storage. This means network and storage counters must be considered as appropriate. If you’re using vSAN, then it’s mandatory.
Base Metrics
vSphere Client only displays basic set of metrics. They are grouped into 4, as shown in the following screenshot:
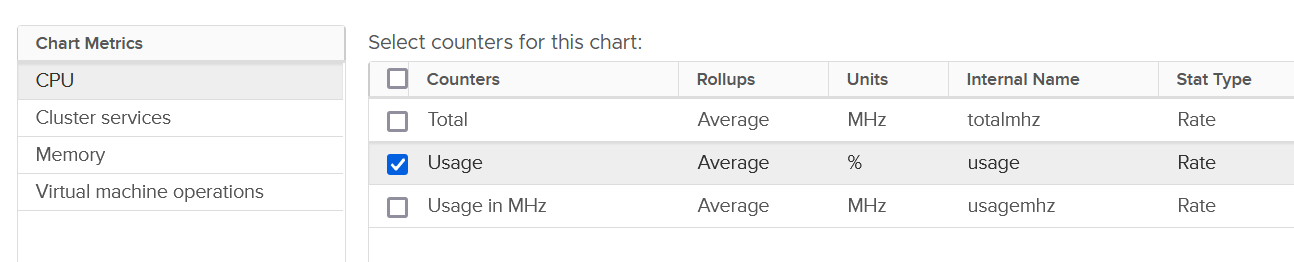
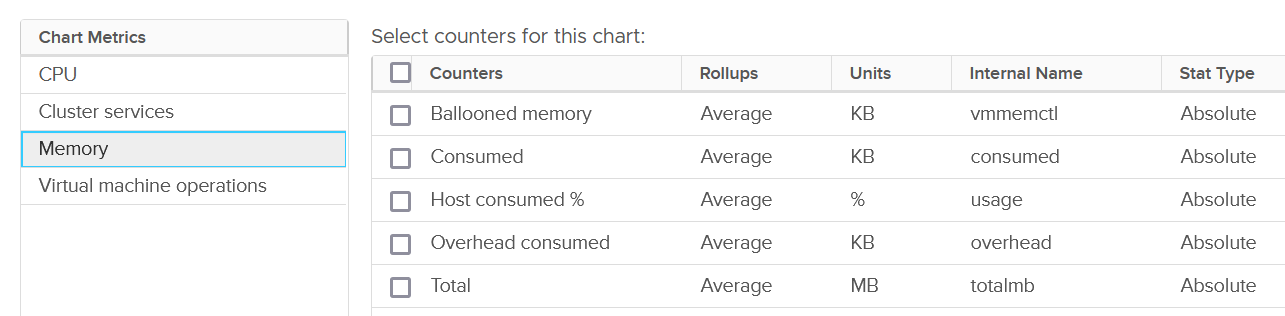
For each of the group, there is basic set of metrics. Here it is for memory:
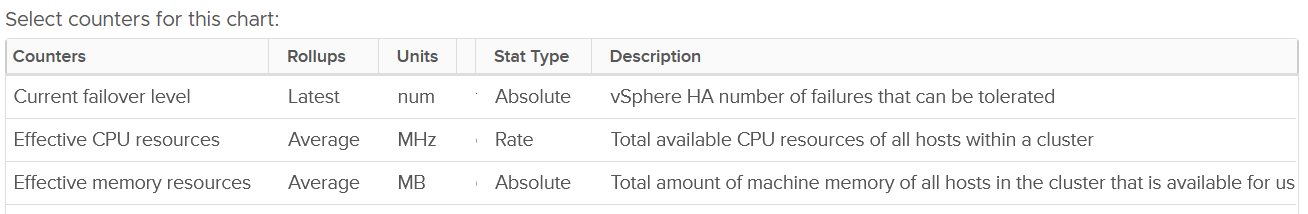
The group Cluster Services only provides 3 metrics:
VM Operations
vSphere Cluster, being the main object where VM runs, has a set of event metrics. They count the number of times an event, such as a VM gets deleted, happens. This provides insight into the dynamics of the environment.
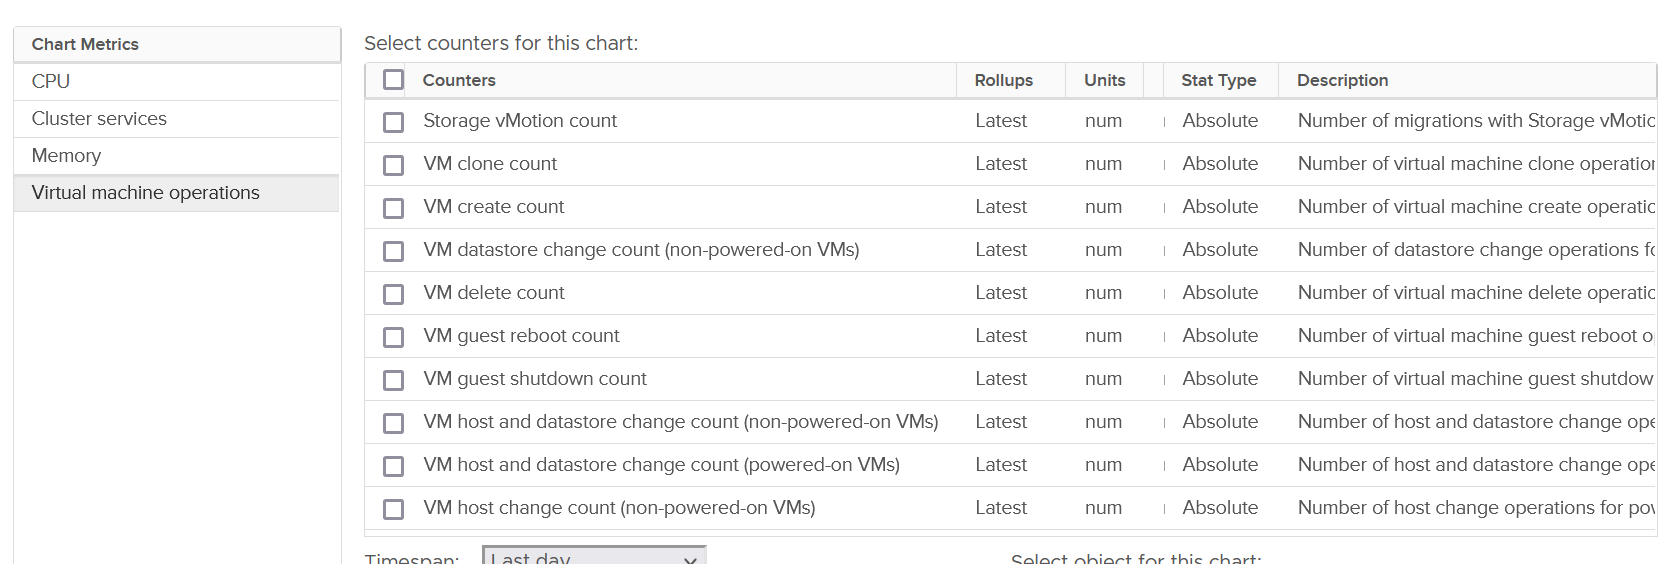
Take note that the metric is accumulative. So it starts since the day the cluster was created. VCF Operations converts into rate, and also make them available at higher level objects (Data Center, vCenter and vSphere World).
| Category | Metric Name | Description |
|---|---|---|
| Change of State | VM guest reboot count | Only a reboot. The underlying VM is not powered off. |
| VM guest shutdown count | I think this triggers VM Power Off too. | |
| VM standby guest count | My guess this also power off the VM | |
| VM power off count | I think this is direct, abrupt power off. It does not include proper shut down from Guest OS. | |
| VM power on count | ||
| VM reset count | Power cycle, different to Guest OS restart as the VM is momentarily powered off. | |
| VM suspend count | Deeper than Guest OS Standby. Is this like hibernate in Windows? | |
| Change of Inventory | VM create count | All creation, be it from template, direct, or cloning. So this is the total amount. |
| VM clone count | Creation via cloning only. | |
| VM template deploy count | Counted separately to separate those VMs not deployed from template. | |
| VM reconfigure count | Log Insight tracks the actual changes. | |
| VM register count | Add into vSphere inventory | |
| VM unregister count | Take note the VM file can still exist in datastore and LUN | |
| VM delete count | All deletion, be it API or UI. | |
| Change of Location | vMotion count | Change of ESXi host only |
| Storage Motion count | Change of datastore only. | |
| VM host and datastore change count | Both change in one event. Powered-on VMs only | |
| VM datastore change count | Only for powered-off VMs | |
| VM host and datastore change count | Only for powered-off VMs | |
| VM host change count | Only for powered-off VMs |
You certainly have some expectation on the dynamics of your environment. Does the reality match your expectation?
In production environment, these numbers should be low. Some numbers such as shutdown should also match the change request and happens during the green zone. Some exceptions apply, such as your VDI design includes scheduled reboot on the weekend.
Performance
Operationally, you manage at cluster level, not at Resource Pool, ESXi host, or data center level. It’s the sweet spot for starting your monitoring and troubleshooting. As usual, we start with the contention metric, followed by the utilization metric.
By definition, the metrics are average numbers. So be careful as there can be VM that has issue but obscured in the cluster wide average. Even the so-called total or summation is mathematically an average. For example, the Total CPU Wait counter is the sum of all ESXi CPU Wait metrics, which in turn is the sum of all the VMs. At the end you get a large number, which you need to normalize and convert into average. Since you divide it against the cluster total, you get average.
Utilization vs Contention
There is a common misconception that you cannot have performance issue when cluster has low utilization. We introduced that problem as a story earlier here.
Is there corelation between cluster utilization and cluster contention?
I’ll show 2 opposite examples.
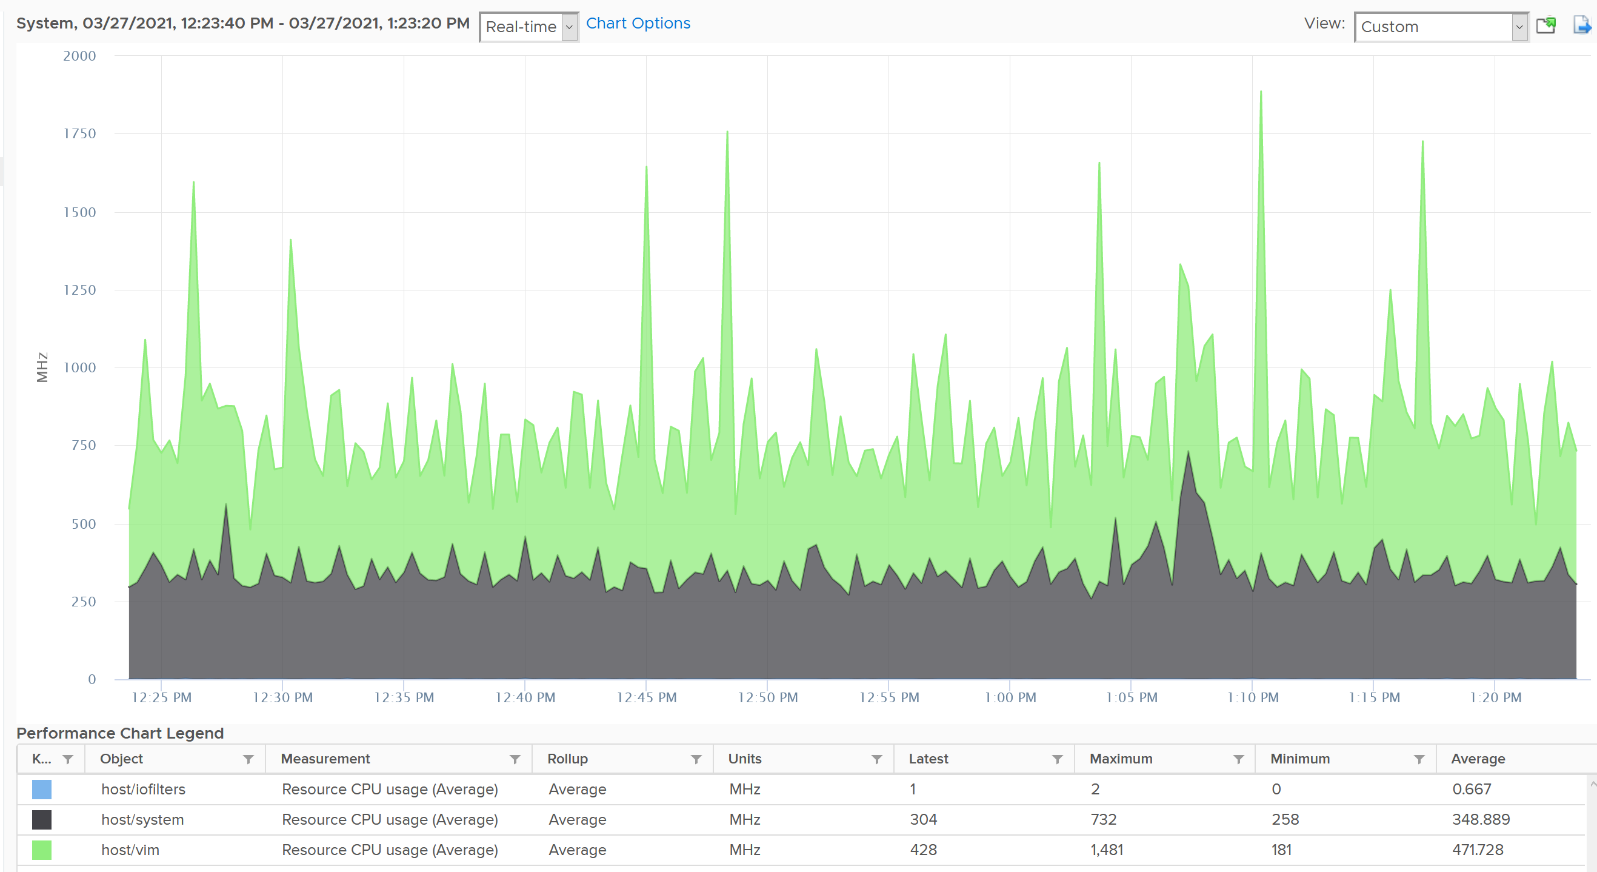
Example showing Correlation
If every VM is given the same treatment by the cluster, then yes.
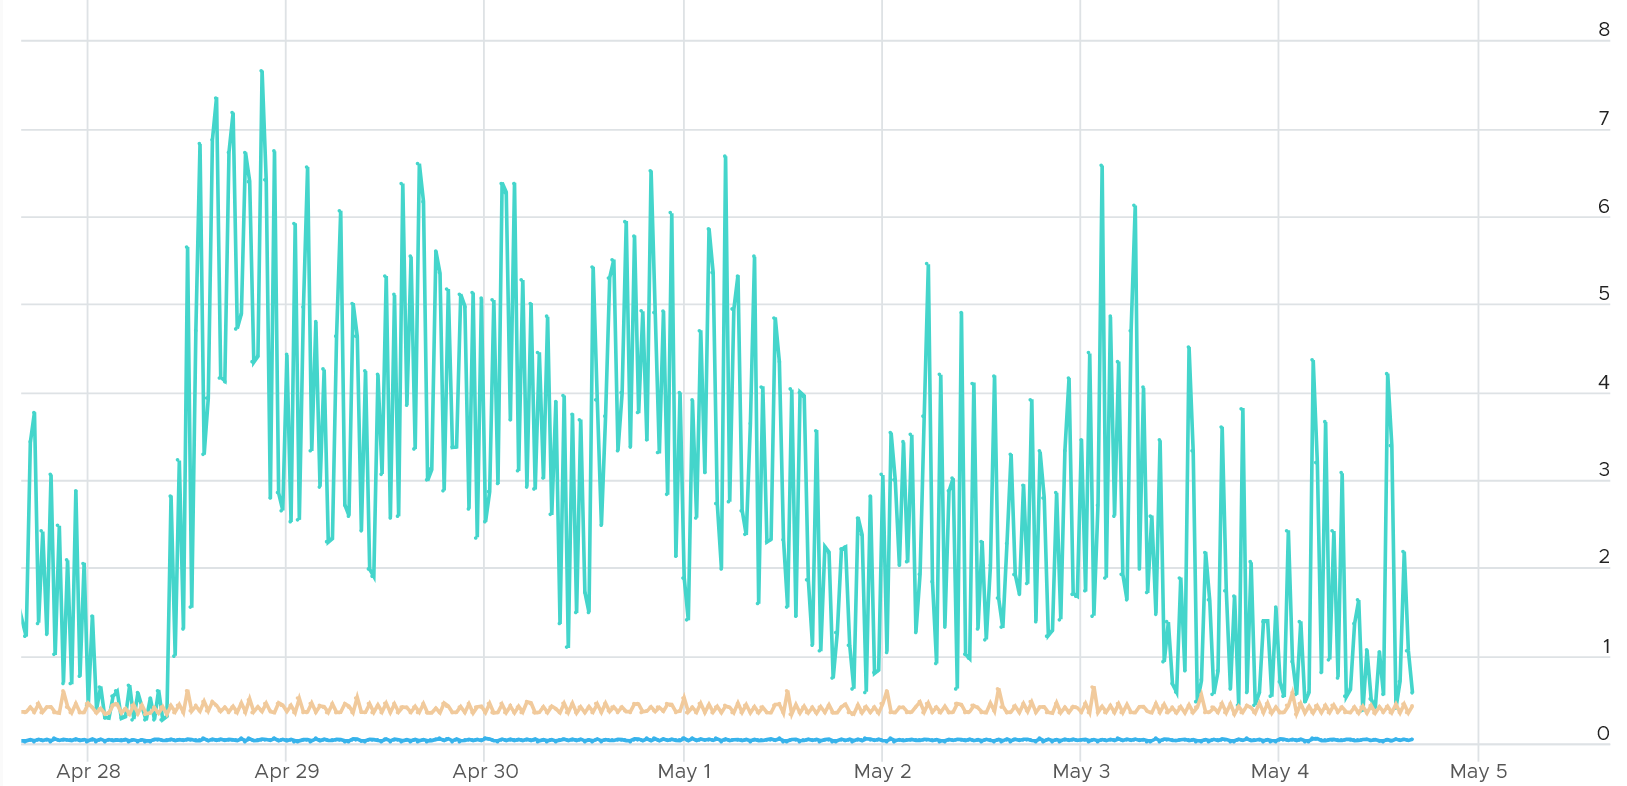
Here is a cluster experiencing regular high utilization in the last 7 days. You can clearly see the peak. The cluster has 14 ESXi Hosts.
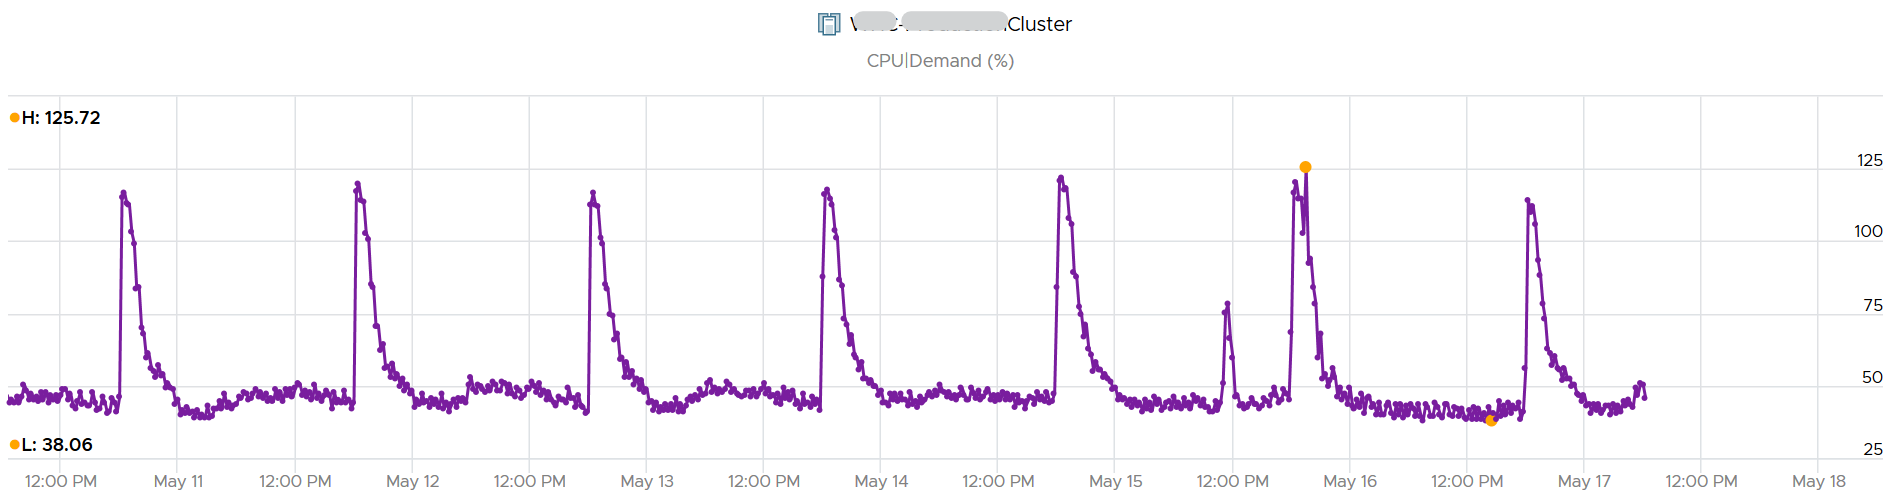
A logical question here would be what’s the impact on VM performance? Are they getting the CPU they asked? The cluster has 550 running VM.
This is where the contention metrics come in. One tracks the depth of the problem, the other the breadth of the problem.
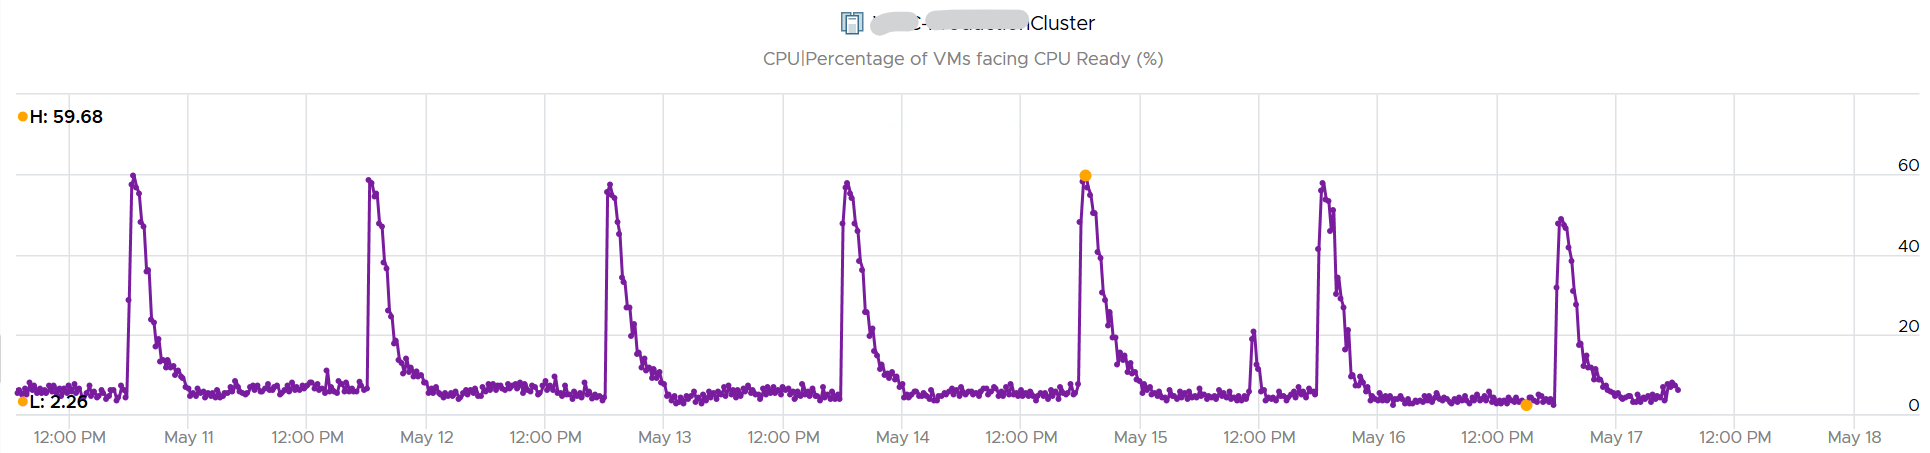
The counter Percentage of VMs facing CPU Ready > 1% shows a nearly identical pattern. We can see that a big percentage of the VM population is affected.
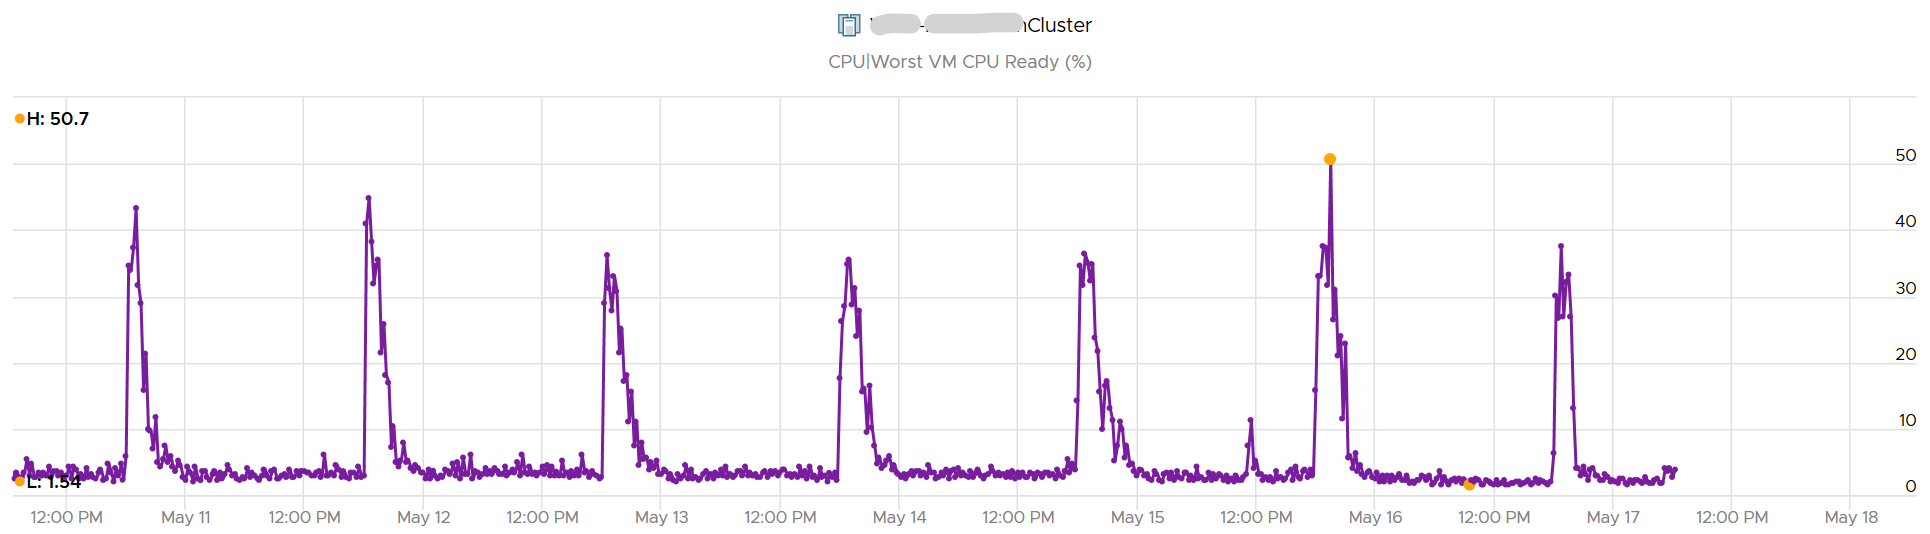
The second counter tracks the depth, giving the absolute worst CPU Ready value experienced by any VM in the cluster.
Example showing no Correlation
Performance is unmet demand. VM 007 can face very high contention when all other VMs on the same cluster face no contention.
It is possible for VMs in the cluster to suffer from poor performance, while the cluster utilization is low. One main reason is cluster utilization looks at the provider layer (ESXi), while performance looks at individual consumer (VM).
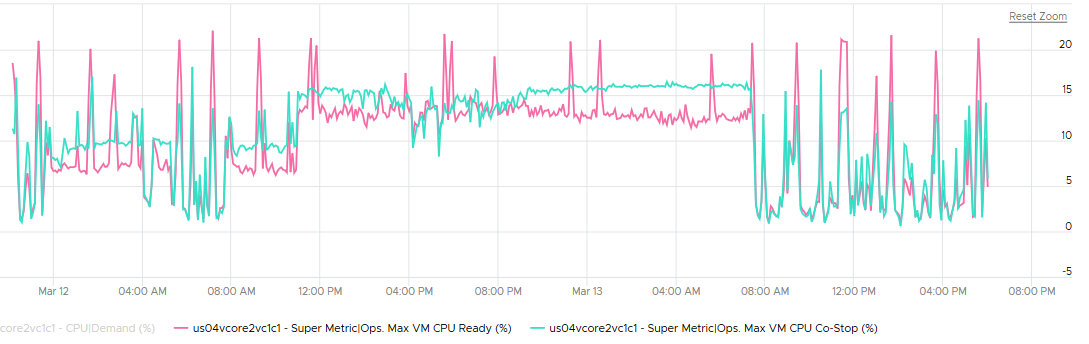
The following cluster has 32 ESXi supporting 2357 VM. The average demand across the cluster is <40%. Since it has 32 ESXi and 2357 VM, we can retire 8 ESXi or add 1K VM.
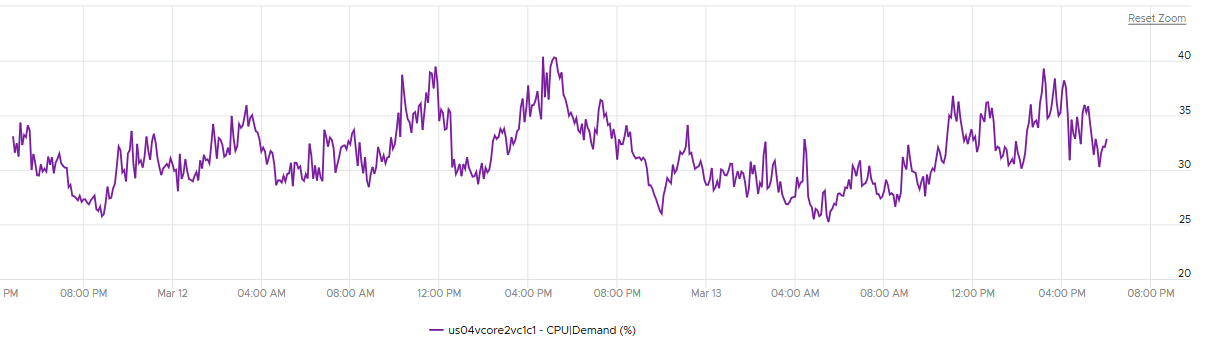
And yet the VMs in the clusters are facing contention. Both VM CPU Ready and CPU Co-stop are high.
Let me take another example, where you can see the corelation between cluster utilization and VM contention in the cluster. My apology that the picture is not sharp. You can see the cluster has 774 running VM at the start. One month later it has dropped to 629, a drop of 145 VM or 19%. The second line chart reveals the number of running vCPU dropped from 3019 to 1980, a whopping 1039 vCPU or 34%. That indicates the big VMs were moved out.
This cluster was running mission critical VMs. What’s going on?! What caused the mass evacuation.
Notice the mass evacuation happened multiple times, so it’s not accidental.
Looking at the last chart. It has 2 line. Maroon showing utilization, blue showing contention. Can you figure out what happened?
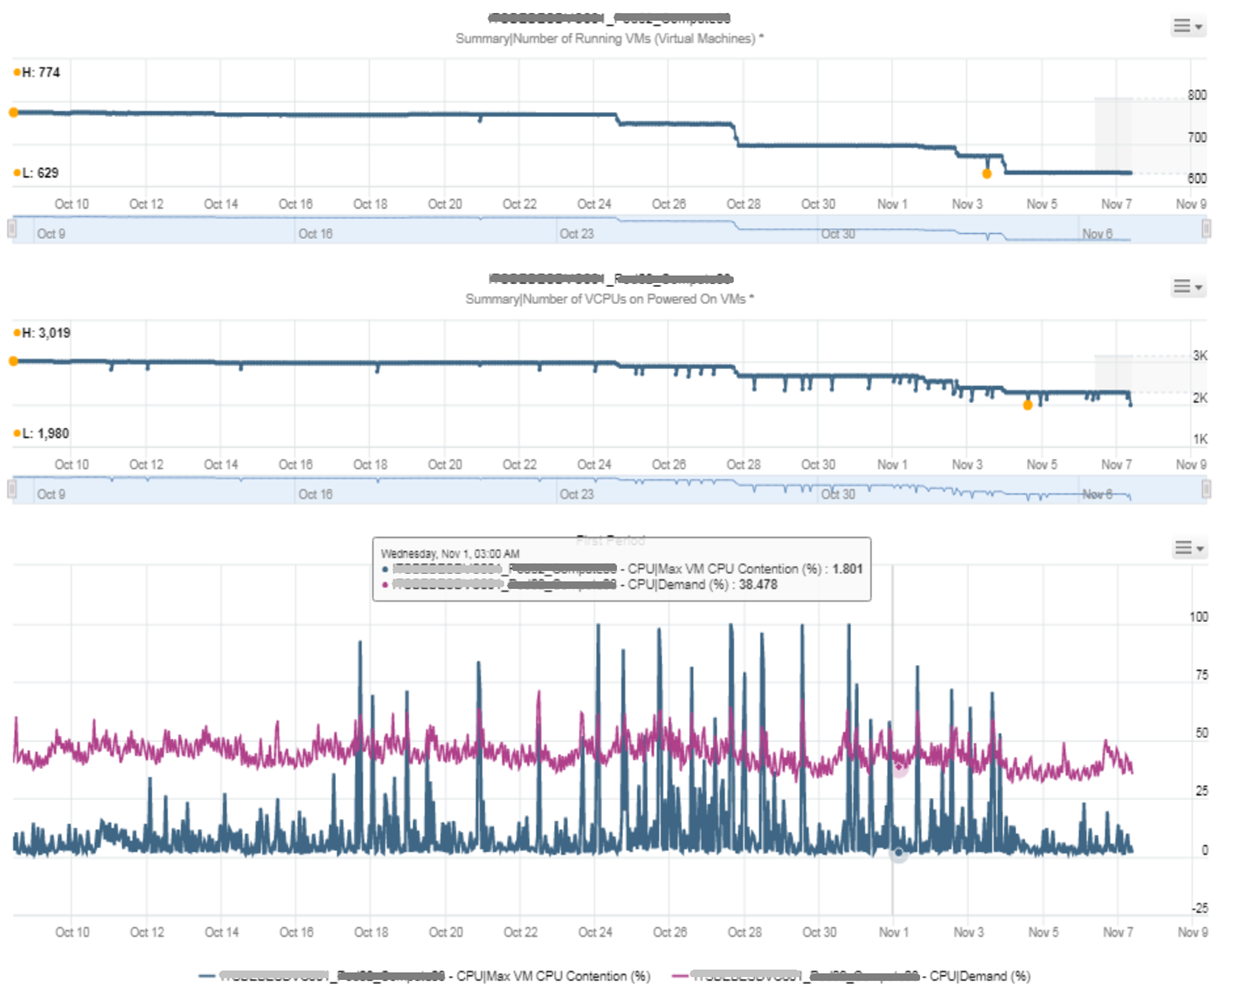
The cluster utilization was hovering around 50%. In that entire month, it barely moved. This cluster was probably 16 nodes, so 50% utilization means you can easily take out a few ESXi hosts actually.
The Max VM CPU Contention told a different story. Notice it spiked well above 75%. That impacted at least 1 VM. There were multiple spikes, leading to multiple complaints, and eventually infrastructure was forced to evacuate the cluster to fix the performance problem. Notice the counter dropped gradually in November, despite utilization remains fairly stable.
Example for Memory
We covered 2 examples for CPU. What about memory, since it’s a form storage. It’s just a disk space basically, so can VM experience contention when Cluster consume metric is not high?
I’d zoom into ESXi, so it’s easier to see. What do you deduce from this ESXi? This chart shows 1 month worth of data.
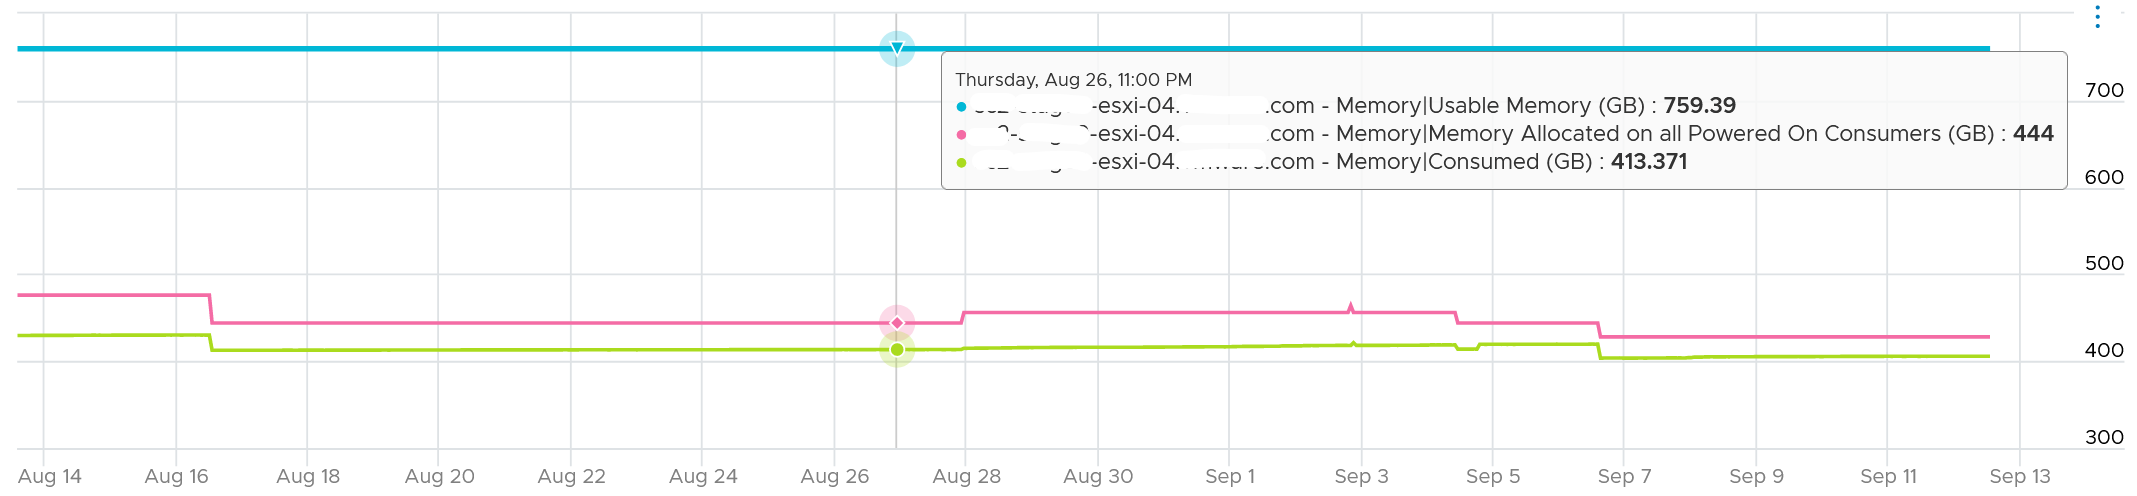
It has 759 GB of usable memory. All the powered on VM has 444 GB configured, out of which only 413 GB is mapped to physical DIMM. So there is plenty of memory left.
To confirm that it has plenty of memory, let’s plot Balloon. What do you expect?
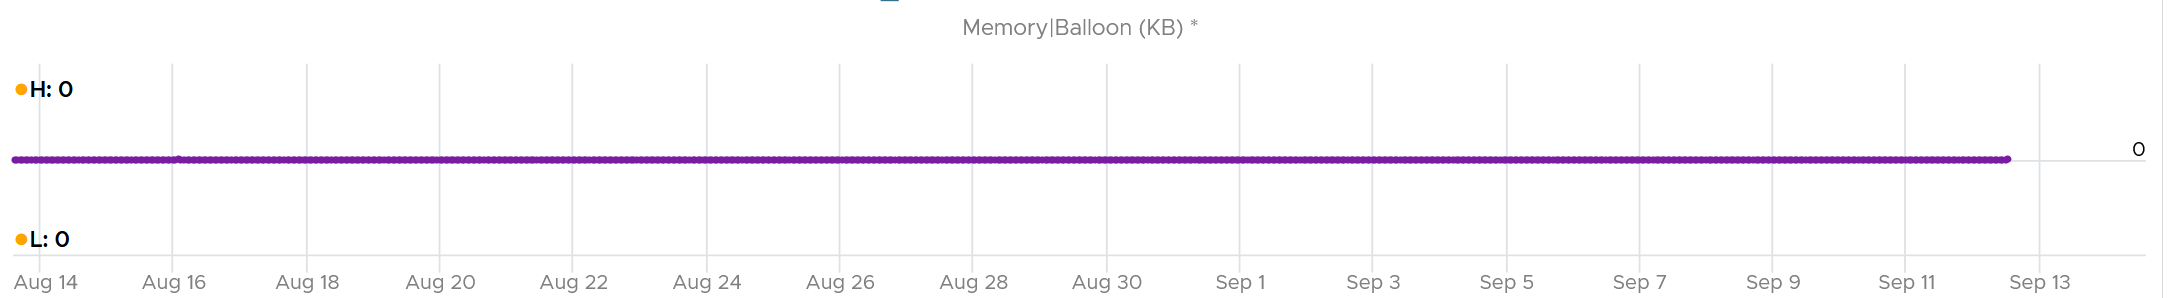
There is no ballooning. ESXi was under no memory pressure whatsoever.
So that’s the situation at provider level. How about consumer level?
VCF Operations has a metric that tracks the highest memory contention experienced by any VM in the host. This is a good leading indicator as all it takes is 1 VM, it matters not which VM.
As we can see here, there is a problem.
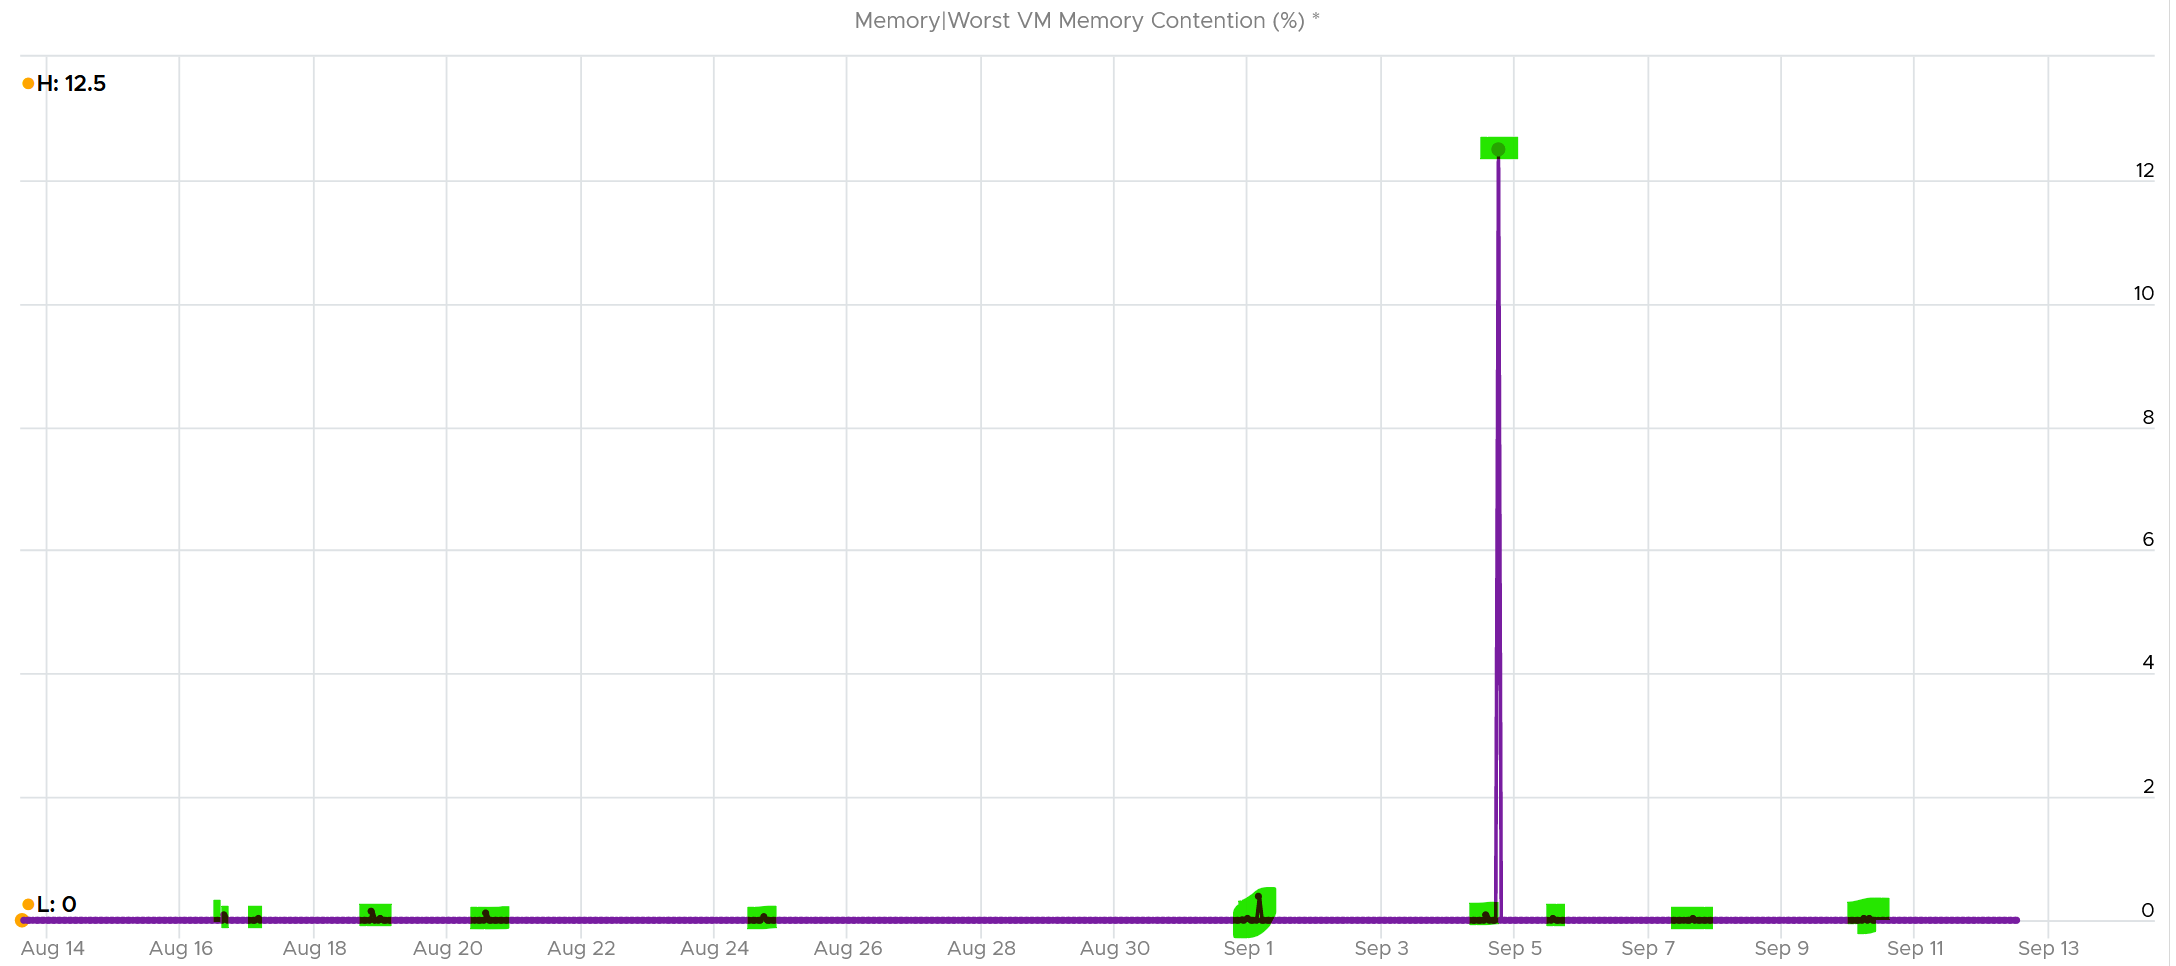
Can you explain why?
A VM experiences contention when the page is not in the DIMM. It was compressed or swapped out. Checking the compressed metric, it reveals that pages had to be brought it. Notice the swap metric lagged a bit, which makes sense.
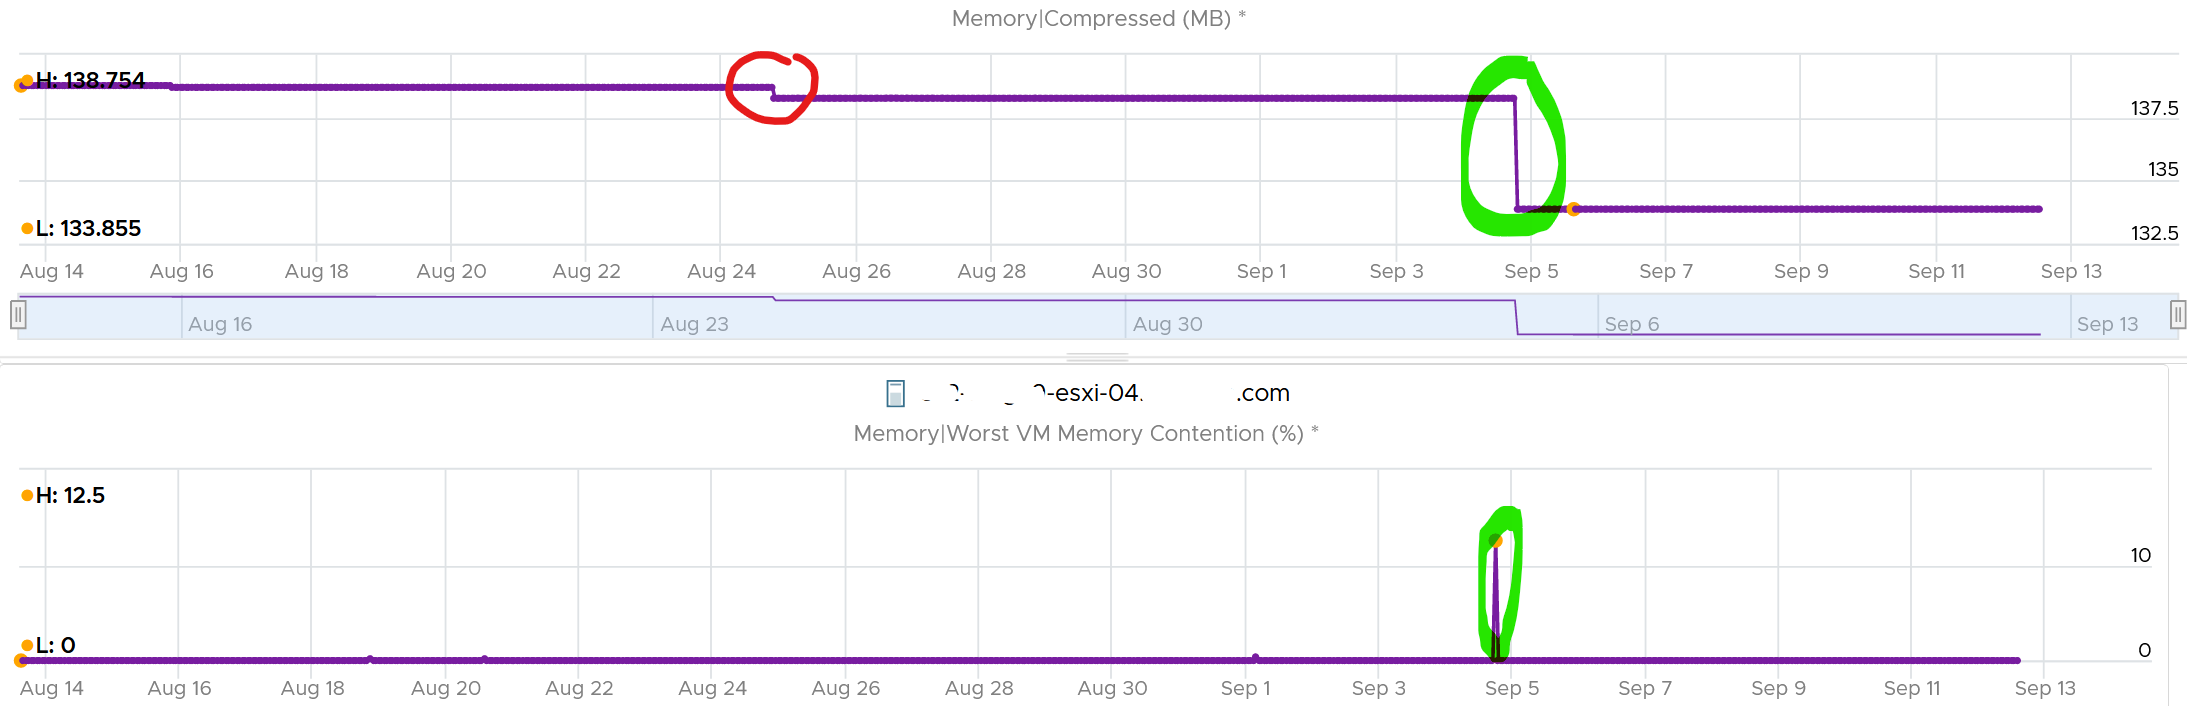
I am not able to explain the earlier dropped, the one in red circle. If you can drop me a note.
Let’s complete by plotting Swapped. I’m plotting all the way to the beginning of tracking.
It’s all 0. What happened?
That means all the pages could be compressed, so ESXi decided to compress instead of putting them into swapped file.
Now that we know it’s due to compression, we know the contention on 5 September was caused by compression. When was that page compressed, no one knows. Plotting back, the compression started around 2 August.
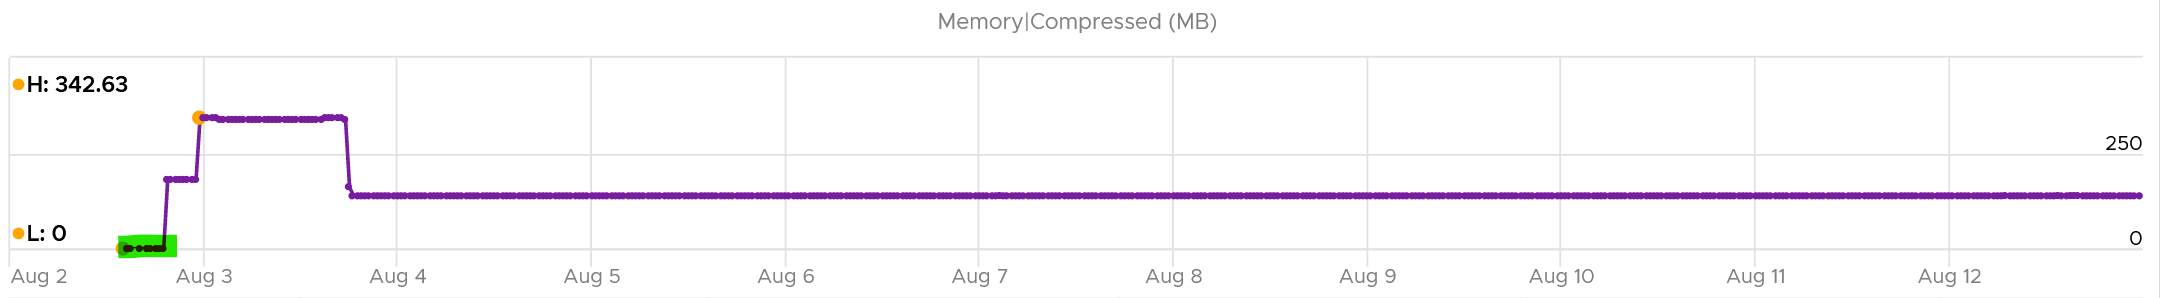
The compression was only 342 MB. Not even 0.1% of consumed memory. But if you are unlucky, it was the active VM that got hit, as in the case here.
The past is harder to debug, as we lack the ability to travel back in time and see the environment as it was. My guess here is the VM had limit, be it indirectly via resource pool or directly.
Cluster Performance (%)
We’ve covered in the VM chapter how we quantify the KPI of a single VM. How would you represent all the VMs in the cluster? Do you simply average the VM KPI (%)?
The answer is no. A cluster has a different purpose to a VM, so we need to see it from cluster point of view. For examples:
-
Contention inside a VM (this means Windows or Linux) is not that relevant to the cluster performance.
-
ESXi physical network is relevant to the cluster performance, but not to the VM performance.
A cluster is more of a group of ESXi hosts serving a VM.
The metrics are grouped into 2:
-
Breadth
-
Depth.
We cover why we need both dimensions in Private Cloud Operations book.
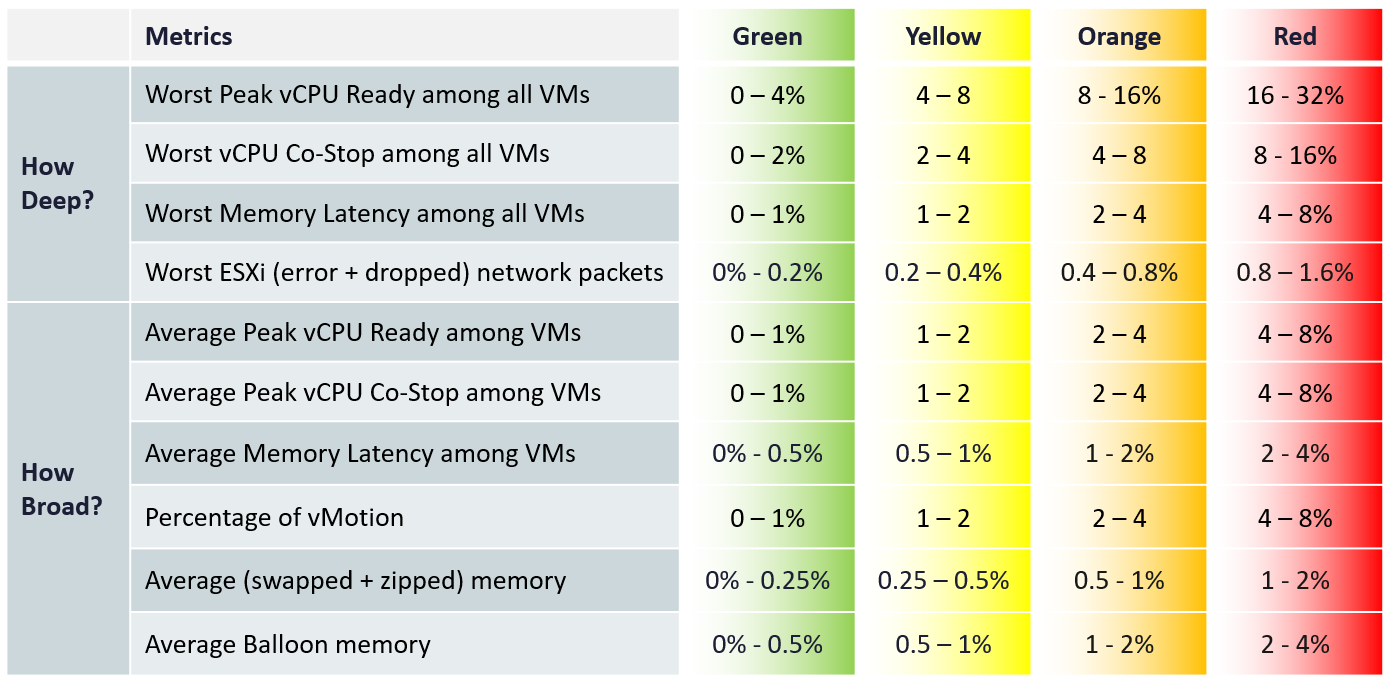
The metrics are using the 20-second peak so it does not miss short bursts. The limitation of this metric is outlier. A large cluster with thousands of VMs can easily have 1 VM having contention due to limit. One way to minimize the false positive is to set a higher threshold.
For the breadth, we use average. Ideally, we use 75th percentile instead of average. Average tends to be too late. On the other than, 95th percentile suffers from cluster imbalance. I’ve adjusted the threshold downward since I’m using average.
In a cluster with many hosts, there can be imbalance. It is not possible to aggregate at the host level first. This 2-level aggregation can result in suboptimal number. The drilling down to specific host can be facilitated with the host level metric.
Metrics
vMotion is included as it does impact the VM performance (although the end users may not notice in most cases) and it’s a leading indicator that the cluster is struggling to serve the load hence it has to shuffle the VMs around.
Take a look at this cluster. It has 488 running VMs on 16 ESXi host. Notice the percentage of VM being vMotion jumped to 5.3%, as 26 VMs were vMotion.
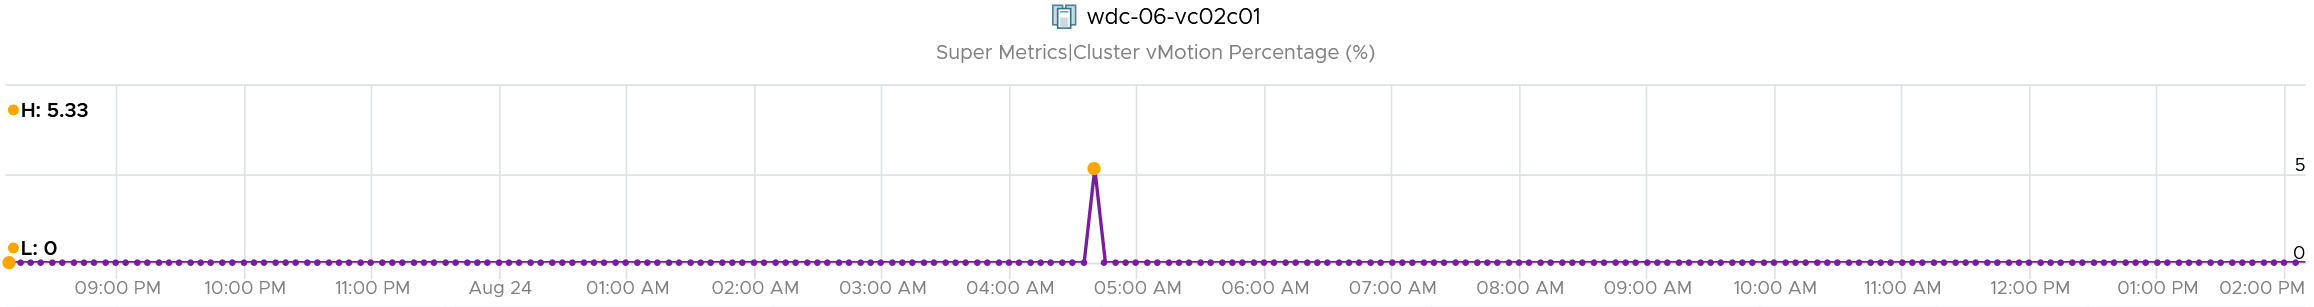
What do you think will happen to the VM CPU Ready and CPU Co-stop? 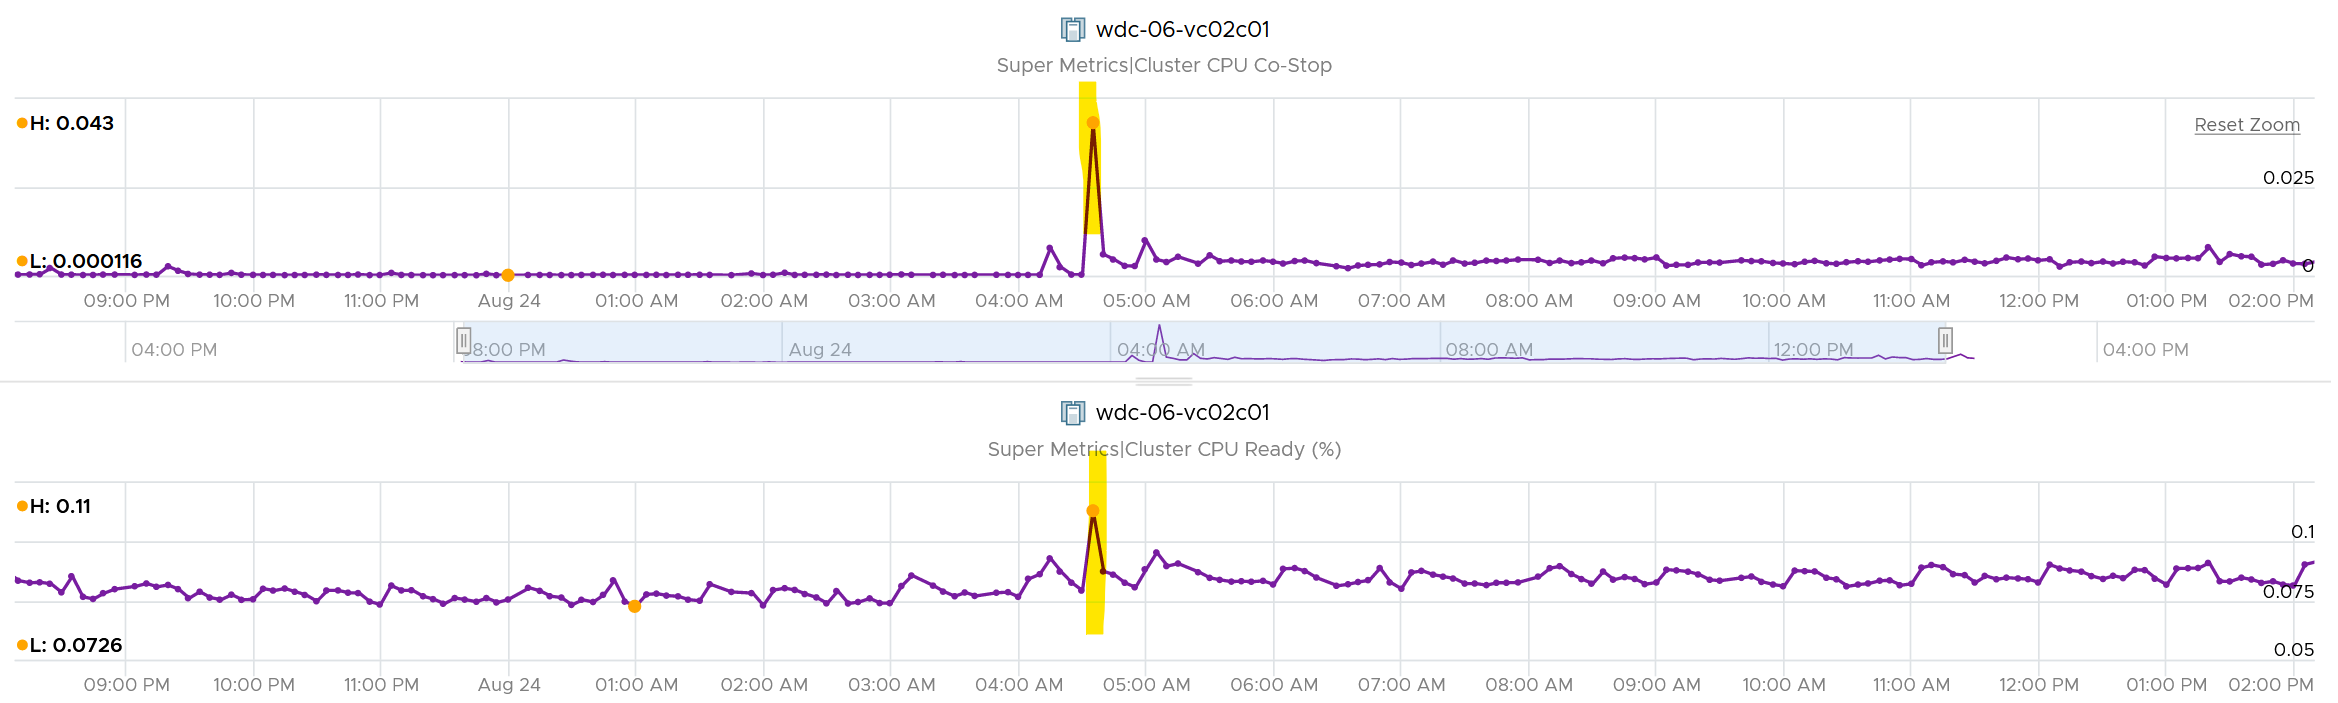
They rose. Since only 5% was impacted, the rise will be minimal.
The threshold should reflect reality. For examples:
-
While the impact on VMs is the same with Ready, using the same range for CPU Co-stop, CPU Overlap and CPU Other Wait will elevate the KPI score, as practically these 3 have lower score.
-
Dropped packet and error packets are very rare. Instead of summing them up, which will result in an average, I took the worst among ESXi host. Since many ESXi sports 25 Gb NIC, I set the threshold to be very low. On the other hand, I did not set green = 0, so the KPI does tolerate some issue.
-
Ballooning does not actually impact performance. That’s why it’s given 4x the threshold of zipped + swapped. I may change to 6x, but will have to consider large cluster. A cluster with 20 TB of RAM means 4% ballooned translates into 800 GB.
-
Ballooned, swapped, and zipped are given higher threshold as they could have happened in the past. These metrics are “sticky”. They also may not impact performance. But since many clusters sport >4 TB of RAM, I need to balance the absolute size.
Metrics Not Used
The following metrics are not included:
-
“Percentage of VM population experience CPU Ready > 1%” and “Percentage of VM population experience Memory Contention > 0%” as they measure the same purpose with the average.
-
VM utilization.\
They are irrelevant. Use the metrics at ESXi level instead.
-
ESXi Consumed.\
The higher the consumed, the better the performance. We use balloon, swapped and compressed metrics instead. Since they do not directly impact performance, we put as secondary KPI.
-
ESXi CPU Utilization.\
They do not actually impact performance. If you include them, take the highest among ESXi instead of cluster wide average, as average is too late.
-
VM DRS Score.\
The focus is on VM demand, which is not identical to performance (read: contention).\
For example: 23 VMs are running on a host. 15 VMs with low memory demand (8643MB to 66312MB) have score as 68. 8 VMs with high memory demand (132052MB to 264859MB) have the low score (< 25). The memory over-provision rate is 117%.\
Cluster DRS score = It is a weighted average of the VM DRS Scores of all the powered on VMs in the cluster.
-
Disk latency.\
Storage troubleshooting differs to compute troubleshooting. The exception here is Hyperconverged Infrastructure, as the compute and storage are integrated.
-
Percentage of VMs facing Disk Latency.\
It should be part of datastore KPI, not the cluster. The reason is if there is a population problem, you troubleshoot the datastore not the cluster(s) mounting it.
-
CPU Other Wait.\
There is a false positive. I’ve seen it hence decided to exclude.
-
CPU Overlap.\
I find their values to be very low that they might mask out other problems.
Future enhancements:
-
There are metrics that are only available in esxtop. They are not available in vCenter REST API, so they are not retrievable. Example is Local:Remote memory ratio for VM.
-
2 level roll up. This means that the cluster metrics take from its hosts instead VMs. In this way, every host is represented. Need to model the difference scenarios before we decide this solution meets the requirement better.
Implementation
The above is implemented using super metrics.
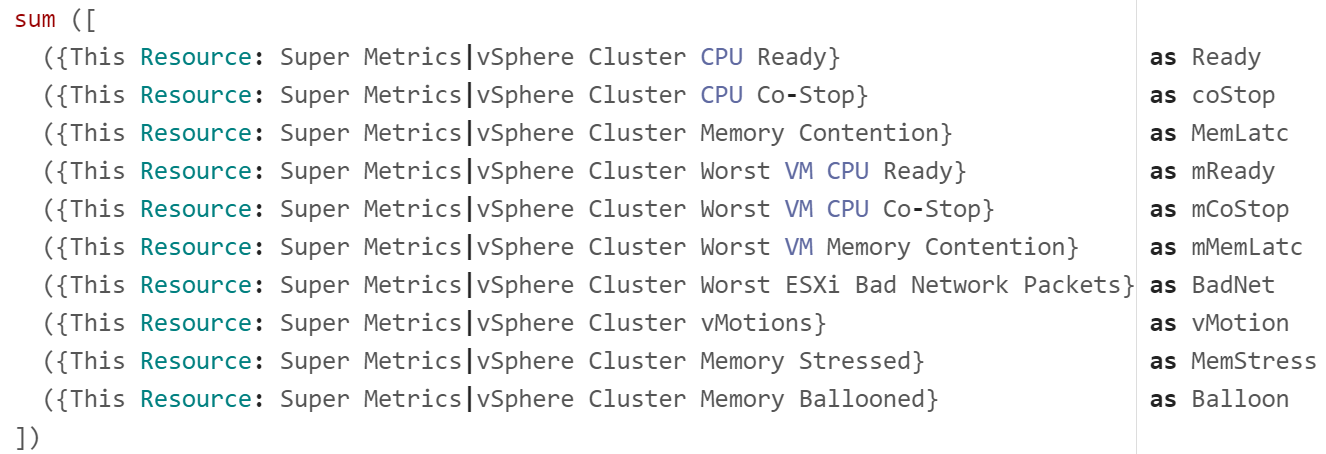
All the super metrics are fairly simple. They are simply taking the average or the maximum of either ESXi or VM in the cluster.
Something a little trickier is Ballooned (%). The formula is below.
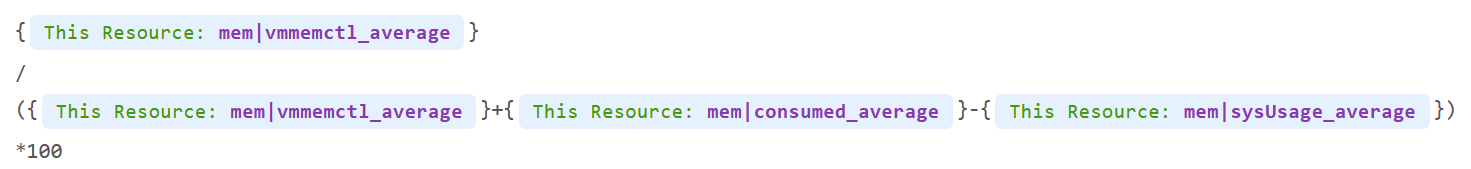
Why did I exclude kernel usage, but include ballooned?
Answer is in the Memory chapter.
Troubleshooting
At any given moment, a running VM always resides on an ESXi Host. Due to DRS and HA, it’s easier to monitor at cluster level. Since a cluster can have hundreds of VMs, you need consolidated metrics that can represent the experience of all the running VMs in the cluster. VCF Operations 8.2 provides the following metrics:
| Problem | Optimize or Remediate |
|---|---|
Worst VM CPU Ready. Worst VM RAM Contention | These are the highest value among all the running VMs. It shows you the depth of the problem. Check how many VMs are affected to see pattern. |
% VMs experienced CPU Ready % VMs experienced RAM Contention | Since it’s impacting many VMs, the problem is likely not at VM setting, but at ESXi or cluster level. Some possibilities:
Imbalance could be due to
|
| vSAN CPU Ready | It’s not something you can change, unless via ESXi advanced settings to modify the kernel scheduler behaviour? |
| ESXi Error Packets | Check the vmnic driver and firmware |
Service Level Metrics
These metrics require the understanding of how SLA, SLI and KPI differ. They are covered in-depth in Part 1 of VMware Operations Transformation book. Their implementation require VCF Operations super metrics and custom dashboard.
Cluster SLA
How to roll up the VM SLA into total SLA for the whole environment? Your CIO likely wants to see this number over time.
Calculating SLA per vSphere cluster also makes management easier. You know which cluster to attend to. The problem is SLA is a lagging indicator. It is based on the last 30 days or the last month.
Cluster SLA is derived from the VM SLA. It is simply the percentage of VMs that fail the SLA. How bad each VM fails the SLA, or how comfortable it exceeds the SLA, is irrelevant at this stage. At the cluster level, you care about pass/fail first.
That means the Cluster SLA is not the average of its VM SLA. Doing an average can be too late unless your SLA is 100%.
Once you know how many VM fails, you want to know who the VMs are and troubleshoot if there is a common reason.
Cluster SLI
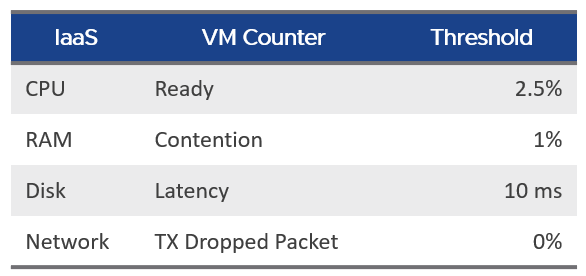
SLA is a 30-day counter. You can’t wait that long before you do something. This is where SLI comes in. It’s an indicator, and not mentioned in the SLA contract.
Let’s take an example of a cluster with 500 VM. Each VM consumes 4 IaaS resource (CPU, Memory, Disk, Network). It must pass all else it’s counted as 1 SLI fails.
The Cluster SLI (%) is simply the percentage of VM that fails the SLI. As a recap, this is the single threshold we use for all classes of service:
It’s a normalized average of the VM SLI, taking into account the actual SLI failures. That means it will give a lower number if the VMs are experiencing worse SLI individually. 1 VM experiencing 4 SLI failure will result in the same value as 4 VM experiencing 1 SLI value each.
The formula is
100 –
(
( Sum([VM]Performance|Number of KPIs Breached) + Sum([Pod]Performance|Number of KPIs Breached ) )
/
( Summary|Number of Running VMs + Summary|Number of Pods ) * 100 / 4
)
Capacity
Now that you’ve reviewed the raw metrics, let’s apply them into capacity management.
vSphere Cluster capacity is often misunderstood, as there are multiple considerations.
-
On the supply side, you have total capacity and usable capacity. Both have nuances.
-
On the demand side, you have utilization, reservation, allocation, and unmet demand.
-
The kernel impacts both the supply side and demand side. Be careful of double counting!
-
Lastly, CPU, memory, storage, and network have different natures.
Key Metrics
The essential metrics of capacity are
-
Total Capacity
-
Usable Capacity
From the first principle, the total capacity and usable capacity should not be a variable as it makes capacity management impractical. Your 100% should always be a constant so you have a stable anchor. This makes cost accounting less debatable too.
Total Capacity
To define total capacity, first determine whether its value is fixed or not.
If it’s not fixed, the next question is whether the change is Scale Up or Scale Out.
-
Scale Up happens on a single object. Example is the just in time capacity such as storage LUN, where the size can be increased on the fly or upon request.
-
Scale Out happens on a cluster of objects. The cluster members or nodes are typically identical in size. Examples are K8 cluster, K8 Workload, Horizon VDI Pool, and VMC vSphere Cluster. Scale Out is more popular than scale out as it’s cheaper. It does not work when the data can’t be partitioned.
Total capacity becomes dynamic only if you intentionally change the numbers. Some examples:
-
Horizontal auto-scaling solution such as VMware on AWS
-
vSphere Distributed Power Management.
Usable Capacity
Usable Capacity is an imaginary number that you get after deducting total capacity with the portions that capacity team decide to exclude. The number is non-real as actual utilization can exceed it.
Usable Capacity has to be a stable number. Having a volatile value over time makes capacity management hard. The cost of complexity is not worth the accuracy.
Let’s use vSphere Cluster as example.
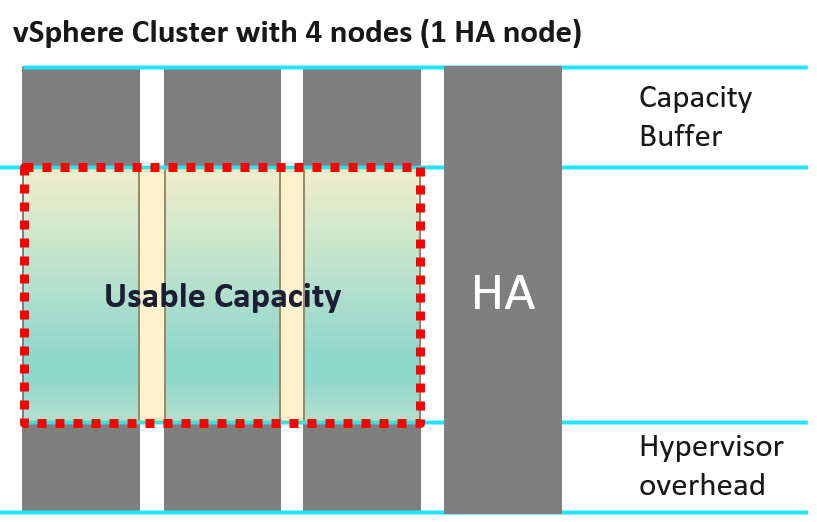
In general, there are 3 components that need to be excluded to form usable capacity.
Usable Capacity = Total capacity – Availability protection - Overhead – Buffer
Let’s look at each:
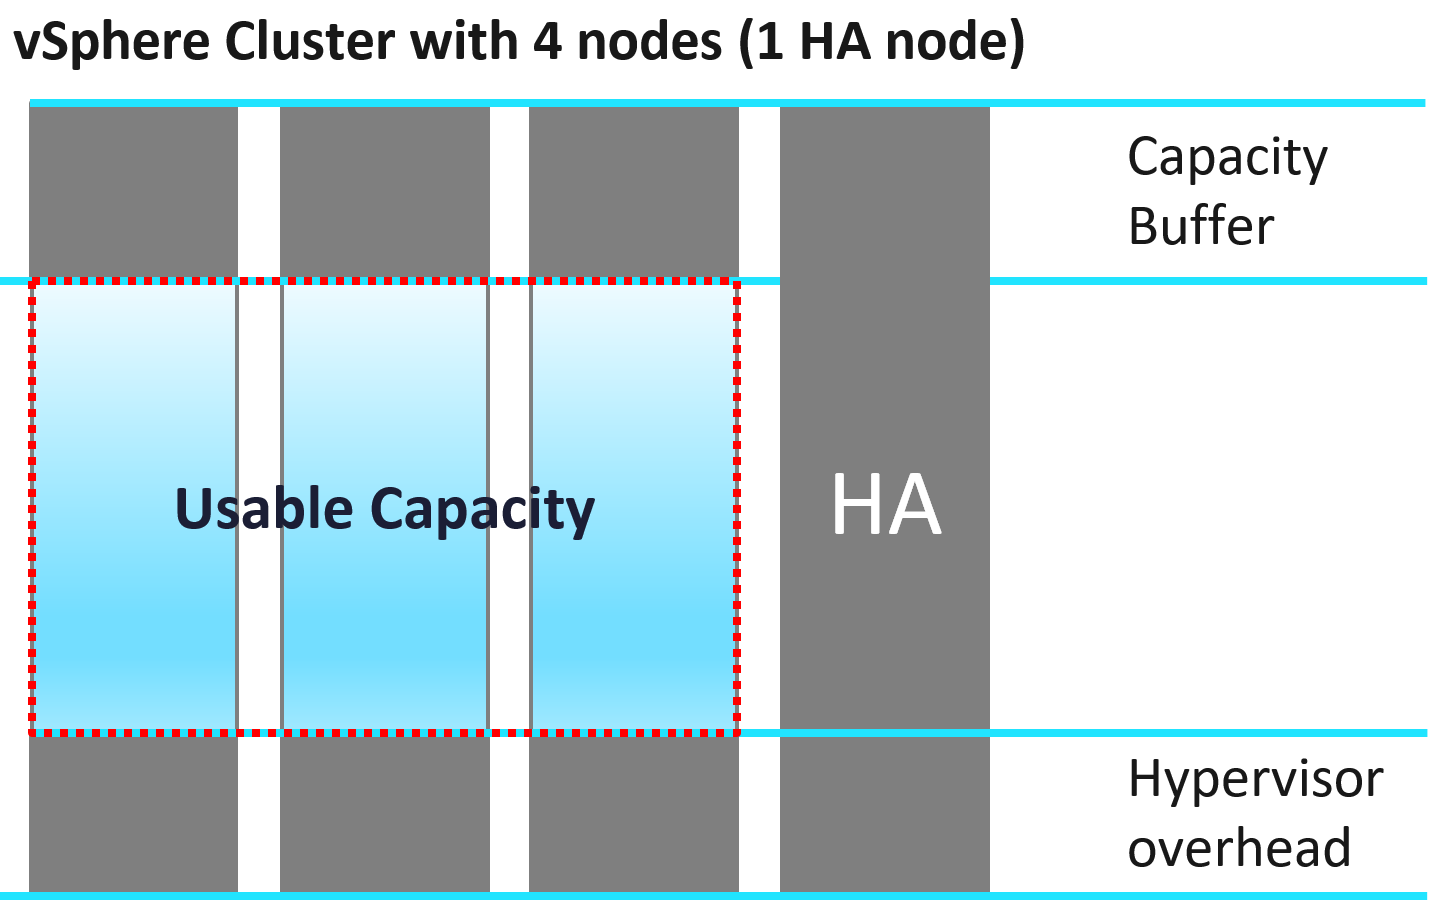
| Availability protection | This covers both local availability (HA) and disaster recovery. For hardware, this means the part that is added to cater for unavailability period. Common examples are RAID in disk, hot spare in storage array, vSphere HA in vSphere Cluster. Many hardware deployments come in a pair (e.g. network switches) because one of the nodes is for availability, not capacity. In vSphere Cluster, you typically design with at least 1 host as spare, so you can perform maintenance, upgrade without service degradation. While this host is actively participating in reality, you exclude this in your usable capacity. In Kubernetes, there is no such thing as HA as the node itself is transient. |
|---|---|
| Overhead | Overhead is part of the system architecture and can’t be avoided. In the case of ESXi, this is the hypervisor. This portion is not available for “consumer” or business workload. Examples:
|
Let’s apply the above concept into vSphere:
| ESXi Usable Capacity | Usable Capacity = Total Capacity – Hypervisor. |
| Hypervisor = VMkernel + vSAN + NSX + vSphere Replication | |
So what amount should we put for the hypervisor? It turns out that it’s not an easy answer. We will dive in later on. | |
| Extracting the hypervisor portion as a separate value has a bonus as it can be used use cases involving 2 different ESXi hosts, such as migration from non VCF cluster to a cluster running both vSAN and NSX | |
| Cluster Usable Capacity | Cluster is not a matter of adding the ESXi. There are 2 cluster-level settings:
|
| Be careful in aggregating as overhead and availability overlaps. Reason is your HA node contains overhead too |
Applicability
The formula for Usable Capacity depends on the model.
| Model | HA Host | Hypervisor | Buffer |
|---|---|---|---|
| Allocation | Included | Included | Included |
| Utilization | Included | Cannot be included as values are too volatile for capacity management | Included |
| Reservation | Included | Included |
Buffer
Buffer is a business decision and it’s optional.
It’s calculated based on capacity after HA, and not on the total capacity.
Peak utilization is often used as the reason to have buffer. The actual reason behind is performance avoidance. Since it’s about avoiding the contention from happening, the contention counters cannot be used. Take for example, a large cluster (could be vSphere, Kubernetes, or Horizon) where imbalance can happen among the cluster nodes. You have witnessed that it happens at say 95% utilization. In order to avoid that, you set buffer at 10%, effectively setting the usable capacity at 90%. This in theory gives you 5% buffer, as the last 5% can be measured using contention counter.
Disaster Recovery is a valid use case for buffer. Some examples are:
-
A pair of vSphere Clusters protecting each other in a DR pair.
-
A production cluster and DR cluster. The DR cluster typically run test and development workload, which will be powered off in the event of DR drill or actual DR.
-
A stretched cluster.
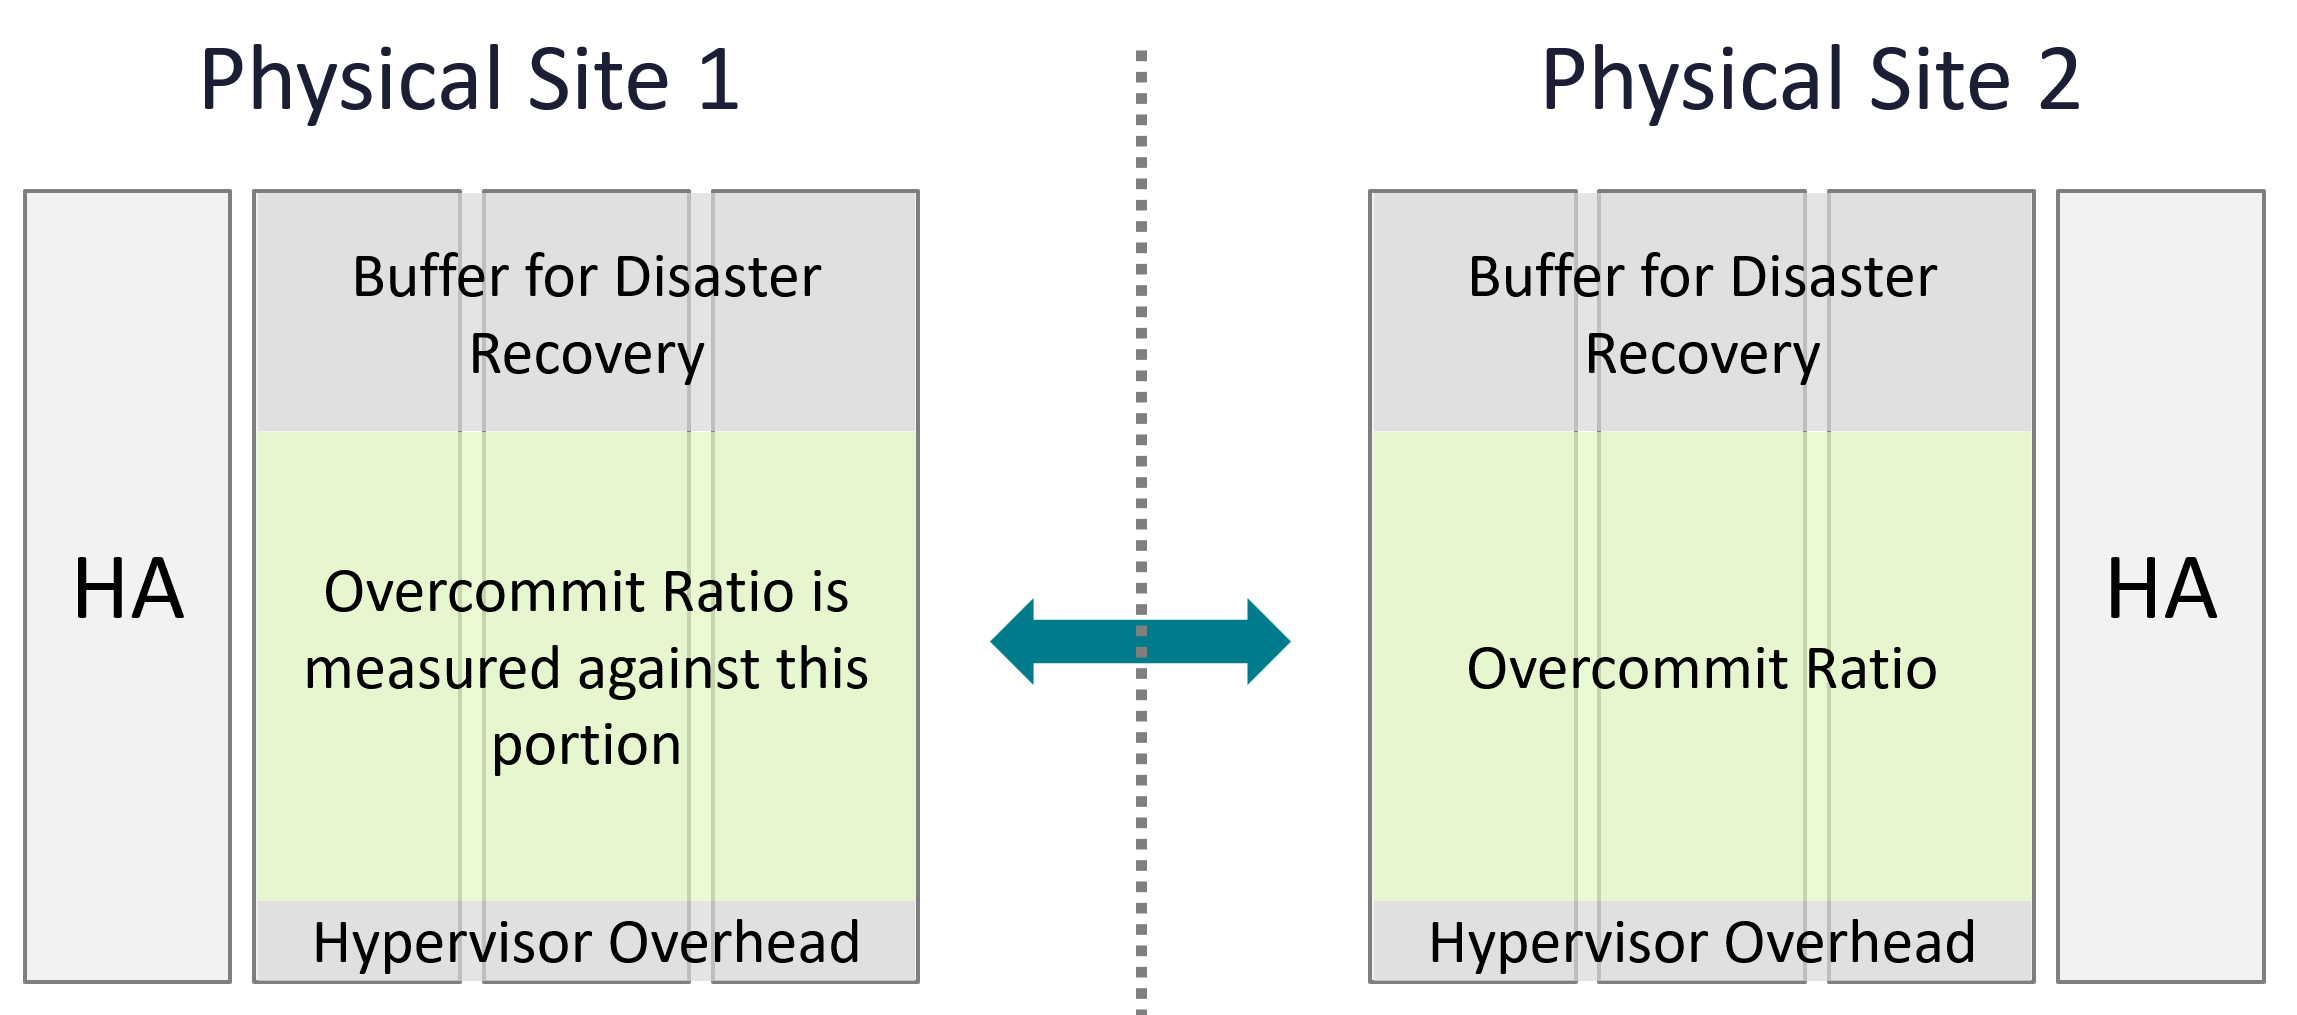
Let’s elaborate the first example
-
Say you design a pair of 10 node cluster to protect each other. Each has 9+1 set up for HA to give you room to do the usual cluster maintenance and upgrade.
-
You want to limit the utilization of each site at 50% of the 9 hosts. This translates into 45% utilization on each of the 10 hosts, if there is no imbalance.
-
To monitor the above, you set 50% buffer on the capacity after HA. That means the actual formula is (Total – HA) x Buffer.
-
Now, since the VMs typically run well below their configured size, you use allocation model and cap it at say 3:1.
-
To complicate matters, say 60% of the workload can be turned off during DR. In this case, you allow utilization to reach 160%.
Demand
In capacity management (as opposed to in performance management), Utilization and Reservation form a single input for each consumer. We call this Demand.
Demand = Max (Utilization, Reservation)
For example, a VM that uses 4 GHz but reserve 5 GHz should be considered as having 5 GHz, as that extra 1 GHz is guaranteed for that VM.
A restaurant analogy will make the above clearer.
-
Your restaurant has 2 floors. Equal capacity.
-
First floor is full of diners eating.
-
Second floor is empty, but it has been reserved for wedding. It’s paid for.
-
The question is: Is your restaurant full?
-
Well, it depends on who is entering. If it’s a guest wedding, the answer is no. If not, the answer is yes.
-
That means for each guest, you need to ask if he has reservation or not.
Demand will reach 100% before the real utilization hits 100% because of 2 reasons:
-
it is compared against usable capacity, not total capacity.
-
it takes into account unmet demand, such as reservation. Demand is the highest of utilization and reservation. For VM, this needs to be calculated at individual VM, before being summed up at the ESXi level. Only powered on VMs are included. While the VM that is already provisioned can be turned on anytime, including them will result in overly conservative capacity.
Implementation wise, there is a challenge as the above only includes the VM. The kernel
Allocation Metrics
Overcommit Ratio
Overcommit Ratio does not include buffer. The following diagram makes it clear.
Overcommit ratio looks simple on the surface. As we dive deeper, it’s not as straight forward. For examples:
-
CPU hyperthreading.\
This can be turned on and off. Should the ratio change accordingly? Do we consider it since there are only 2 threads per core? Latest CPU has >100 cores but each has only single threads.
-
Datastore. Do you consider the space used by snapshot since overcommit is based on allocation? How about the availability protection created by vSAN?
To answer the question, remember that allocation model does not consider utilization. Since allocation is about allocating to consumer, the provider part should be excluded too.
| CPU | Include hyper threading. The reason is a VM vCPU maps to a thread, not core. |
|---|---|
| Yes, hyperthreading impacts performance, but overcommit is about capacity. Also, you can simply change the number. Instead of saying 8:1 to a core, you say 4:1 to a thread, with HT enabled. | |
To mitigate the performance impact, simply get a CPU that is 60% faster. Example:
| |
| Take note a lot of education is needed. When your tenants buy 4 GHz CPU from you, they expect 4 GHz, not 2.5 GHz (62.5% throughput). Since you enable HT, one way to simplify the message is to say the CPU speed is 2.5 GHz. | |
| Disk | For datastore, only consider the VM virtual disks. Exclude other VM disk space such as snapshot and memory swap. If you have a lot of snapshots and high memory overcommit, this can result in higher actual disk space consumption. |
| If the datastore is vSAN, exclude the vSAN availability protection (Failure To Tolerate). The downside of this is the overcommit ratio may fail to serve its purpose, which is to give early warning before actual utilization happens. So set a lower number, matching to the FTT setting. For example, if your FTT doubles the disk space consumption, then your overcommit ratio has to be halved. | |
| Network | For physical switch, exclude the inter-switch link. For ESXi, only include the physical ports used by the VM. |
Projected Metrics
Capacity Remaining (%) and Time Remaining (days) metrics need to be reviewed together, because the ideal situation is the object (VM, cluster, etc.) is low capacity remaining yet high time remaining.
Capacity Remaining
Capacity Remaining (%) metric is a complex metric as it depends on the time. Let me use an analogy as it’s easier when the demand has end date
You operate a restaurant business. It has 100 seats.
It’s 4 pm in the afternoon, and you have plenty of seats as it’s not a busy hour. But you’re fully booked for dinner.
What is your Capacity Remaining (%)?
The answer is it depends on what time.
What is your Time Remaining (Days)?
The answer depends on your projection.\
If you only reject a small percentage of customers and the additional potential revenue is not worth the capital expansion, your Time Remaining is forever.\
If you reject enough customers and foresee demand will grow, you take the risk of adding more capacity. In this case, your time remaining is 0 days.
The Capacity Remaining (%) metric is a projected value, 3 days into the future, hence it might differ with currently used capacity. The 3-days is hardcoded, not something you can change. No, it does not and should not care about the future demand, even though they are already committed.
As it is a future value, there is confidence band. You can choose between aggressive (based on the upper limit of the band) and conservative (based on the actual trajectory).
Note that the value of will be set to 0 if during the given collection cycle the demand breaches the usable capacity. This is because at that moment there is really no capacity. This can cause fluctuating value of Capacity Remaining metric if the load regularly touches the usable capacity threshold.
Take note that CPU Capacity Remaining (%) and Memory Capacity Remaining (%) appear in the policy as enabled but cannot be used. That’s an internal metric which should have been hidden.
Time Remaining
It measures the number of days before capacity runs out. For conservative projection, this measures the time required from now to when the upper confidence interval of Long Term Forecast intersects/crosses Usable Capacity. The projection is up to 1 year, with time remaining above 1 year is simply shown as 1 year.
Formula wise, it’s based on the utilization metric. It’s not a projection of the Capacity Remaining metric. But should it be? Let me know your thought!
Hypervisor
| Why Hypervisor? | Why not use the word kernel or VMkernel? |
| The hypervisor is more than kernel. There are user-level or application that is runs on top of the kernel. | |
| The word kernel is often mistaken with VMkernel. VMkernel does not include vSAN & NSX as they are not traditionally considered part of kernel. vSAN for example has processes parked under /opt resource group | |
| Capacity or Performance? | Why do I put hypervisor under capacity, and not performance? |
| Because operationally, the metrics impact capacity management. Since the hypervisor gets the highest priority, you do not monitor the metrics from performance viewpoint. If you need to see the ready time for each of the kernel process, see esxtop. |
Kernel does not have allocation as it’s an OS process.
The hypervisor has 3 types of metrics:
-
Reservation
-
Limit
-
Utilization.
Which one do you use?
-
Utilization is not feasible as it changes by the seconds. Just like total capacity cannot be volatile, the same goes with usable capacity.
-
Limit does not even make sense as certain features of hypervisor impacts all VM, hence should take higher priority.
-
Reservation tends to be too low if you run vSAN and NSX, and too high if you only run ESXi. It also fluctuates over time, giving you unstable usable capacity.
The last option is to manually include a static value when calculating the usable capacity. This means we need to know the amount.
Metric Type
ESXi scheduler uses share, limit and reservation to manage its worlds. Broadly speaking, there are 2 types of worlds:
-
VM
-
Non VM
You will see 3 types of metrics in the vCenter UI:
| Type | Analysis |
|---|---|
| Utilization | This is the actual, visible, consumption. It can be lower than reservation, but not higher than allocation. |
Since you’ve already paid for the hardware, you want to drive ESXi utilization as high as possible so long there is no contention. Since the hypervisor has higher priority than VM, we can safely assume we can use VM contention as the proxy for overall contention (assuming manual VM Limit is not set). The ESXi utilization metric considers both the hypervisor and VM. There is no need to separate the hypervisor in this case. The only time we need to separate is when we’re migrating the VMs into another architecture. | |
| Reservation | For the hypervisor processes, the maximum amount is taken care of by allocation, while the minimum amount is by reservation. This is a safety mechanism to ensure the hypervisor can still run when all the VMs want 100% resource. Processes that run at hypervisor level does not get its reserved memory up front. It’s granted on demand. CPU, being an instruction in nature, does not use the reserved amount unless it needs to run. If you plot in vSphere Client UI, you will see the value of utilization can be lower than reservation. |
| Allocation | For VM, allocation is useful as there is overcommit between virtual and physical. For the non VM, it is not useful since there is no overcommit because there is no virtual part. You notice that some hypervisor processes have no limit. If you plot them in vSphere Client UI, you will find their limits are either blank or 0. |
The above 3 values vary over time. Why is it hard to determine the size of the above 3 values up front?
Taking from page 258 of Frank Denneman and Niels Hagoort’s book, with some changes:
-
Some services have static values (allocation and reservation) regardless of the host configuration. Ok, this is the easy part.
-
Some services have relative values. It scales with the memory configuration of the host. Ok, that means you need to know the percentage for each.
-
Some services have relative values that are tied to the number of active VMs. Ok, that means you need to know how many VMs are active.
-
Some services consume more when they do more work. Example is storage and networking stack.
-
Some services consume more depending on the configuration. For example, vSAN consumes more when you turn on dedupe and compression.
Since an ESXi host has many services, it is impossible to predict the overall values of the above 3 metrics.
Grouping
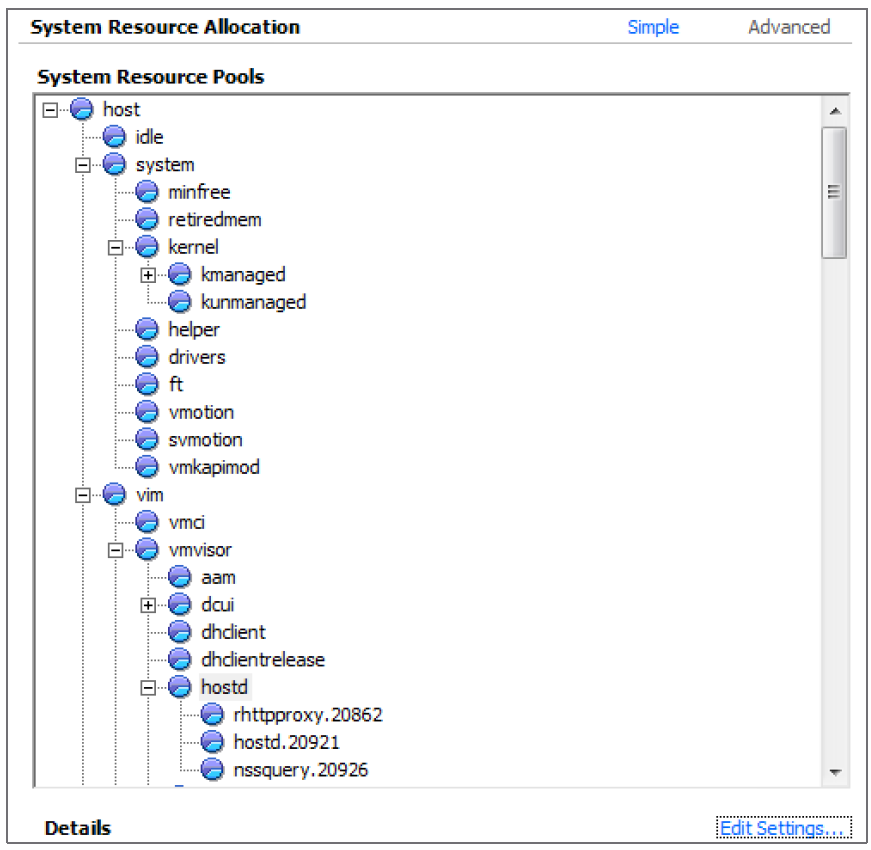
All the processes that run in the hypervisor belong to one these 5 top-level resource groups[^20]:
| System | host/system resource pool for low-level hypervisor services and drivers. You will find world such as minfree, kernel, helper, fault tolerant, vmotion, storage vmotion, vmk API mod, idle, and drivers. Doing multiple vMotion simulaneously will increase the consumption of vmotion resource. The data plane portion of vSAN is reported here, although there is no separate counter for it. |
| VIM | VIM = virtual infrastructure manager. vmvisor = hypervisor. This include NSX, and vSAN management plane. host/vim resource pool for host management process such as HA (aam), vCenter agent vpxa, hostd, VIM user (the group for DCUI, shell, SSH, Tools), authd, tmp, envoy, GPU Manager, ESX tokend, healthd |
| User | host/user resource pool All the running VMs are children of the User resource pool. This includes the VM overhead as it’s part of the VM. There is no breakdown for this pool. The only metric is host/user. vSphere Client UI does not display the CPU or memory reservation metrics. |
| Opt | Mostly vSAN. You will see it as opt/vsan. An example of process will be vsan/vsanperfsvc for the performance monitoring. Added in vSphere 8.0.1 |
| IO Filter | host/iofilter resource pool The IO Filter processes are grouped here. The generic framework allows 3rd party partner software to intercept and process network and storage IO. More about it at vSphere manual. Just search for “About I/O Filters”. If you are unsure, read this by Ken Werneburg. Note: vSphere Client UI does not display the CPU or memory reservation metrics. |
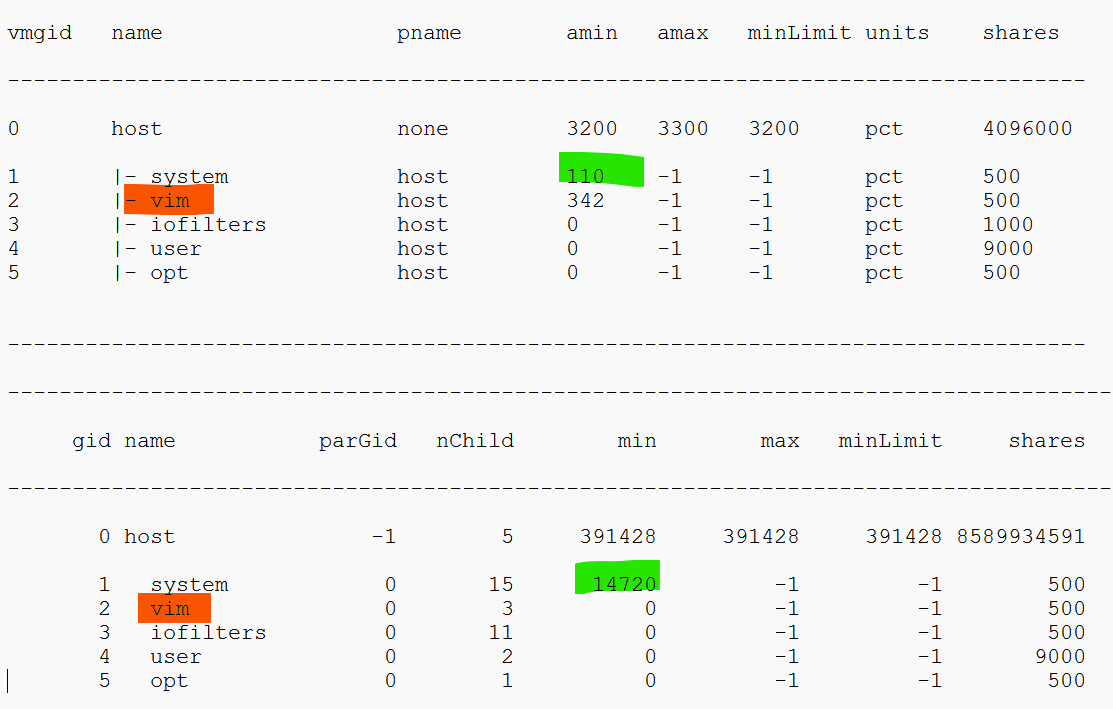
In the older version of vCenter, you could see the structure. The dialog box is no longer available in the present vCenter UI. I’ve made the screenshot smaller as the details has changed, so this is just to show the idea.
Relative Comparison
You will notice major differences in the way the resource groups consume resources.
| | | |
|----|----|----|
| | CPU | Memory |
| System | Surprisingly low. It can be well below 1 GHz. | Relatively high. It’s ~20 – 30 GB depending on the ESXi |
| VIM | Relatively high. It’s around 4 – 12 GHz depending on the ESXi. | Surprisingly low. It could be even 0 GB. |
Metrics
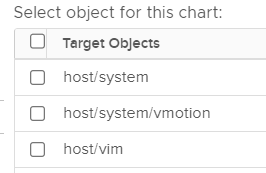
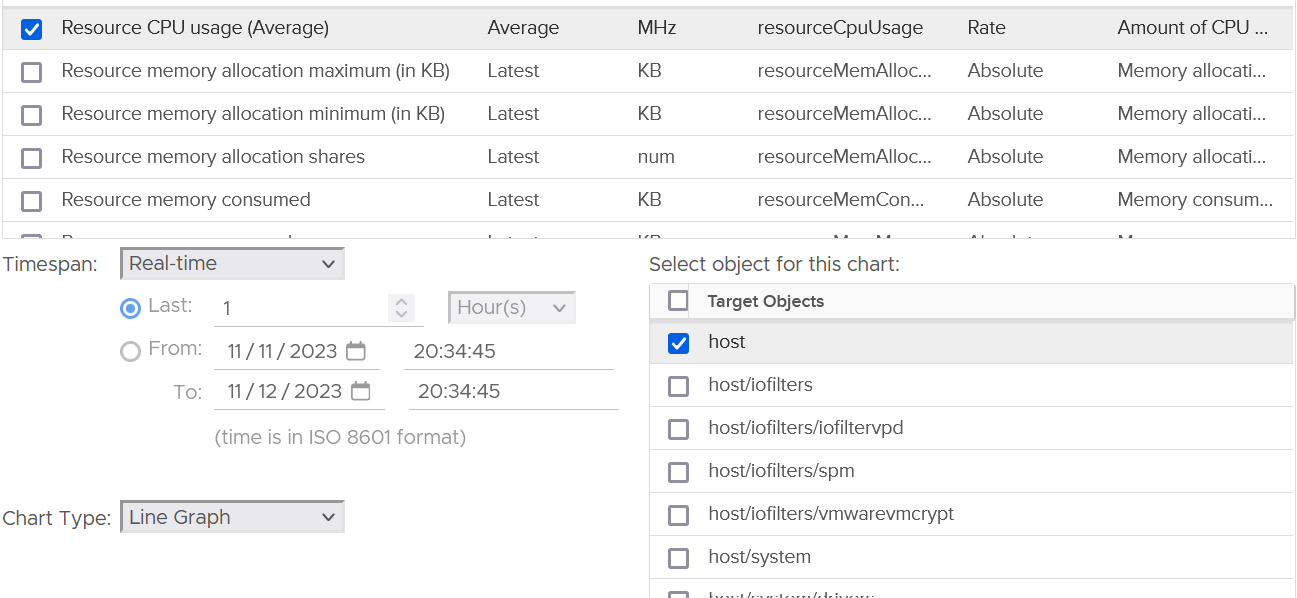
In the vSphere Client UI, you will see the list of resource grouping in the Target Objects section in the performance chart.
I’ve highlighted them in the following screenshot:
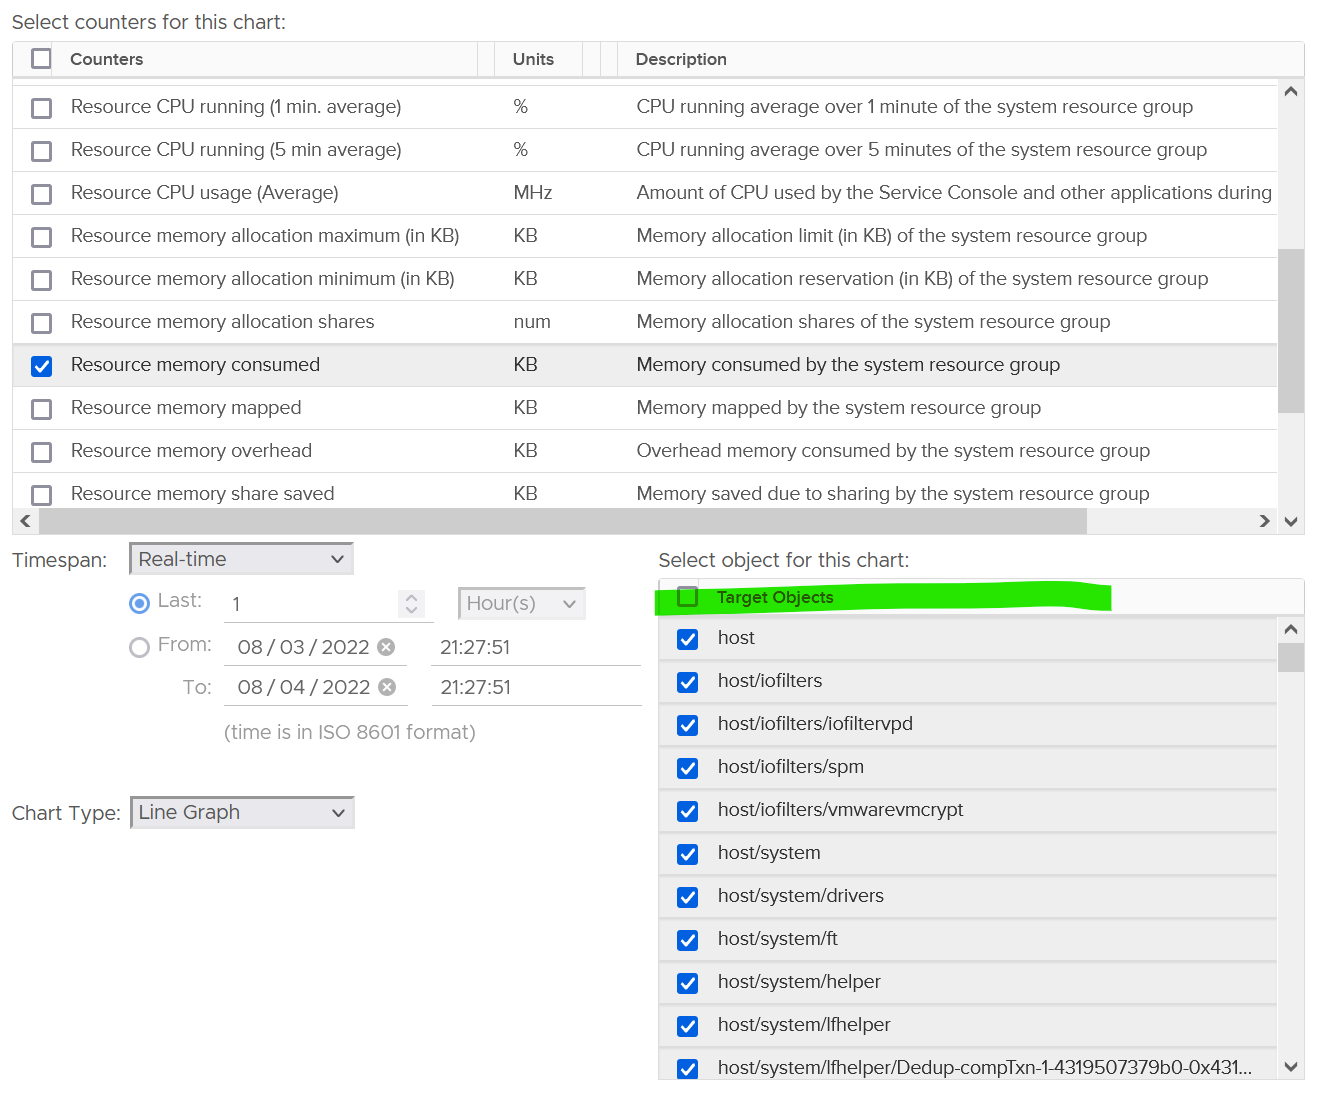
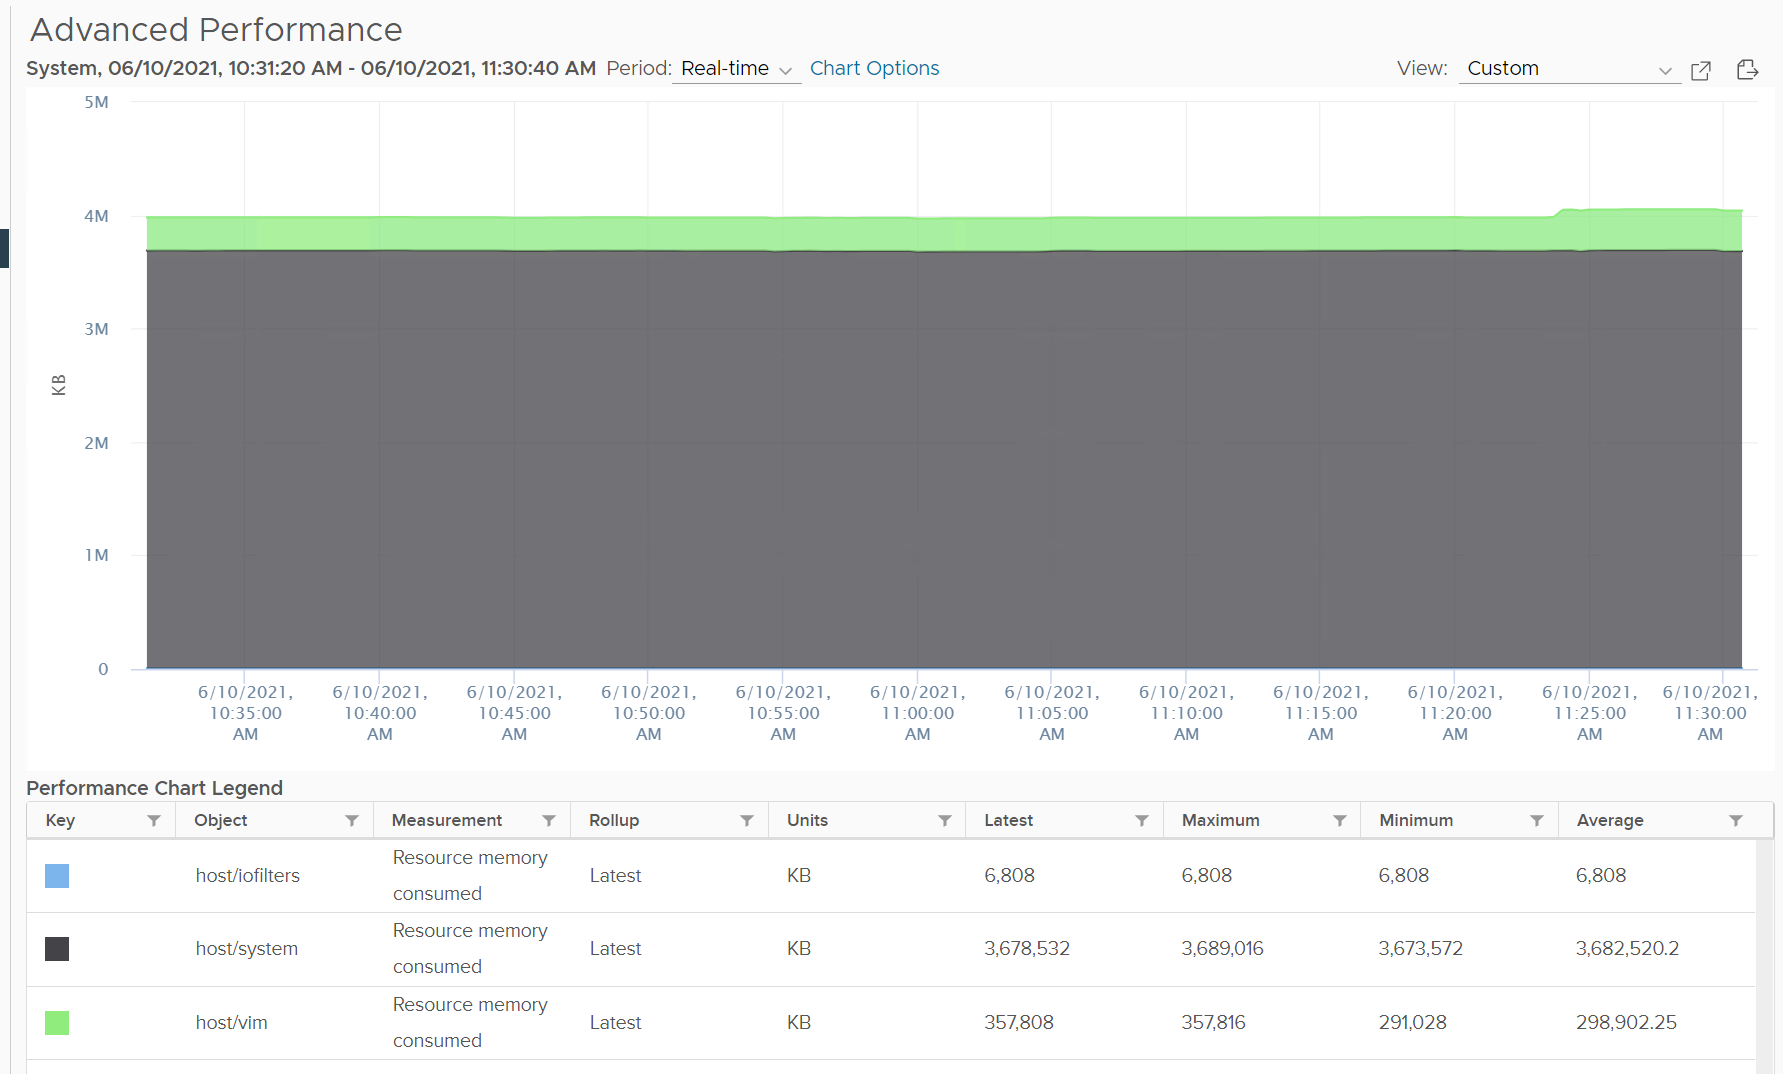
To see the kernel consumption, select only these 3 from the list above:
-
host/iofilters
-
host/system
-
host/vim.
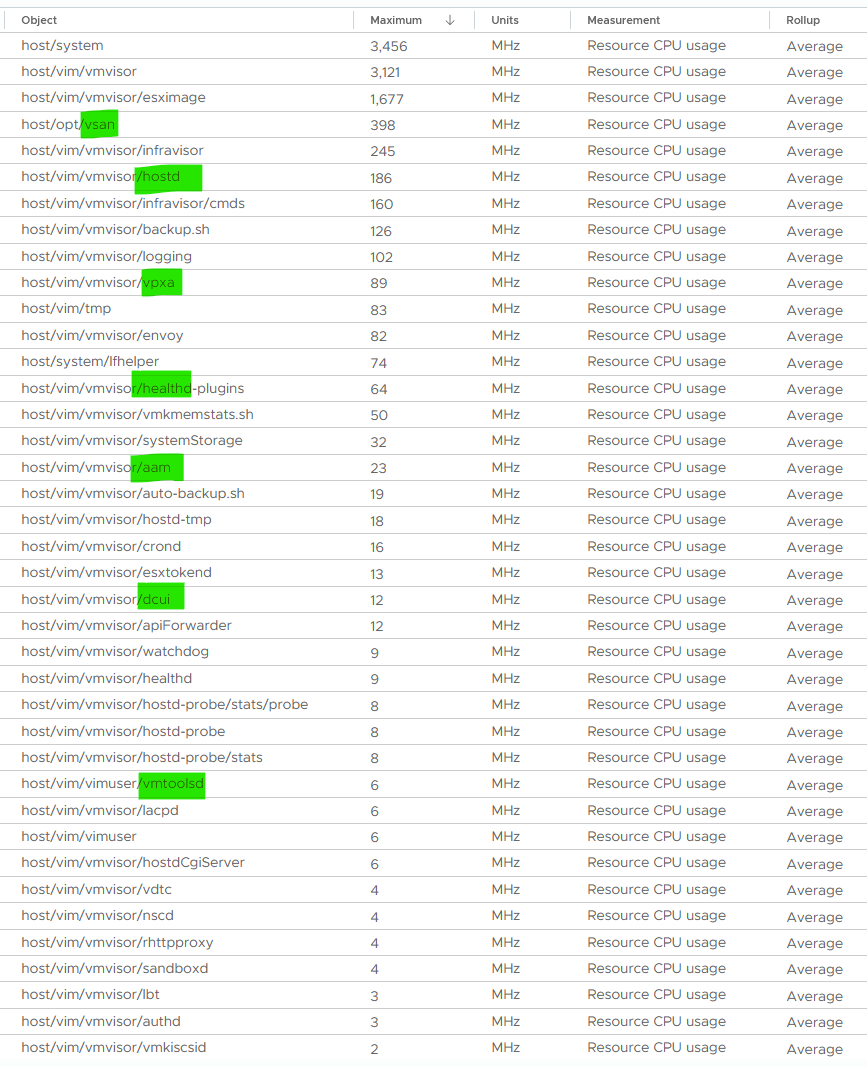
The rest of the items are part of them, so no need to plot them. More importantly, they are fairly small, well below 0.5 GHz. The following screenshot shows their highest 20-second average in the last 1 hour.
To see their total, plot their values in vCenter by stacking up their values, as shown below.
CPU
When you buy a CPU, what exactly is the capacity that you actually get?
To recap, this is what vSphere uses for ESXi.
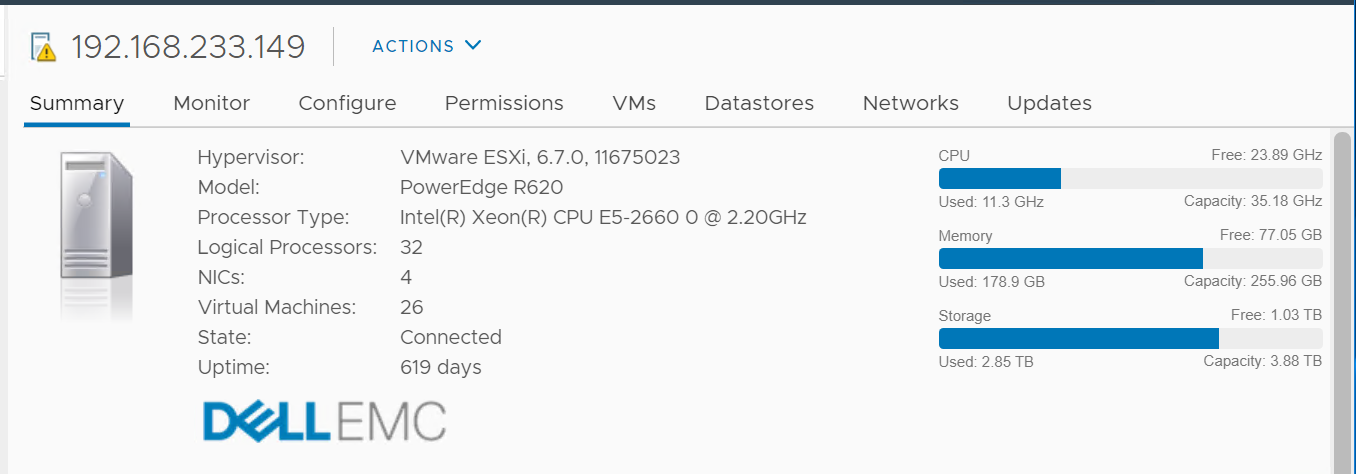
vSphere simply takes the base frequency x number of cores.
-
It does not include turbo boost
-
It does not include hyper threading.
The above is great for mission critical, where you need to be conservative and performance takes priority. For the rest of the workload, you can actually squeeze more. However, you need to set expectation as as the CPU speed depends on the model you buy.
I recommend you optimize the above answer. You can get more while keeping the trade off low. How?
Let’s answer with a simple example. You have 2 ESXi servers:
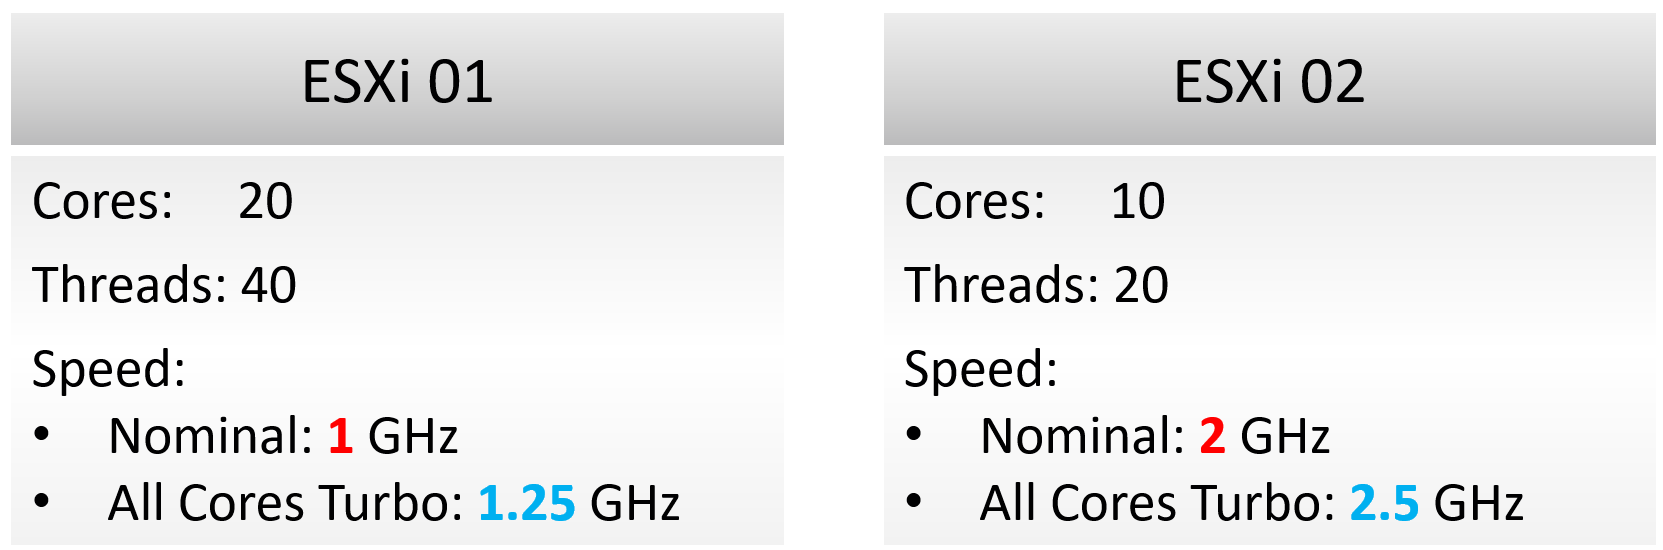
Using the model provided by vCenter, what’s the total capacity of each server?
Answer:
-
ESXi 1 capacity = 20 cores x 1 GHz = 20 GHz.
-
ESXi 2 capacity = 10 cores x 2 GHz = 20 GHz.
The above is a good answer, but can we improve it?
On ESXi 2, VM will run 2x faster, but you can only run half as many VMs. If you run the same number of vCPU as you do on ESXi 1, the VMs on ESXi 2 will compete and incur ~50% CPU Ready time. Workload performance likely becomes unpredictable. CPU context switch will be very high.
That means ESXi 2 has 2x the performance, but 0.5x the capacity. The 200% performance only happens when you run at 50% capacity of ESXi 1. When you load ESXi 2 with 1x the capacity of ESXi 1, its performance could drop below 1x of ESXi 1.
The above shows the imperfect correlation between performance and capacity. This is why you cannot use a single number to measure both. Capacity should not include “the speed of the run”.
| | | |
|----------------------|:-----------|:-----------|
| | ESXi 01 | ESXi 02 |
| Capacity (The Space) | 40 threads | 20 threads |
Not what you expect?
Okay, let’s dive in.
The CPU capacity is in thread, not in Hertz.
Capacity does not consider performance or speed. It simply looks at the part of the CPU where a VM can run. Since a thread can run in parallel with partner thread in a core, it is as simple as counting the physical threads.
ESXi 01 can run 40 vCPU worth of VMs concurrently. By that definition, that means you do not overcommit when you run 40 vCPU, if we set aside hypervisor overhead for now. This is true as the VMs do not experience CPU Ready. Sure, they will run slower but that’s a performance, and not capacity question. The effect would be the same as having a slower hardware. Capacity is not performance. Think of capacity as space, while performance as speed.
Using highway analogy, the number of lanes is fixed, but the allowed speed typically vary depends on the segment of the highway.
BTW, this is consistent with AWS. It counts the threads, not physical core. AWS market it as no overcommit. Yes, they use allocation model and not utilization model.
| Metric | Allocation Model | Demand Model |
| Total Capacity | Total physical threads in the box | Core utilization and thread utilization. Do not use CPU Cycles (GHz). |
| Hypervisor Overhead | No of physical threads you manually assigned | Not applicable, as it’s included in total ESXi counters |
| Consumption | Sum of all running VM vCPU | Core utilization and thread utilization. Usage (GHz) tends to over report. |
| Performance is not applicable. | Ready + CoStop. Swap Wait and Other Wait are not CPU related. |
Utilization Metrics
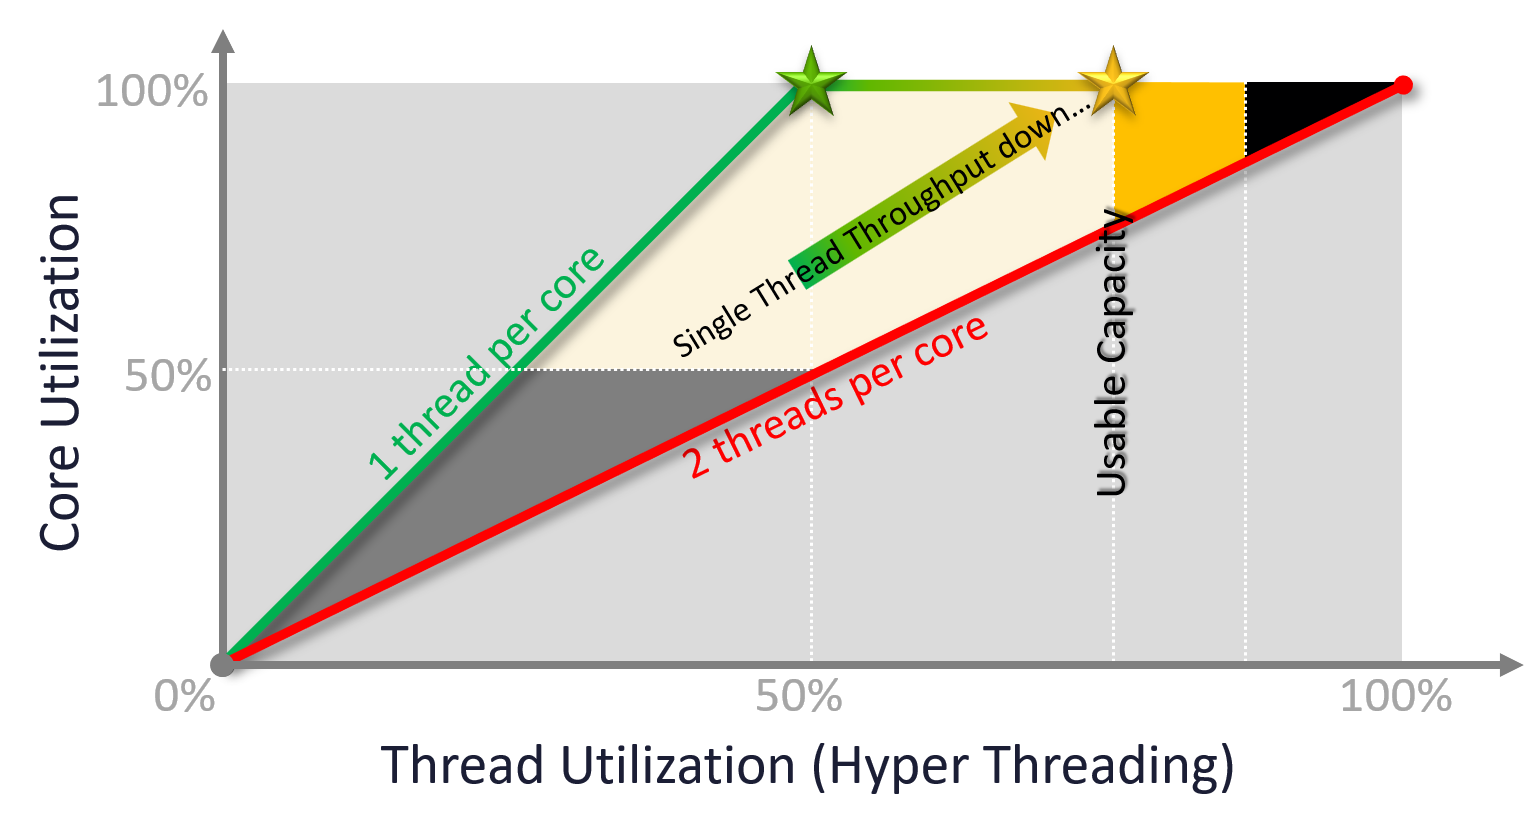
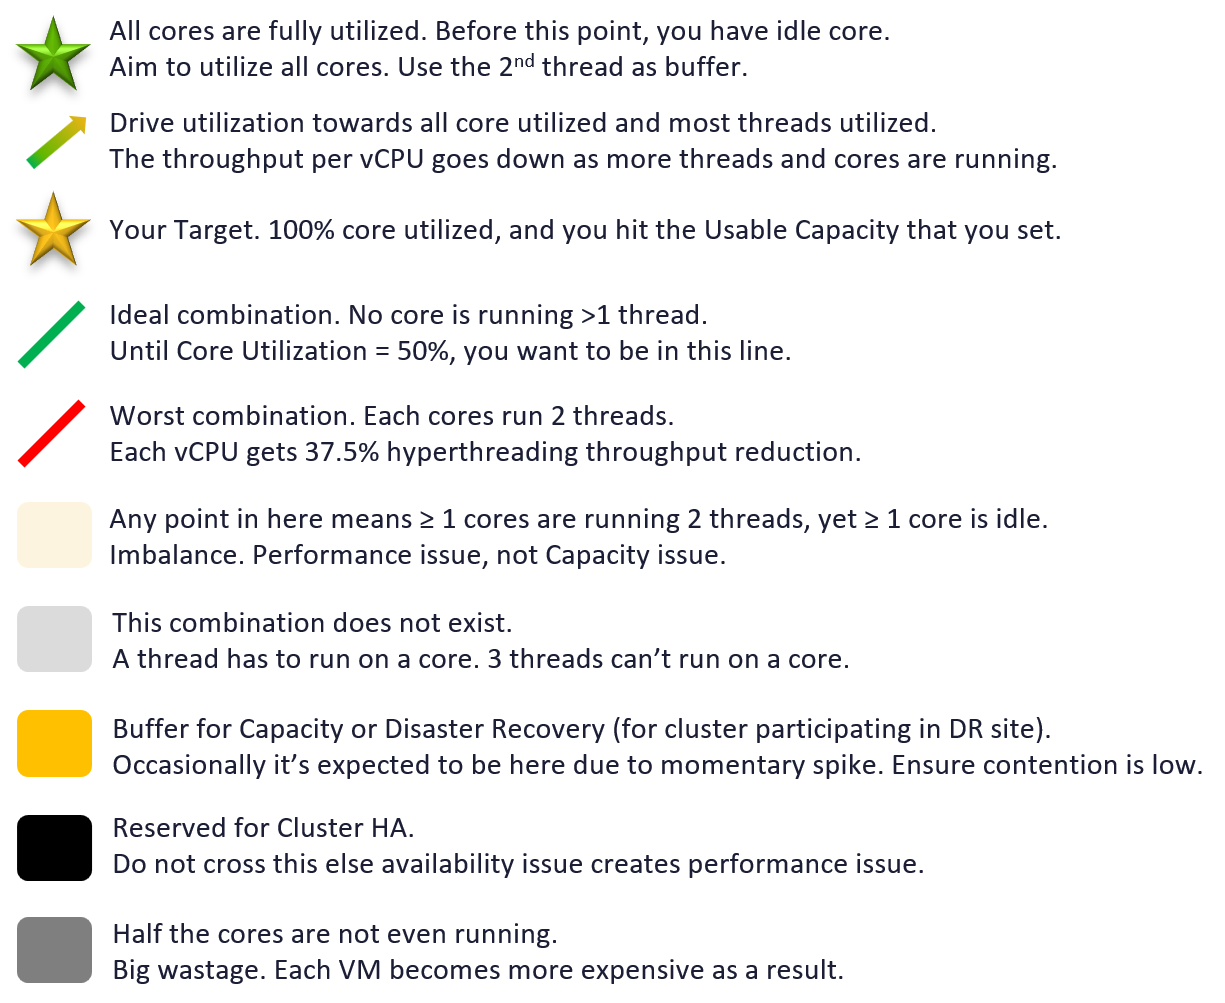
Hyper Threading
What should we do with HT?
I recommend enabling it, but set your customers expectation on the CPU speed.
Note that HT technology may change in the future. New Intel Xeon no longer has HT, but uses small core and big core instead. Future Intel may bring it back. AMD still use it.
CPU Cycles
Do not express an ESXi capacity in MHz, as the total “capacity” becomes volatile.
-
If you enable hyper threading, the total capacity only goes up by 1.25x. However, the speed reduction experienced by VM is significant. It’s 37.5% slower.
-
All Cores Turbo brings up the total capacity. This number varies per CPU model.
The usage of GHz as the unit complicates calculation as it’s mixing performance and capacity.
Consumption
For allocation-based model, the consumption is simply the configured vCPU for all the running VM.
For demand-based model, the consumption is the maximum of CPU Usage and CPU Reservation for all the running VMs.
Do not include VM CPU contention, but make sure performance is tracked explicitly.
Reservation Metrics
Take note that allocation is done in vCPU, but reservation is done in Hertz. When you vMotion a VM to faster ESXi, let me know if the reservation also increases accordingly. If not, you need to adjust manually.
Hypervisor
In the planning stage, we need a single number for usable capacity.
In the monitoring stage, we should be mindful that our estimate may be too aggressive or conservative. This is why tracking contention is paramount.
Recommended Value
What number do I recommend?
Based on the profiling documented in the kernel section later on, I’d use the following at 2.5 GHz clock speed:
-
12 threads if you use NSX and vSAN.
-
4 threads if you use ESXi only.
NSX EDP adds 2-4 cores as it regularly polls the network card.
vSphere Replication and HCX need to be sized separately.
vSAN File Services needs 2 vCPU as it's a VM. Set reservation.
CPU Metrics
I’ve given recommendations on the number to provide as part of the planning process. Now let’s dive into how the numbers are derived.
The following screenshot shows the CPU counter names used by vSphere Client UI. What do you notice?
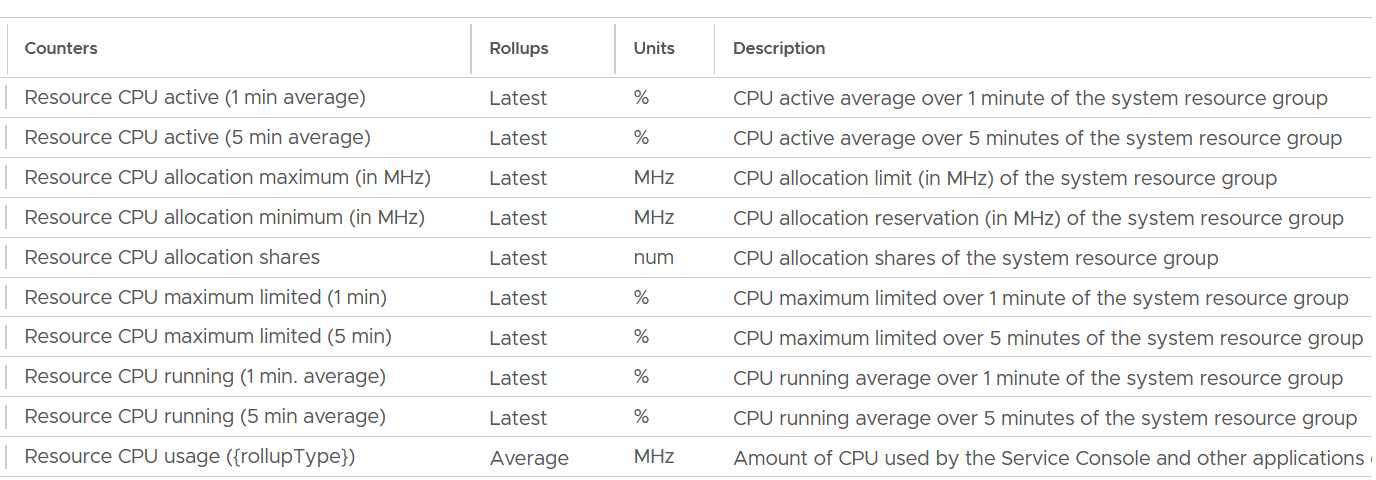
Yes, the roll up of the counter.
In general, when you take the latest value of something, you tend to get a much higher value than averaging the entire period.
Utilization
There are 3 counters provided to track the actual utilization.
-
Usage
-
Running
-
Active
Usage is what you should use as it has the 4 resource groups and their sub pools.
Running and Active counters only has these 3 objects, hence they are less useful. You lose host/user, host/opt so you won’t get complete picture.
Plus, Active uses “latest” as its rollup.
If you still need to know about Active and Running, reach out to me and happy to share more details.
Usage
Now that we know which counters to use, what do you expect the values of the 4 groups?
Here is a sample from ~400 ESXi hosts, where I sort the top 7 from highest System usage.
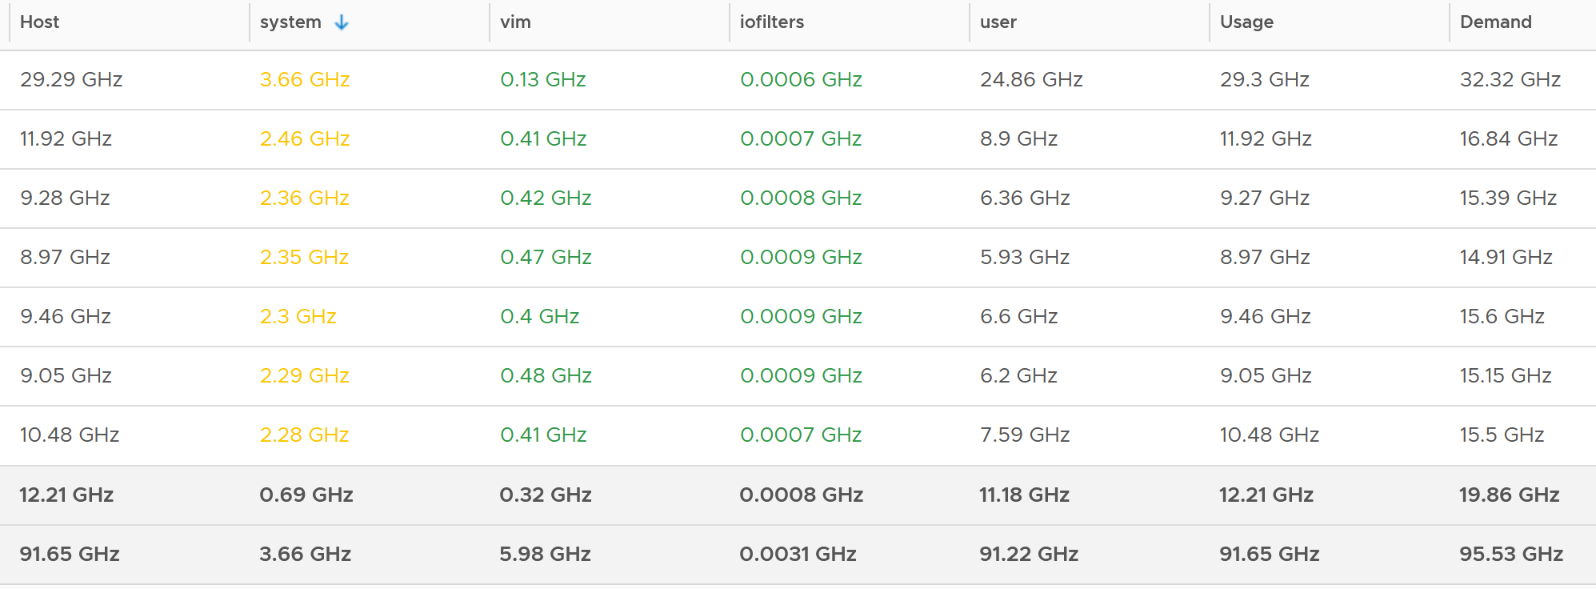
The bottom two rows show the summary. The first summary is the average among all the hosts, while the last row is the highest value.
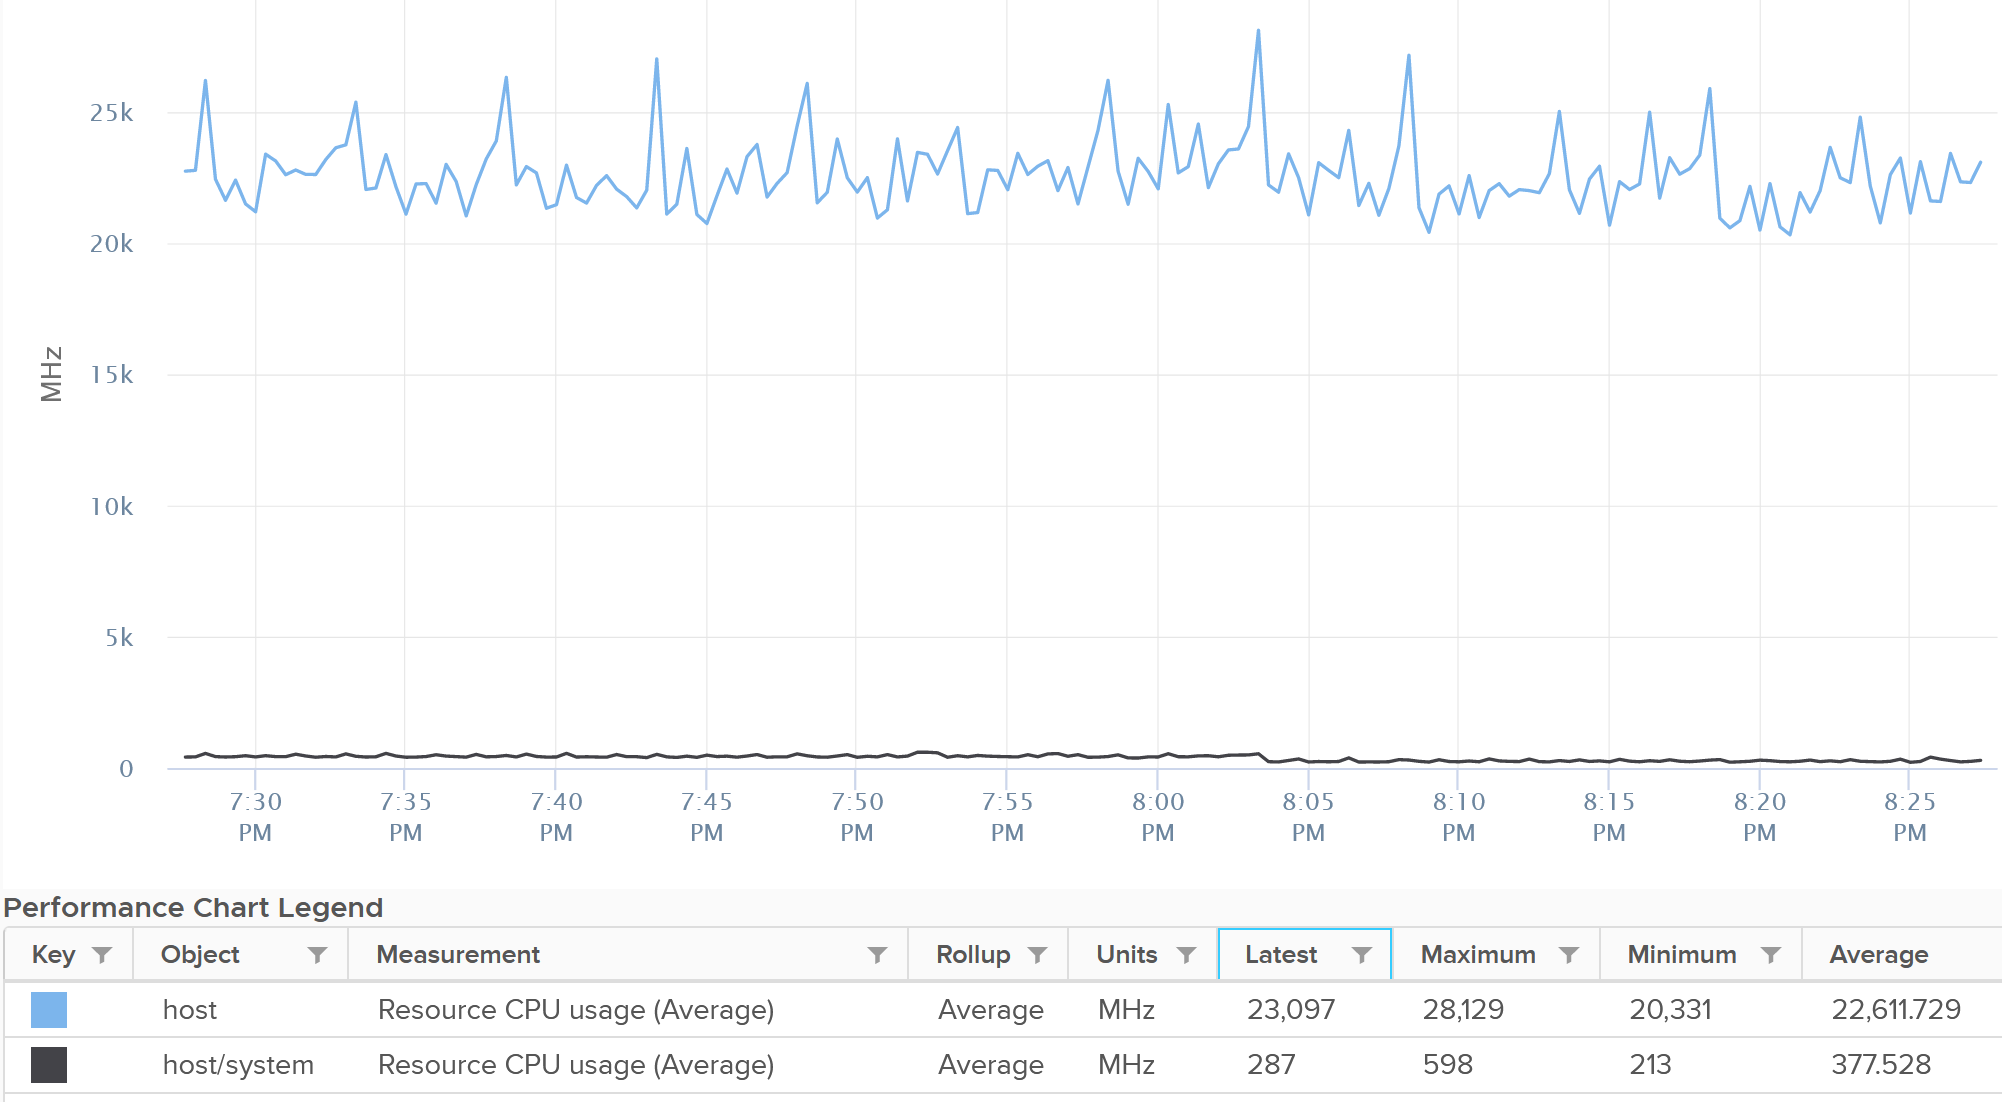
Usage maps to the ESXi CPU Usage metrics under CPU group.
The value at host matches the value of CPU Usage. This means the metric CPU \ Usage (MHz) is the same with System \ Resource CPU Usage (Average) (MHz).
As the value contains VM metrics, the value is much higher than the kernel. You can see the host/system is far lower.
Real World Samples
I plotted 364 ESXi hosts running production workload. All of them are doing at least 100 GHz and are running vSAN and NSX. For vSAN, they are a mixed of OSA and ESA architecture.
The line below shows the kernel relative to the total CPU Usage.
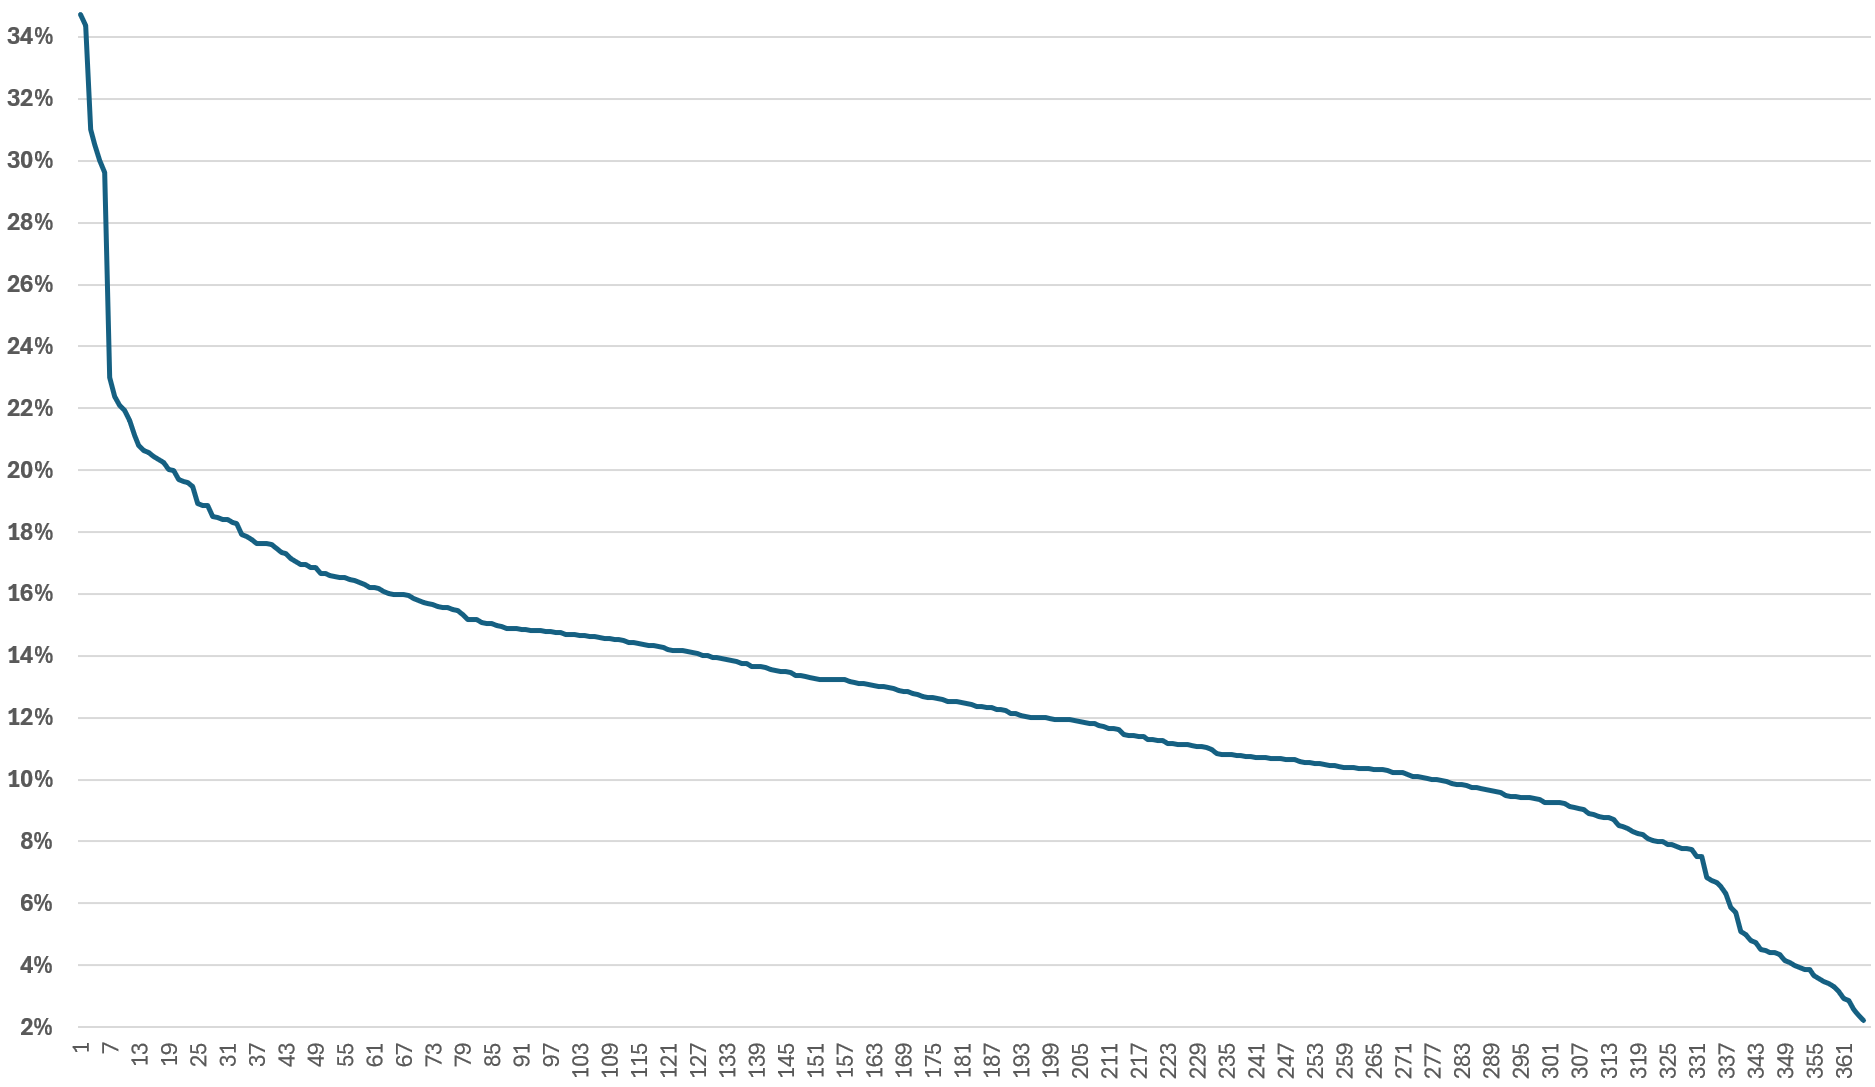
In terms of absolute utilization, the actual utilization has a wide range. This is despite all these ESXi were running at least 100 GHz.
Take note there is no perfect correlation between kernel utilization and VM utilization. This is especially true when the kernel has NSX and vSAN. All these 364 ESXi were running vSAN (mixed of OSA and ESA) and NSX.
The following chart shows that a great majority were below 10%. There is no strong correlation between the relative overhead and the absolute overhead.
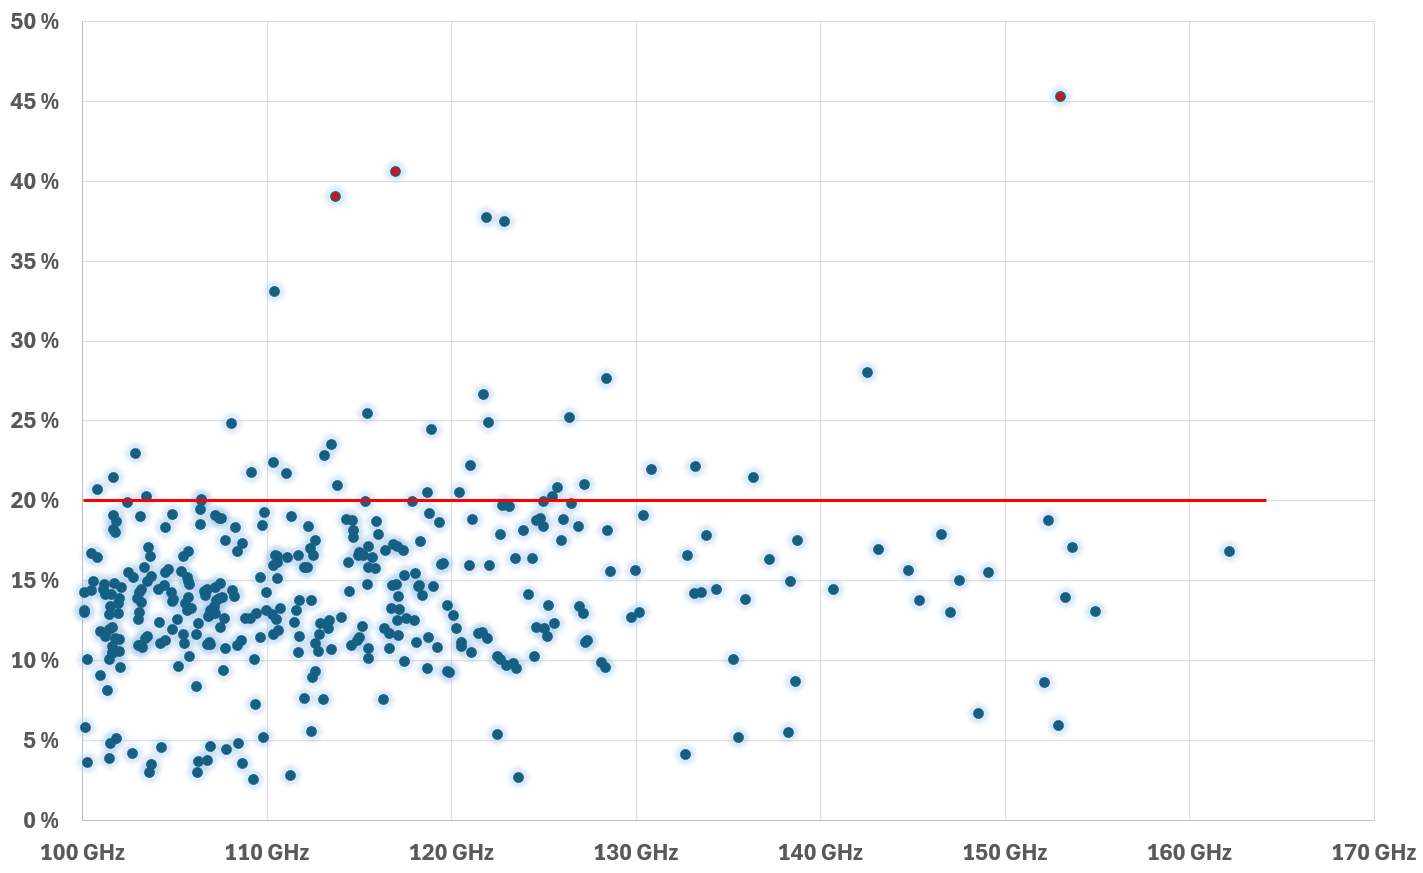
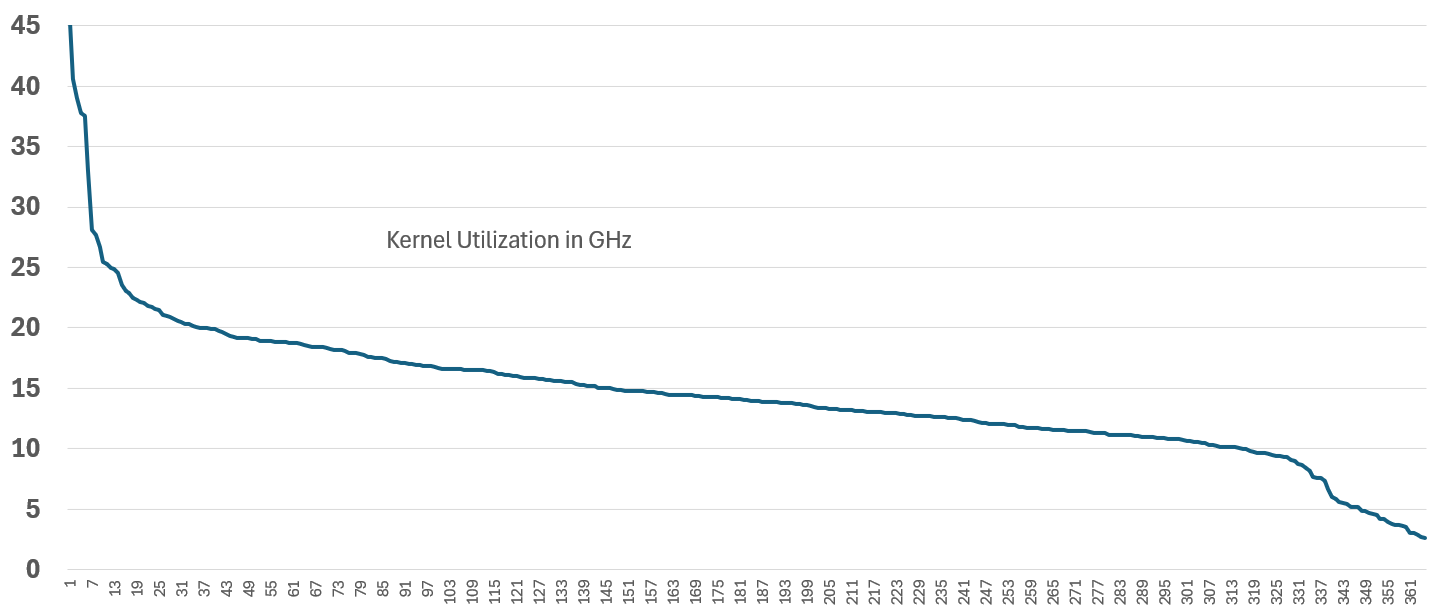
Another measurement, taken at a different time. This time there were 557 ESXi with CPU Usage > 100 GHz, with 2 of them clocking > 170 GHz.
There were 2 outliers at > 40 GHz, highlighted in orange. The hypervisor overhead remains steady at 100 GHz vs > 150 GHz. I drew a red line at 25 GHz to show that majority of the numbers are below this.
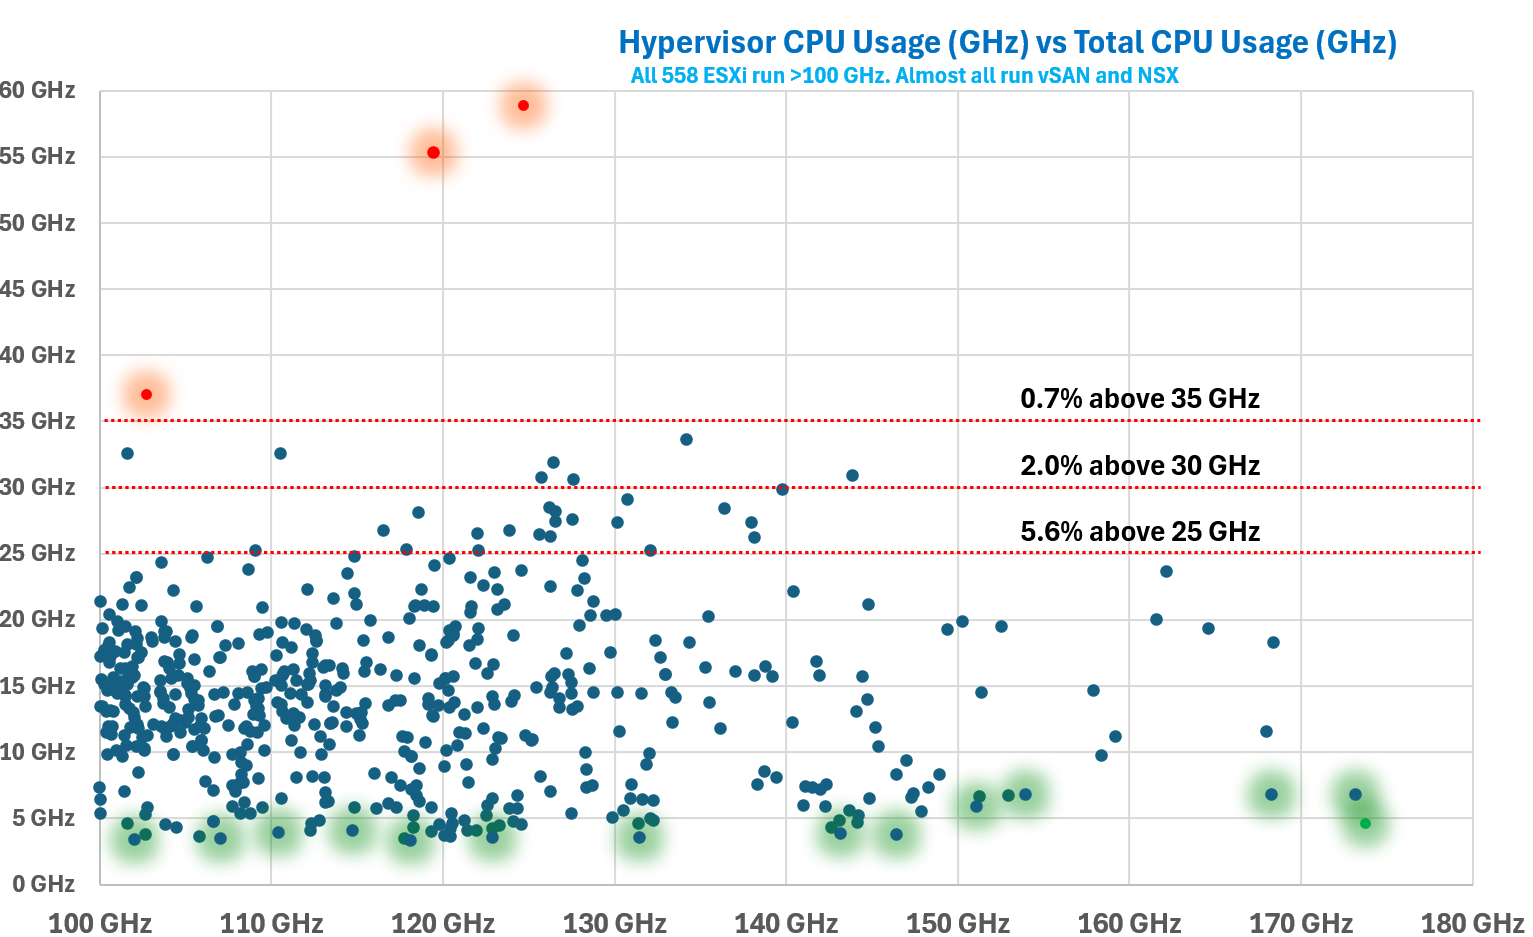
Plot the values across all your ESXi hosts. If you take enough hosts, you will notice the values vary. The following chart shows 558 ESXi hosts. Almost all are running both vSAN and NSX. They are all running at least 100 GHz. What do you notice?
Yes, there is hardly any correlation between total CPU Usage and hypervisor CPU Usage.
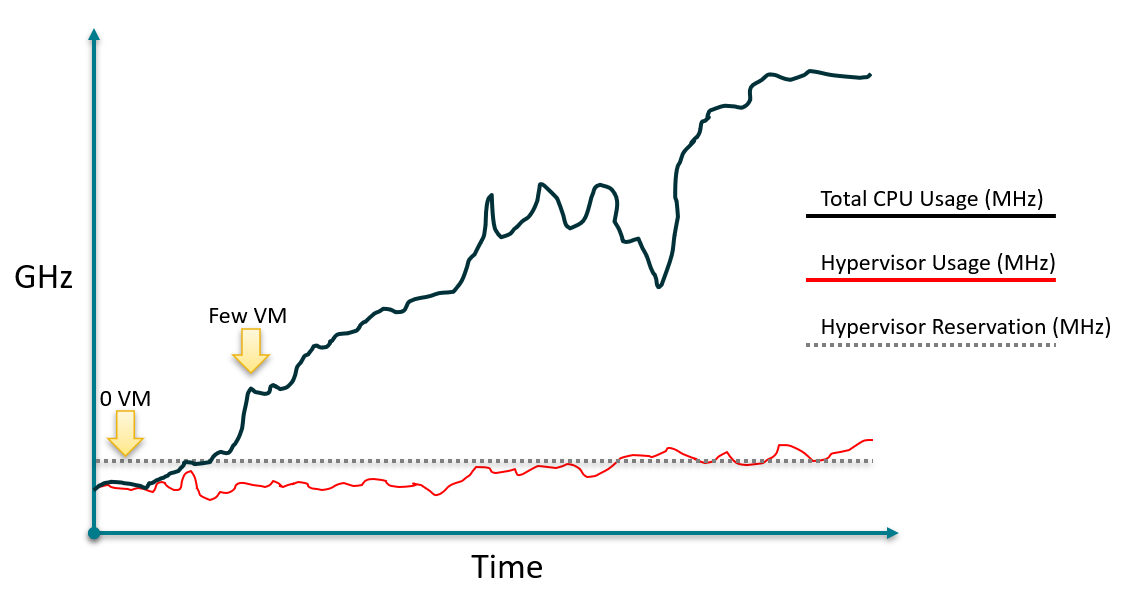
I drew the following illustration to show the lack of predictable relationship between hypervisor CPU reservation, hypervisor CPU usage and total CPU usage.
Network Impact
What’s the kernel overhead to do network packet processing?
The following ESXi was doing > 40 Gigabit per second multiple times. It was processing > 3 million packets.
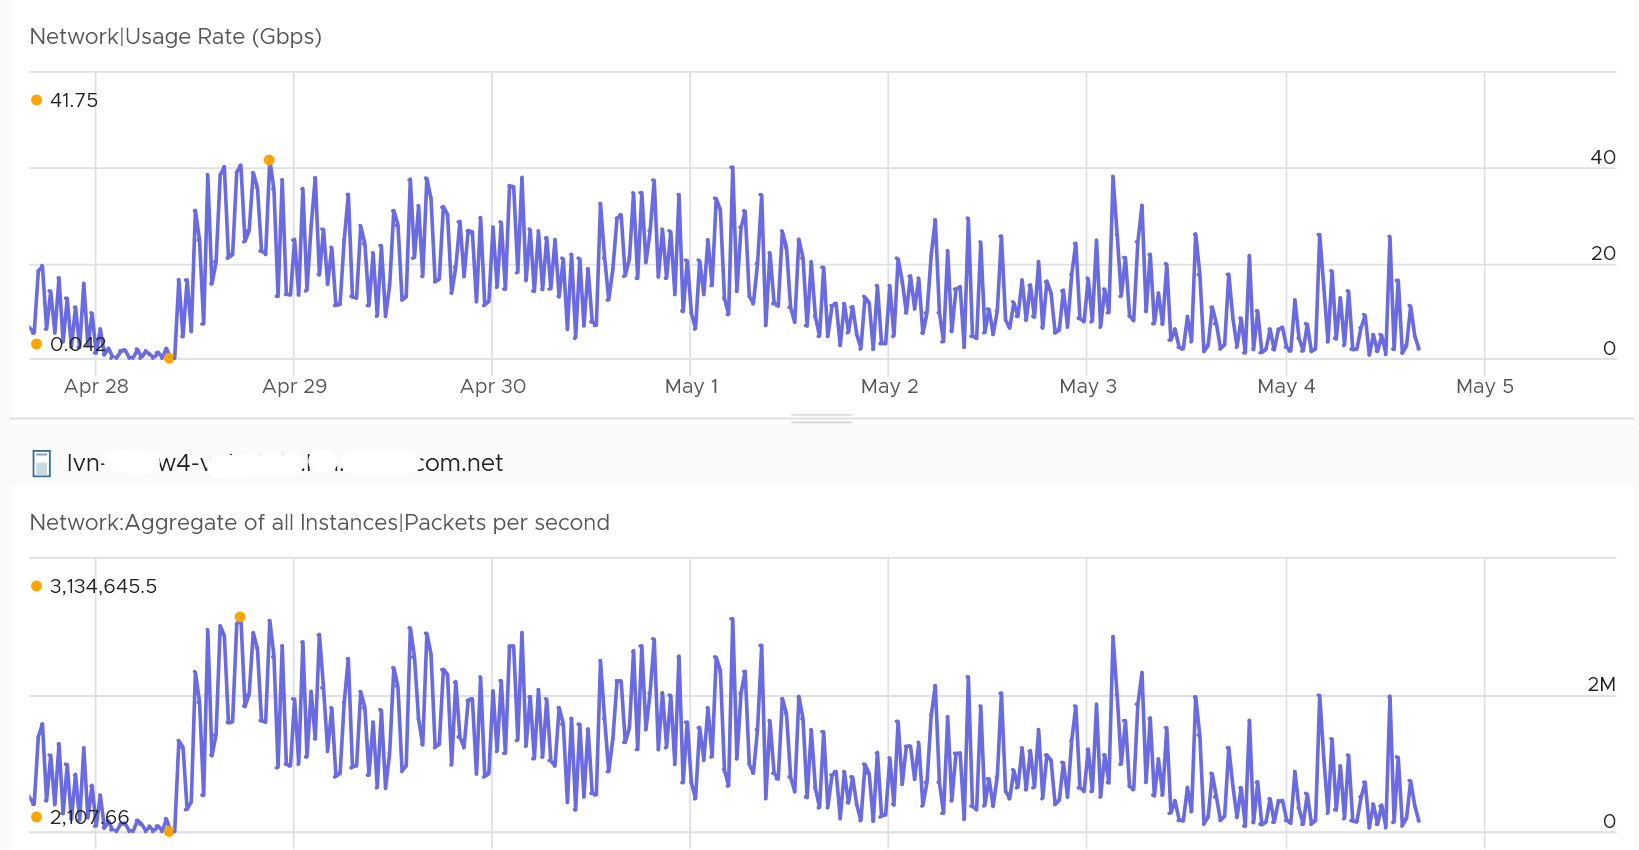
Hardly any impact on the kernel. The kernel was less than 8 GHz.
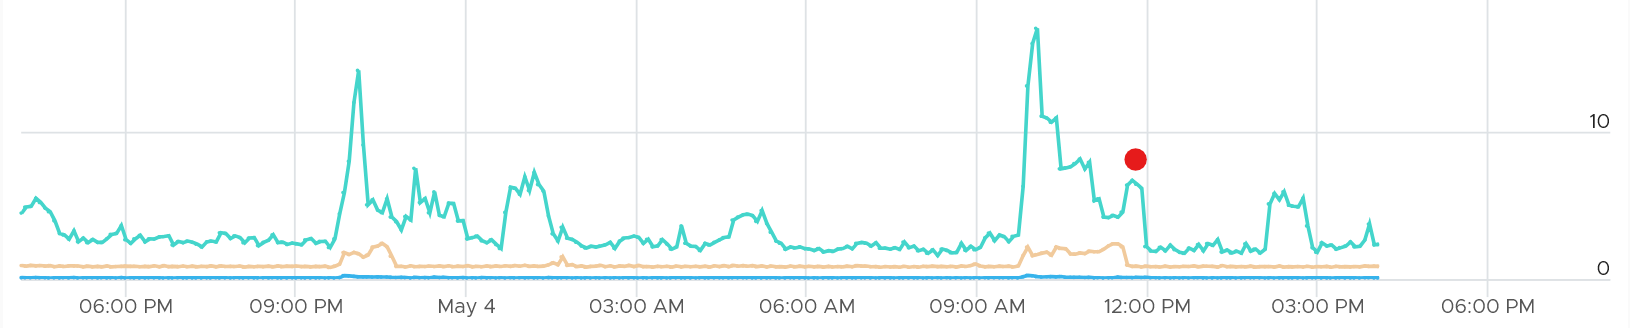
Storage Impact
Storage IO processing can require more kernel if the IOPS and throughput are high. The following ESXi hit > 200K IOPS two times.
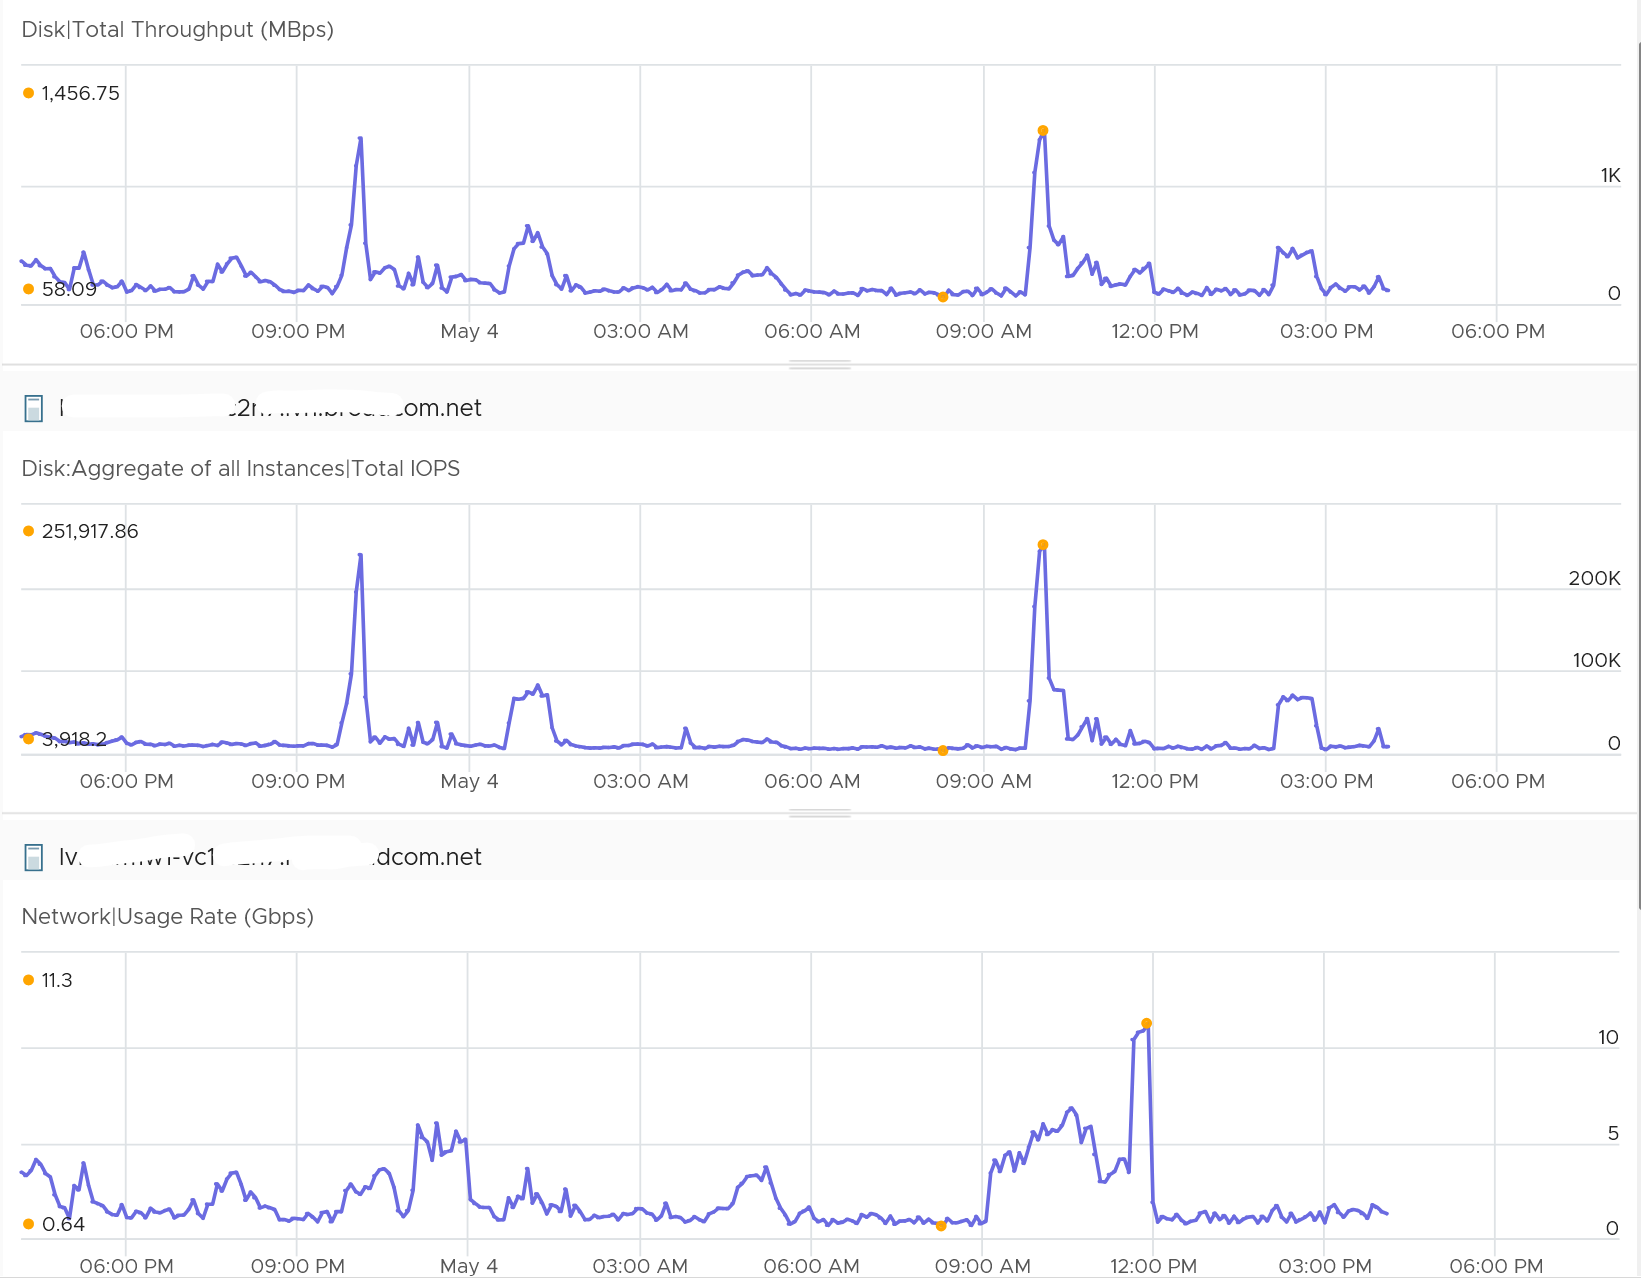
You can see a corresponding spike in the kernel. It went above 10 GHz.
The red dot is because of network.
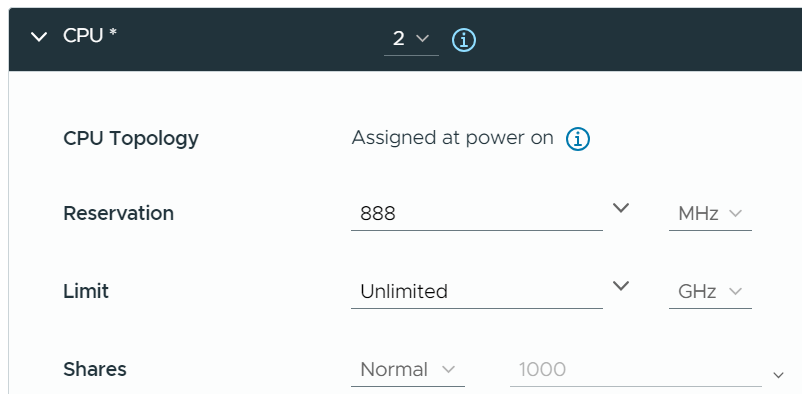
Reservation
Utilization is relatively more volatile or dynamic, while reservation is logically more stable. The following screenshot shows CPU Usage fluctuates every 20 seconds, while reservation remains perfectly constant. Expect Usage to be higher reservation at high utilization.
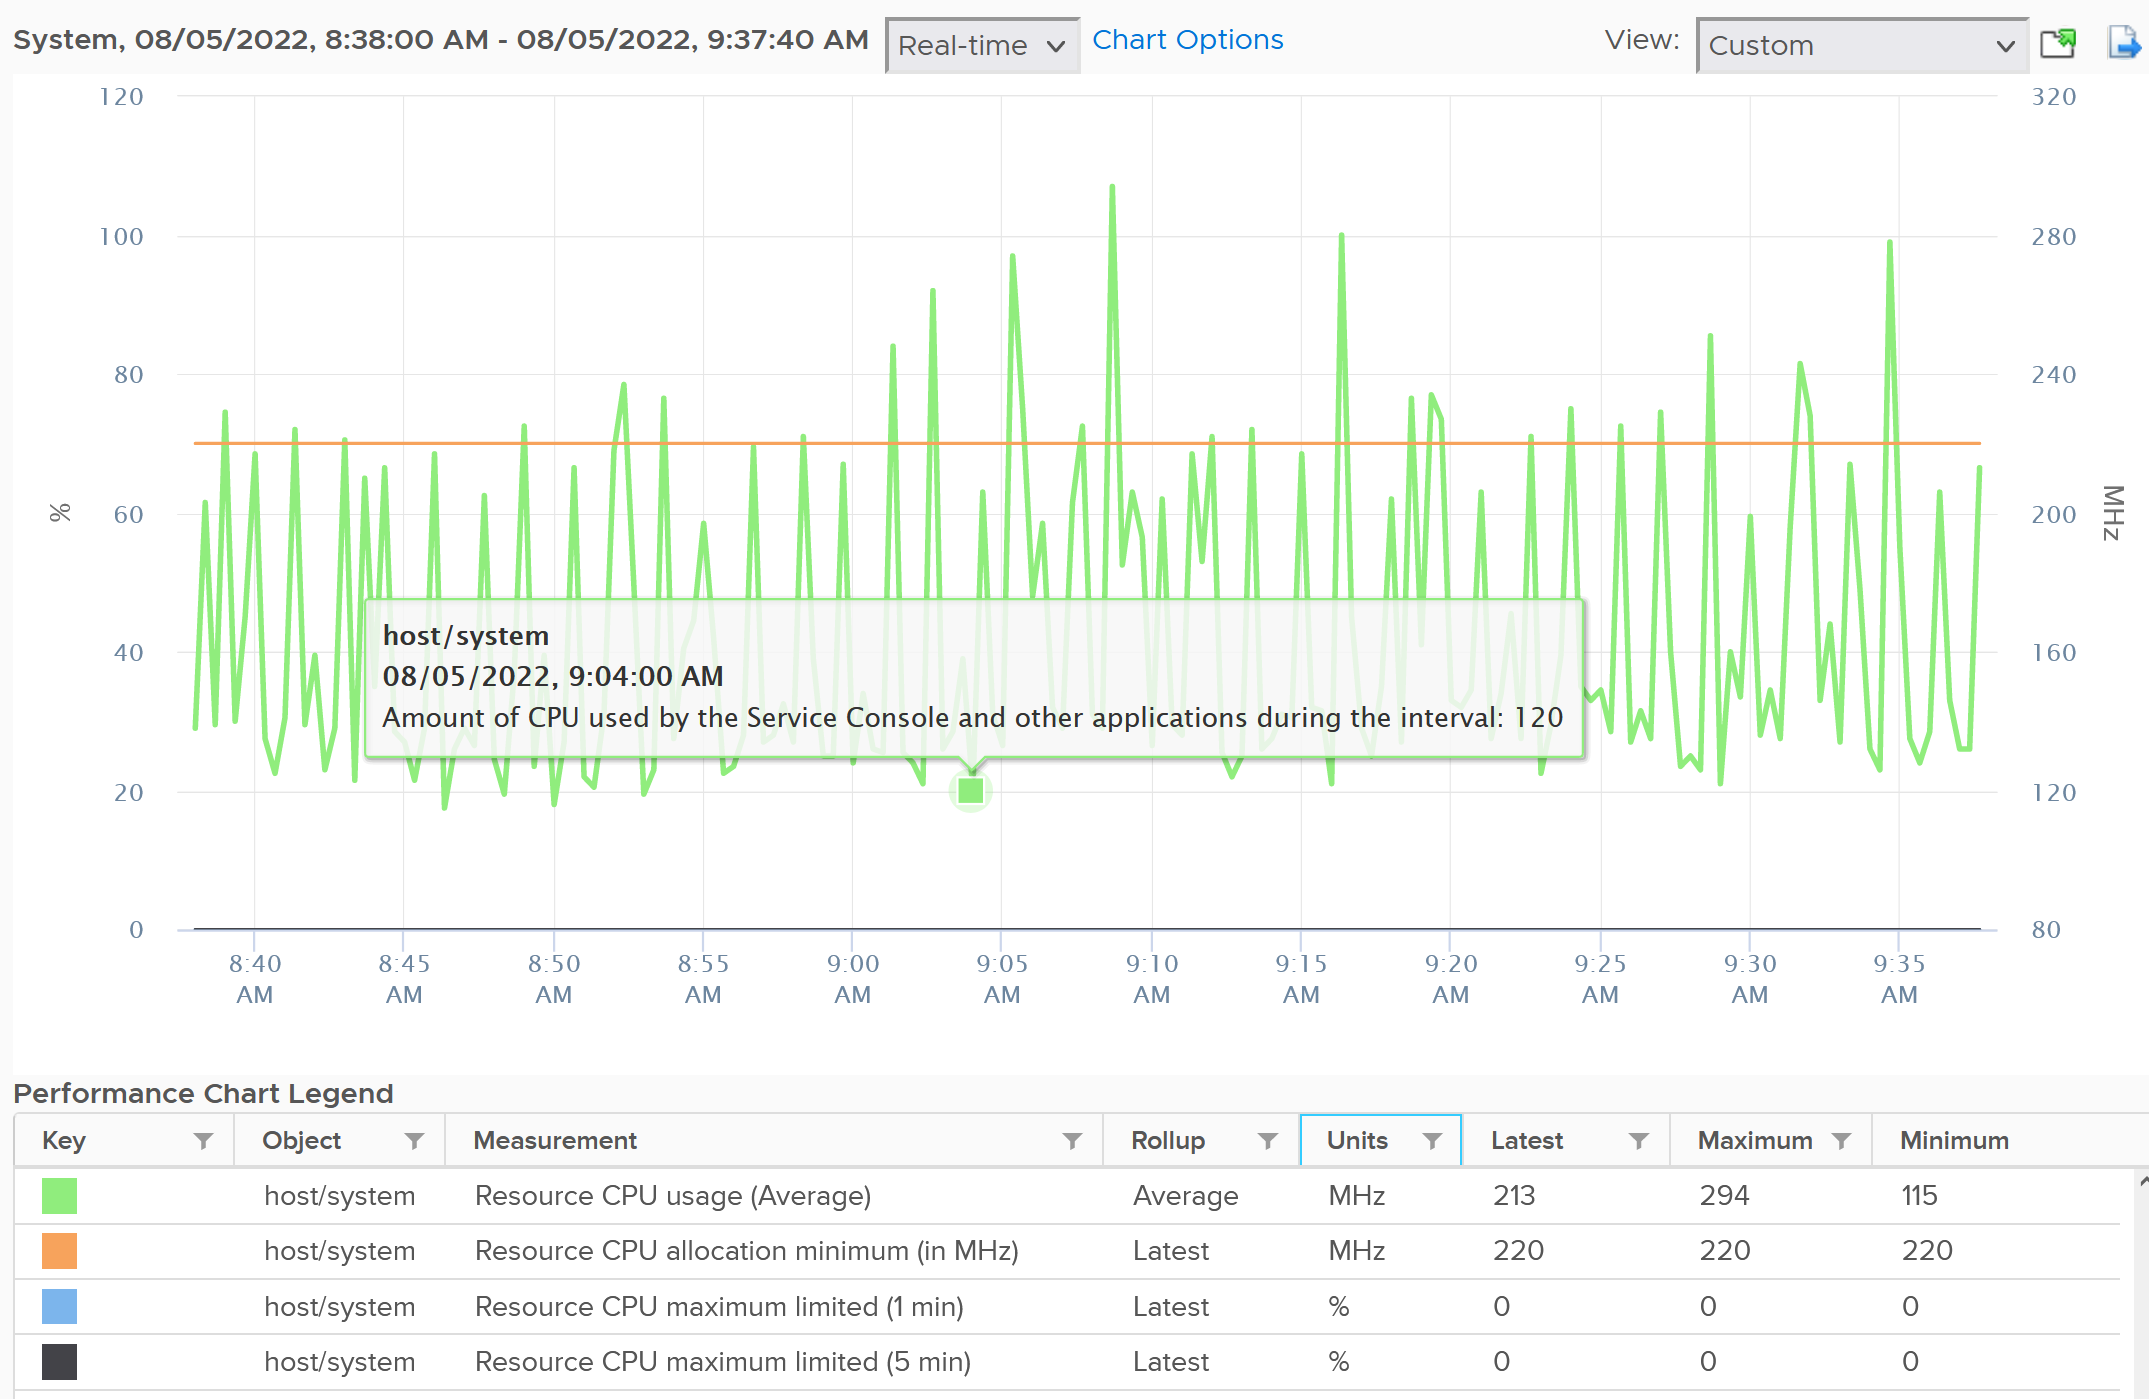
Notice the maximum limited value is perfectly flat. That’s what you want as kernel processes should not have a limit.
The above is for host/system. The reservation is surprisingly low.
Now let’s look at host/vim. What do you notice from the following screenshot?
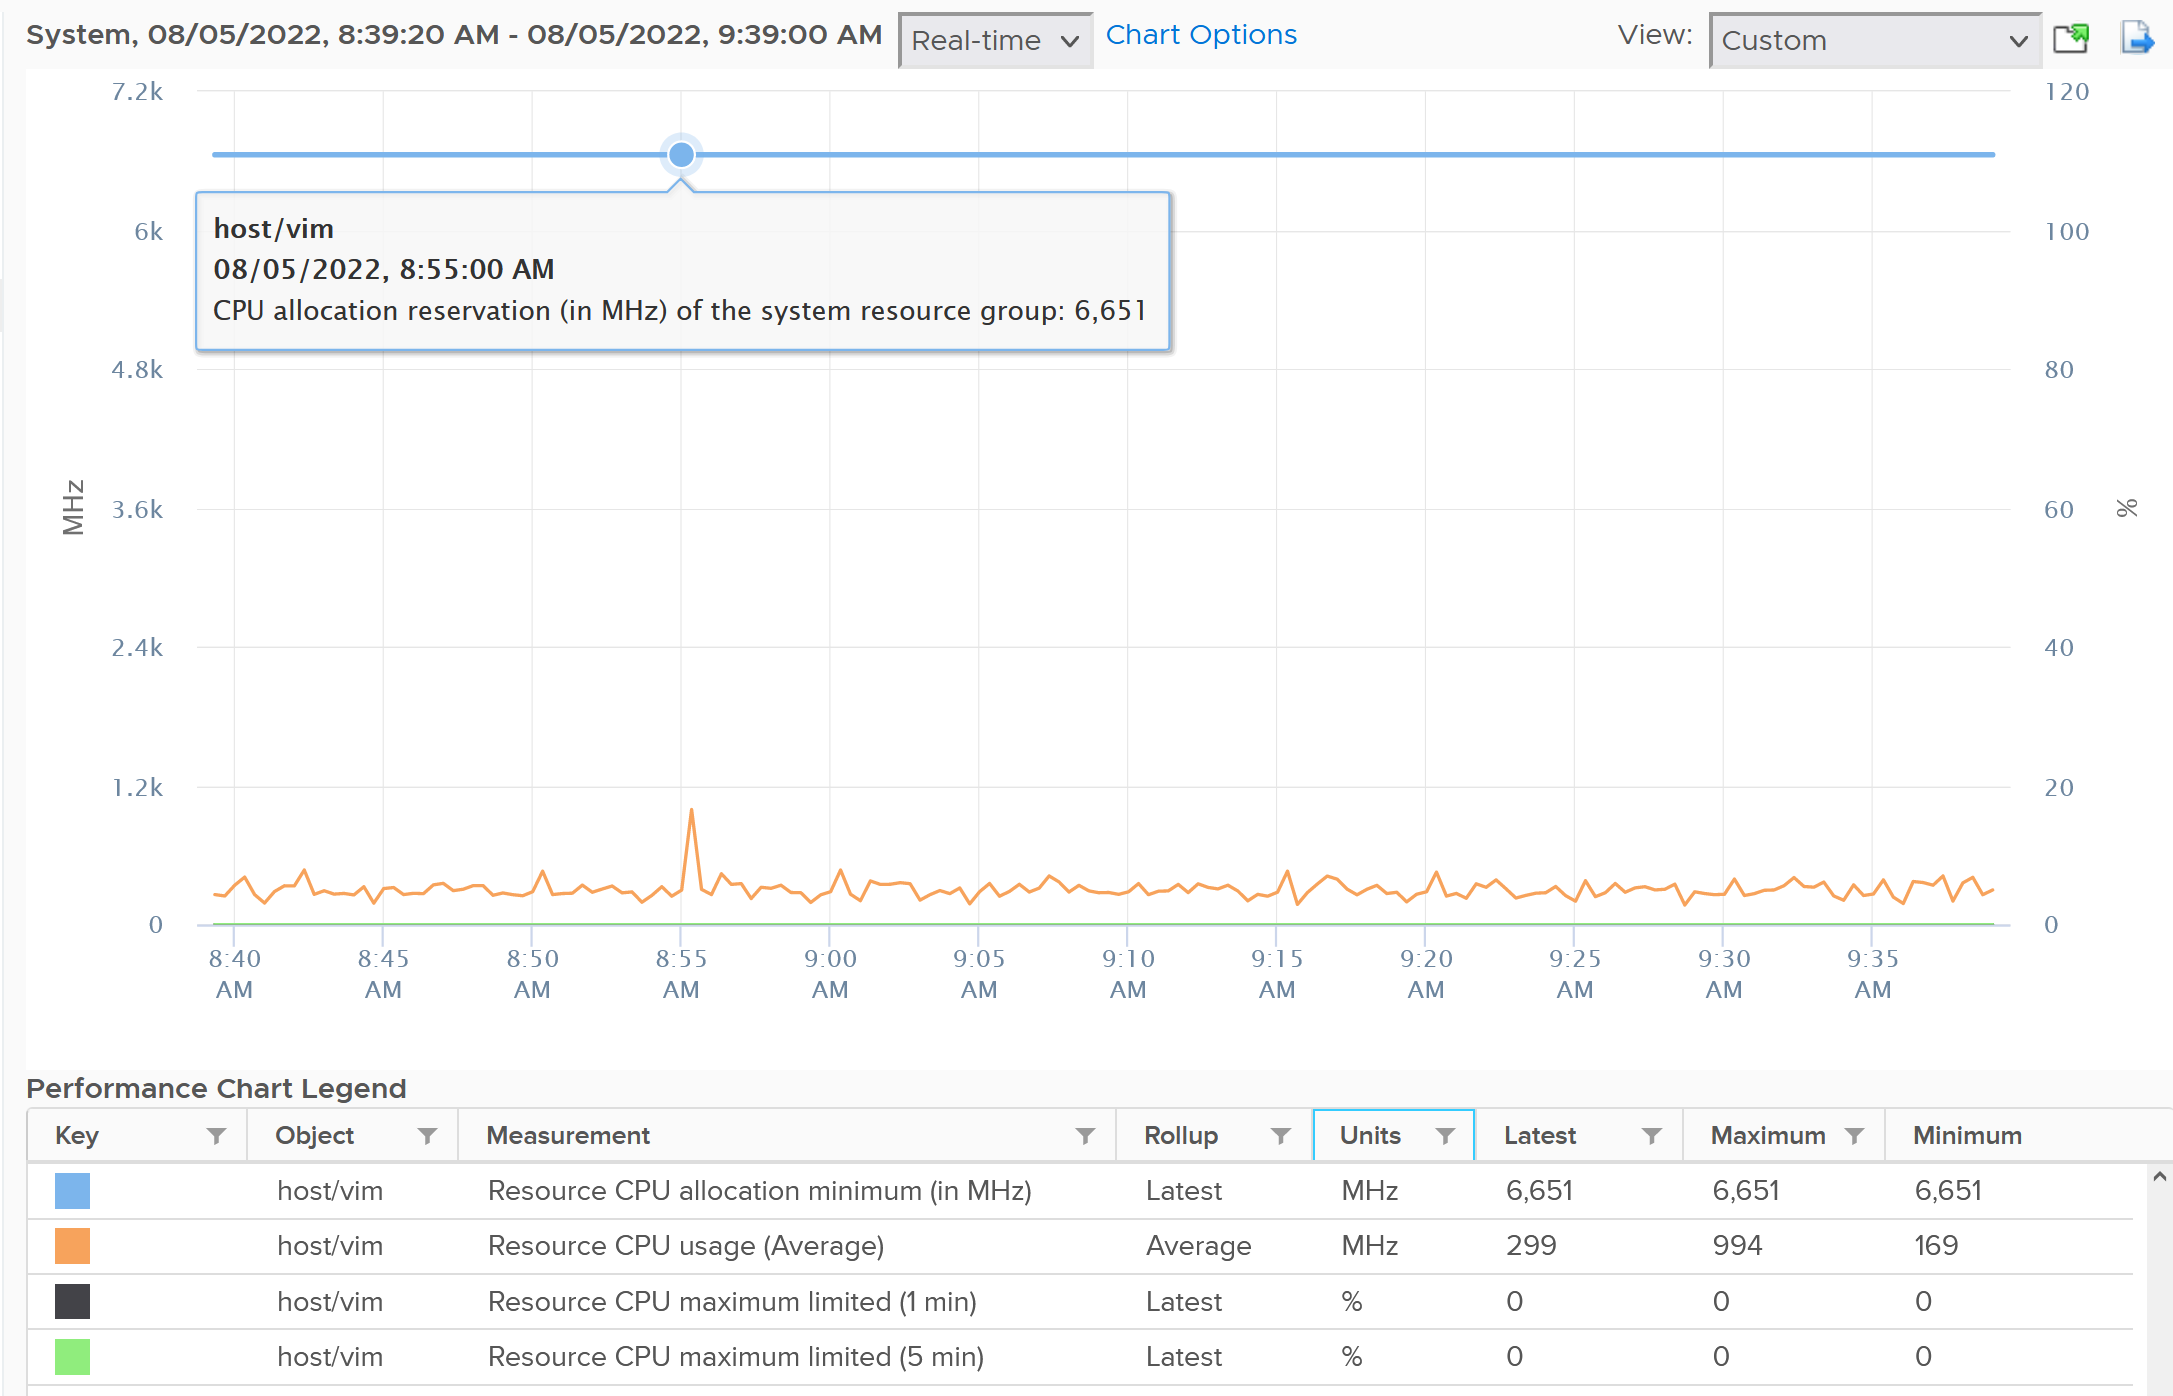
Surprisingly the reservation is not low. It’s around 6.6 GHz.
Real World Samples
The above is from 1 ESXi. We need to plot for many to get a better understanding. The following diagram shows the distribution of the kernel overhead based on a sample of almost 400 ESXi in production environment.
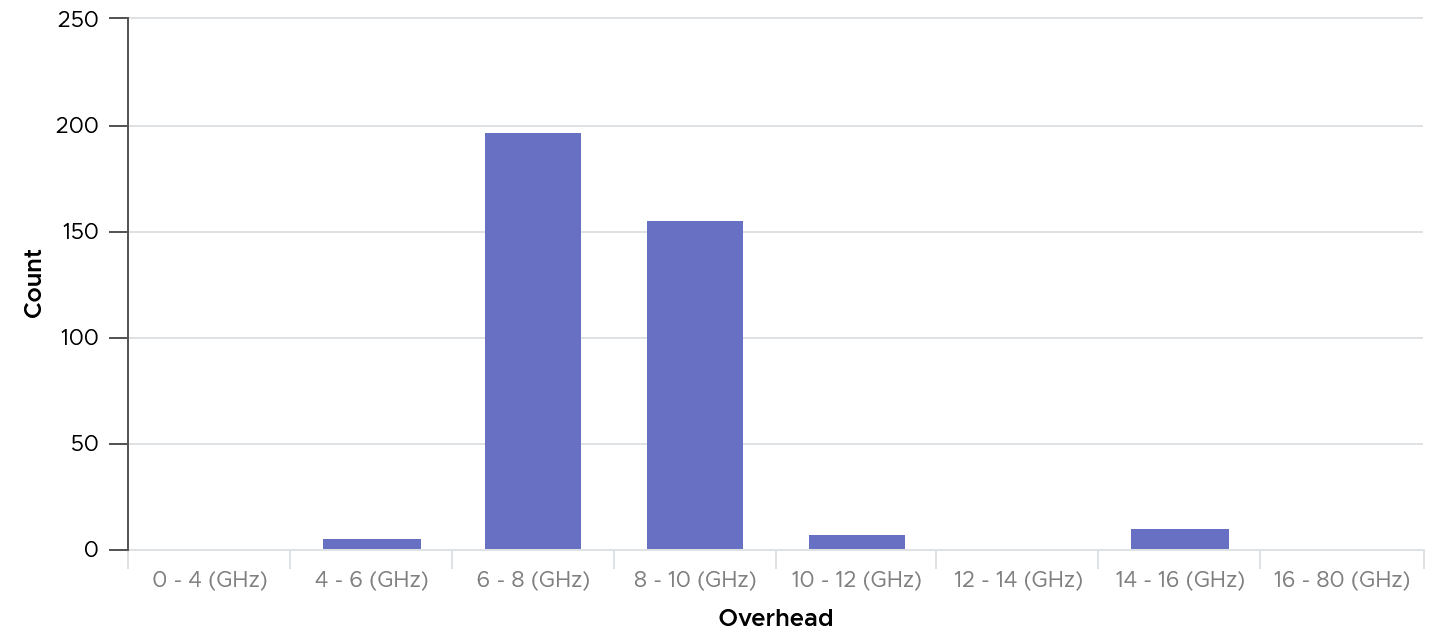
By far the majority of the values lie in 6 – 10 GHz.
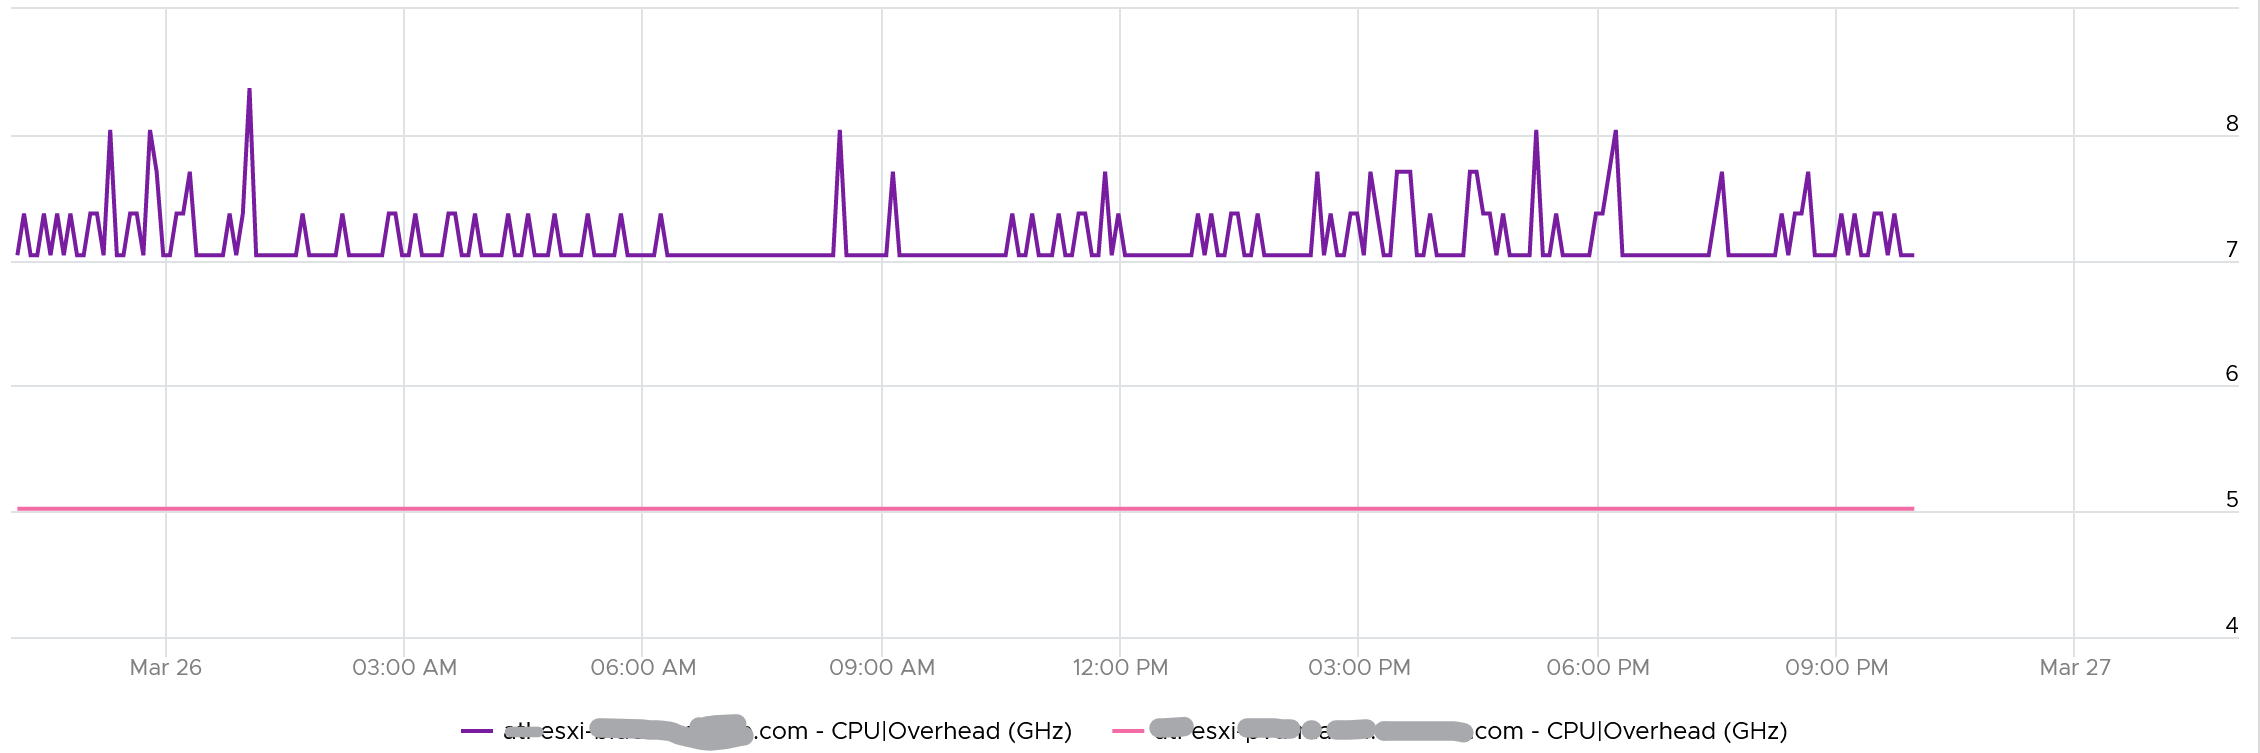
Their values tend to be stable over days, although from time to time I see fluctuating metrics, which is reasonable as there are multiple factors impacting the reservation.
The following chart shows both the fluctuating pattern and steady pattern (most common). They are from 2 ESXi hosts.
Memory
Memory is simpler than CPU as there is only “space” dimension. There is no “speed”.
Memory is more complex than CPU as Guest OS and VM are 2 different realms. None is perfect as an input.
Capacity Metrics
There are
| Metric | Allocation Model | Demand Model |
| Total Capacity | Total physical memory in the box. This is the same for either model | |
| Hypervisor Overhead | No of GB you manually assigned | Not applicable, as it’s included in total ESXi counters |
| Consumption | Sum of all running VM configured RAM. | ESXi Consumed |
| Performance is not applicable. | ESXi Swapped + Zipped + Guest OS Ballooned. | |
Hypervisor Overhead
In the planning stage, we need a single number for usable capacity.
In the monitoring stage, we should be mindful that our estimate may be too aggressive or conservative. This is why tracking contention is paramount.
What number do I recommend?
Based on the profiling documented in the kernel section later on, I’d say:
-
64 GB if you use NSX and vSAN
-
~20 GB if you use ESXi only. I don’t have real world numbers to back this up as the environment I have is NSX and vSAN.
Demand Metric
Unlike allocation, demand is tricky as different layers in virtualization has their own perspective. ESXi applies multiple memory management techniques, which makes it harder to determine the total demand:
-
TPS results in less actual usage.
-
Balloon means ESXi is under memory pressure, or the VM hit a limit.
-
Compress means the pages are still in DIMM, albeit occupying less space. How much less depends on the zipped result and if the remaining page is fully used or not.
-
Swapped and compressed share the same input. When a page cannot be compressed, it got swapped.
-
Host cache.
-
Memory tiering such as Intel Optane.
-
We exclude VM overhead as it’s negligible.
Because of the above, it is better not to mix metrics from Guest OS and VM.
ESXi Demand = Kernel Consumed + Sum of (Running VM Demand)
where VM Demand = Min (Limit, Consumed + Ballooned + Zipped + Swapped)
Limitation of VM counters:
-
Consumed metric is mostly inactive pages. So adding ballooned, zipped, swapped will make it even more conservative.
-
The Guest OS counter is more accurate as it’s closer to application. It tends to be smaller. However, Guest OS is unaware of ESXi memory management techniques.
Hypervisor Metrics
The following screenshot shows the counter names used by vSphere Client UI
Unlike CPU, the Rollups column values are all Latest. This makes sense as memory is measure storage space. You want to know the last value, not the average over collection period.
The Stat Types column values are all Absolute.
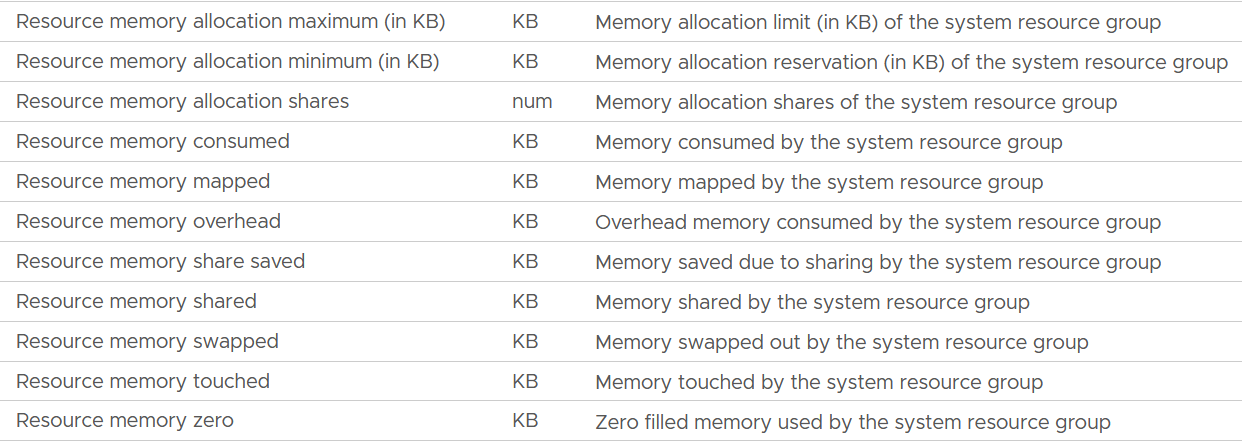
| Allocation maximum | As per CPU, this is the limit. |
| Allocation minimum | As per CPU, this is reservation. |
| Shares | Relative shares of each the kernel world. This is the kernel internal metric, not something vSphere Administrator should change |
| Consumed | The actual consumption. Just like CPU, this can be lower than the reservation. The host/vim world has no reservation. |
| Mapped | I’m unsure what mapped means. Regardless, there seems to be no use case for customer operations. The rest of the metrics are fairly similar with the associated metric at VM and ESXi level. |
| Overhead | |
| Share Saved | |
| Shared | |
| Swapped | |
| Touched | |
| Zero | The entire block contains just a series of 0. |
Utilization
I plotted 607 production ESXi running vSAN and NSX. The hosts have Consumed memory between 650 GB and 1450 GB. As expected, the kernel overhead decreases relatively as total memory grow.
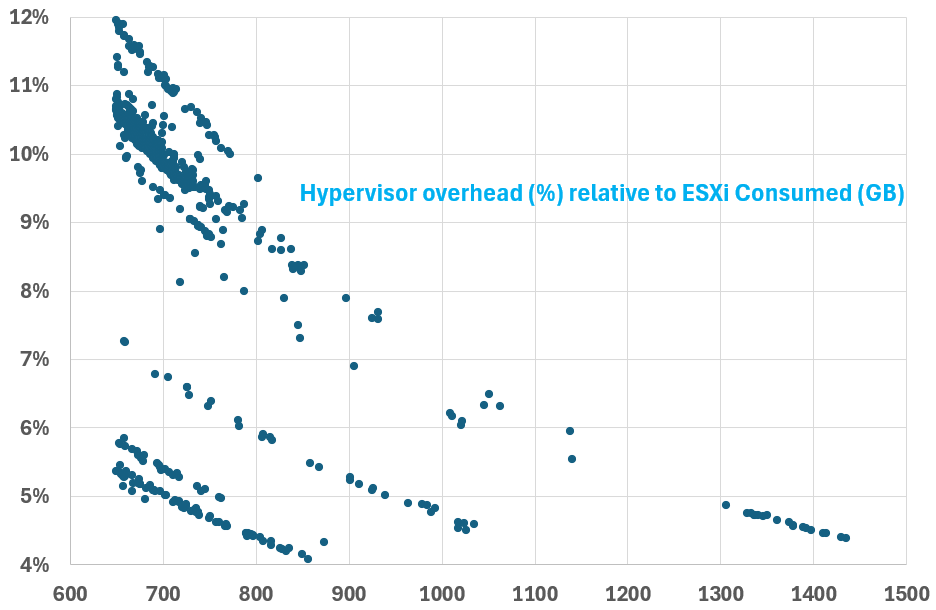
The number dropped to well below 10% once Consumed passed 800 GB. This means that the absolute amount plateau at a certain level. We can validate that by plotting the absolute utilization.
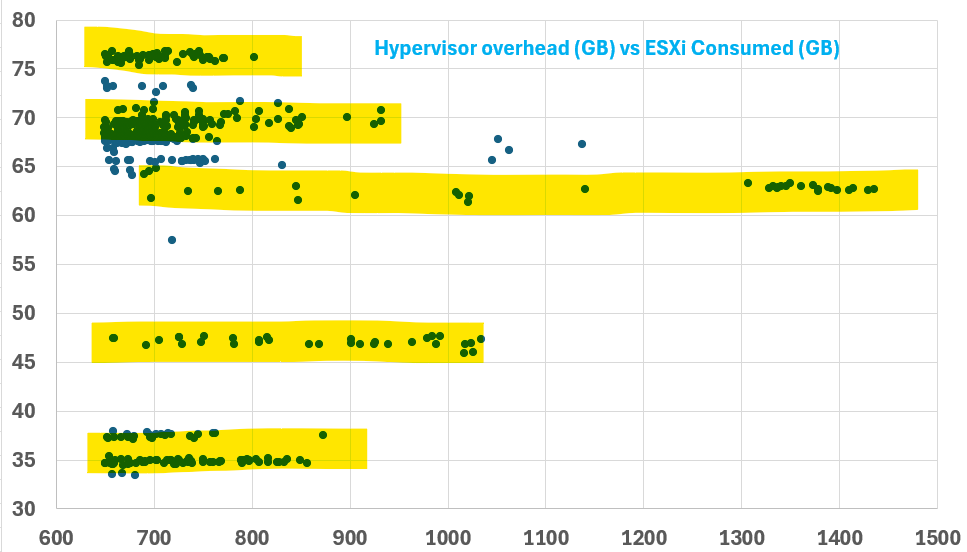
Interestingly, there are levels. From the preceding chart, you can see there are 5 groups of similar number range. I think it’s because of vSAN configuration.
Reservation
The metric name is Memory \ ESX System Usage (KB).
It is a raw counter from vCenter. Just in case you’re wondering, the name ESX System Usage is a legacy name.
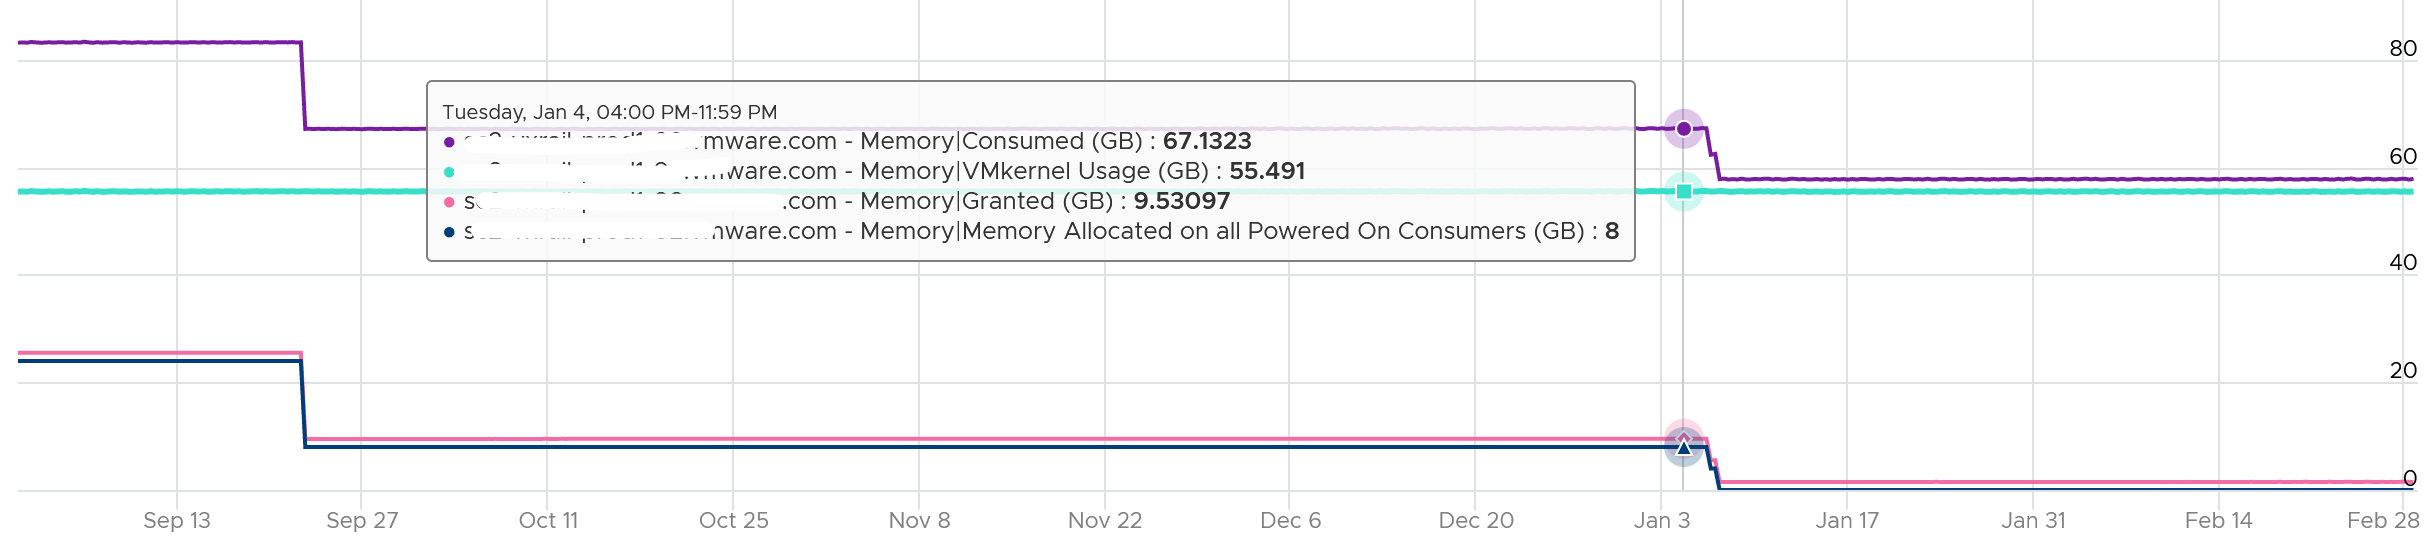
The following is an ESXi 6.7 U3 host with 1.5 TB of memory. Notice the kernel values remains constant over a long period. The number of running VM eventually dropped to 0. While the Granted counter drops to 1.5 GB (not sure what it is since there is no running VM), the kernel did not drop. This makes sense as they are reservation and not the actual usage.
Based on a sample of 500+ ESXi hosts, the range varies from 6 GB to 88 GB. In an ultra large ESXi with 12 TB RAM running vSAN and NSX, the reservation went up to 300 GB.
Utilization vs Reservation
Logically, utilization does not always correspond to the reserved amount. The following chart shows the reservation remains steady when the utilization drops by 90%, from 40 GB to single digit.
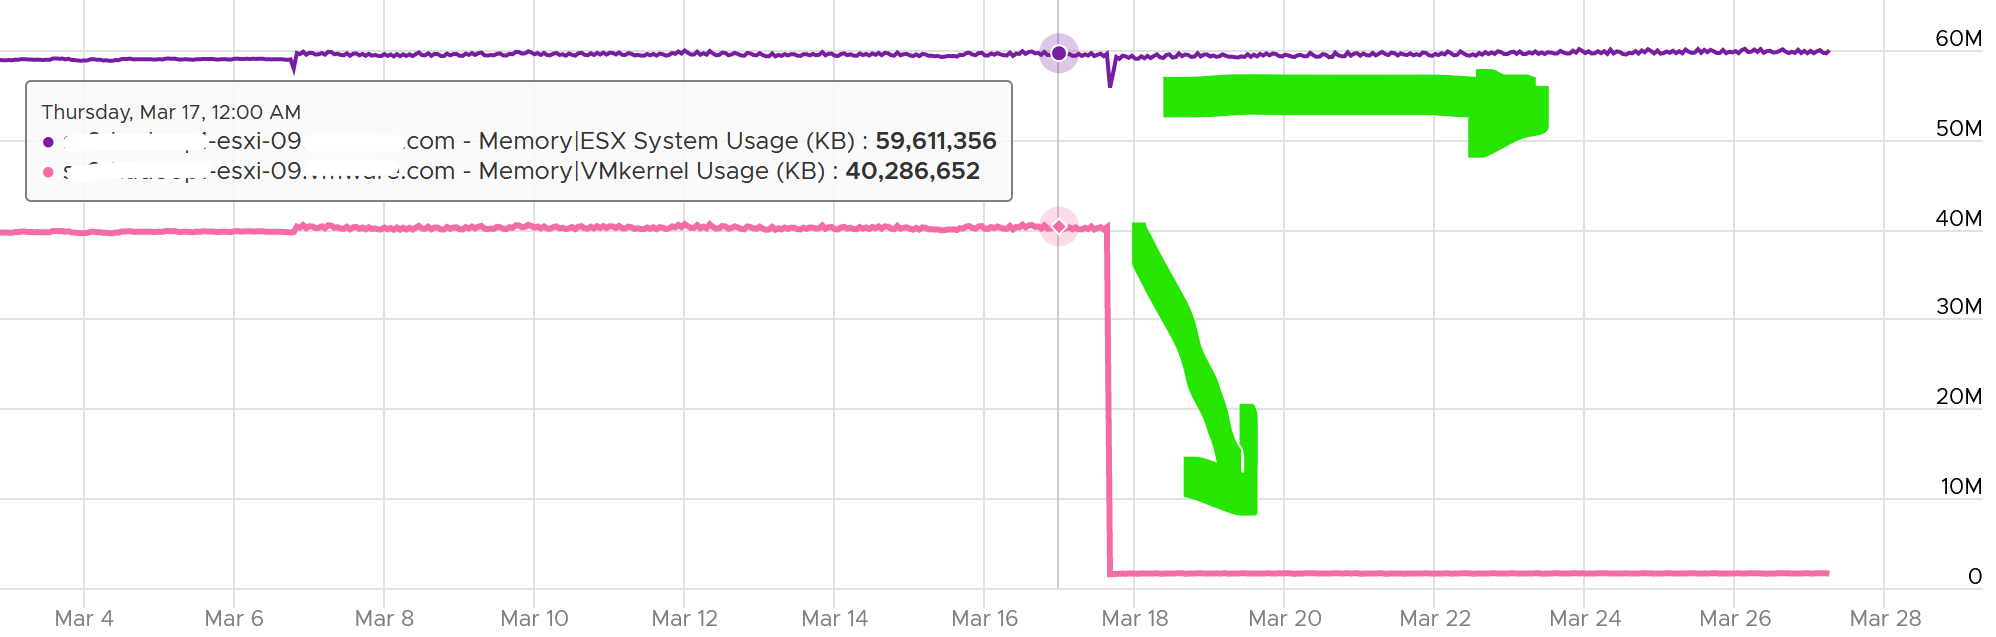
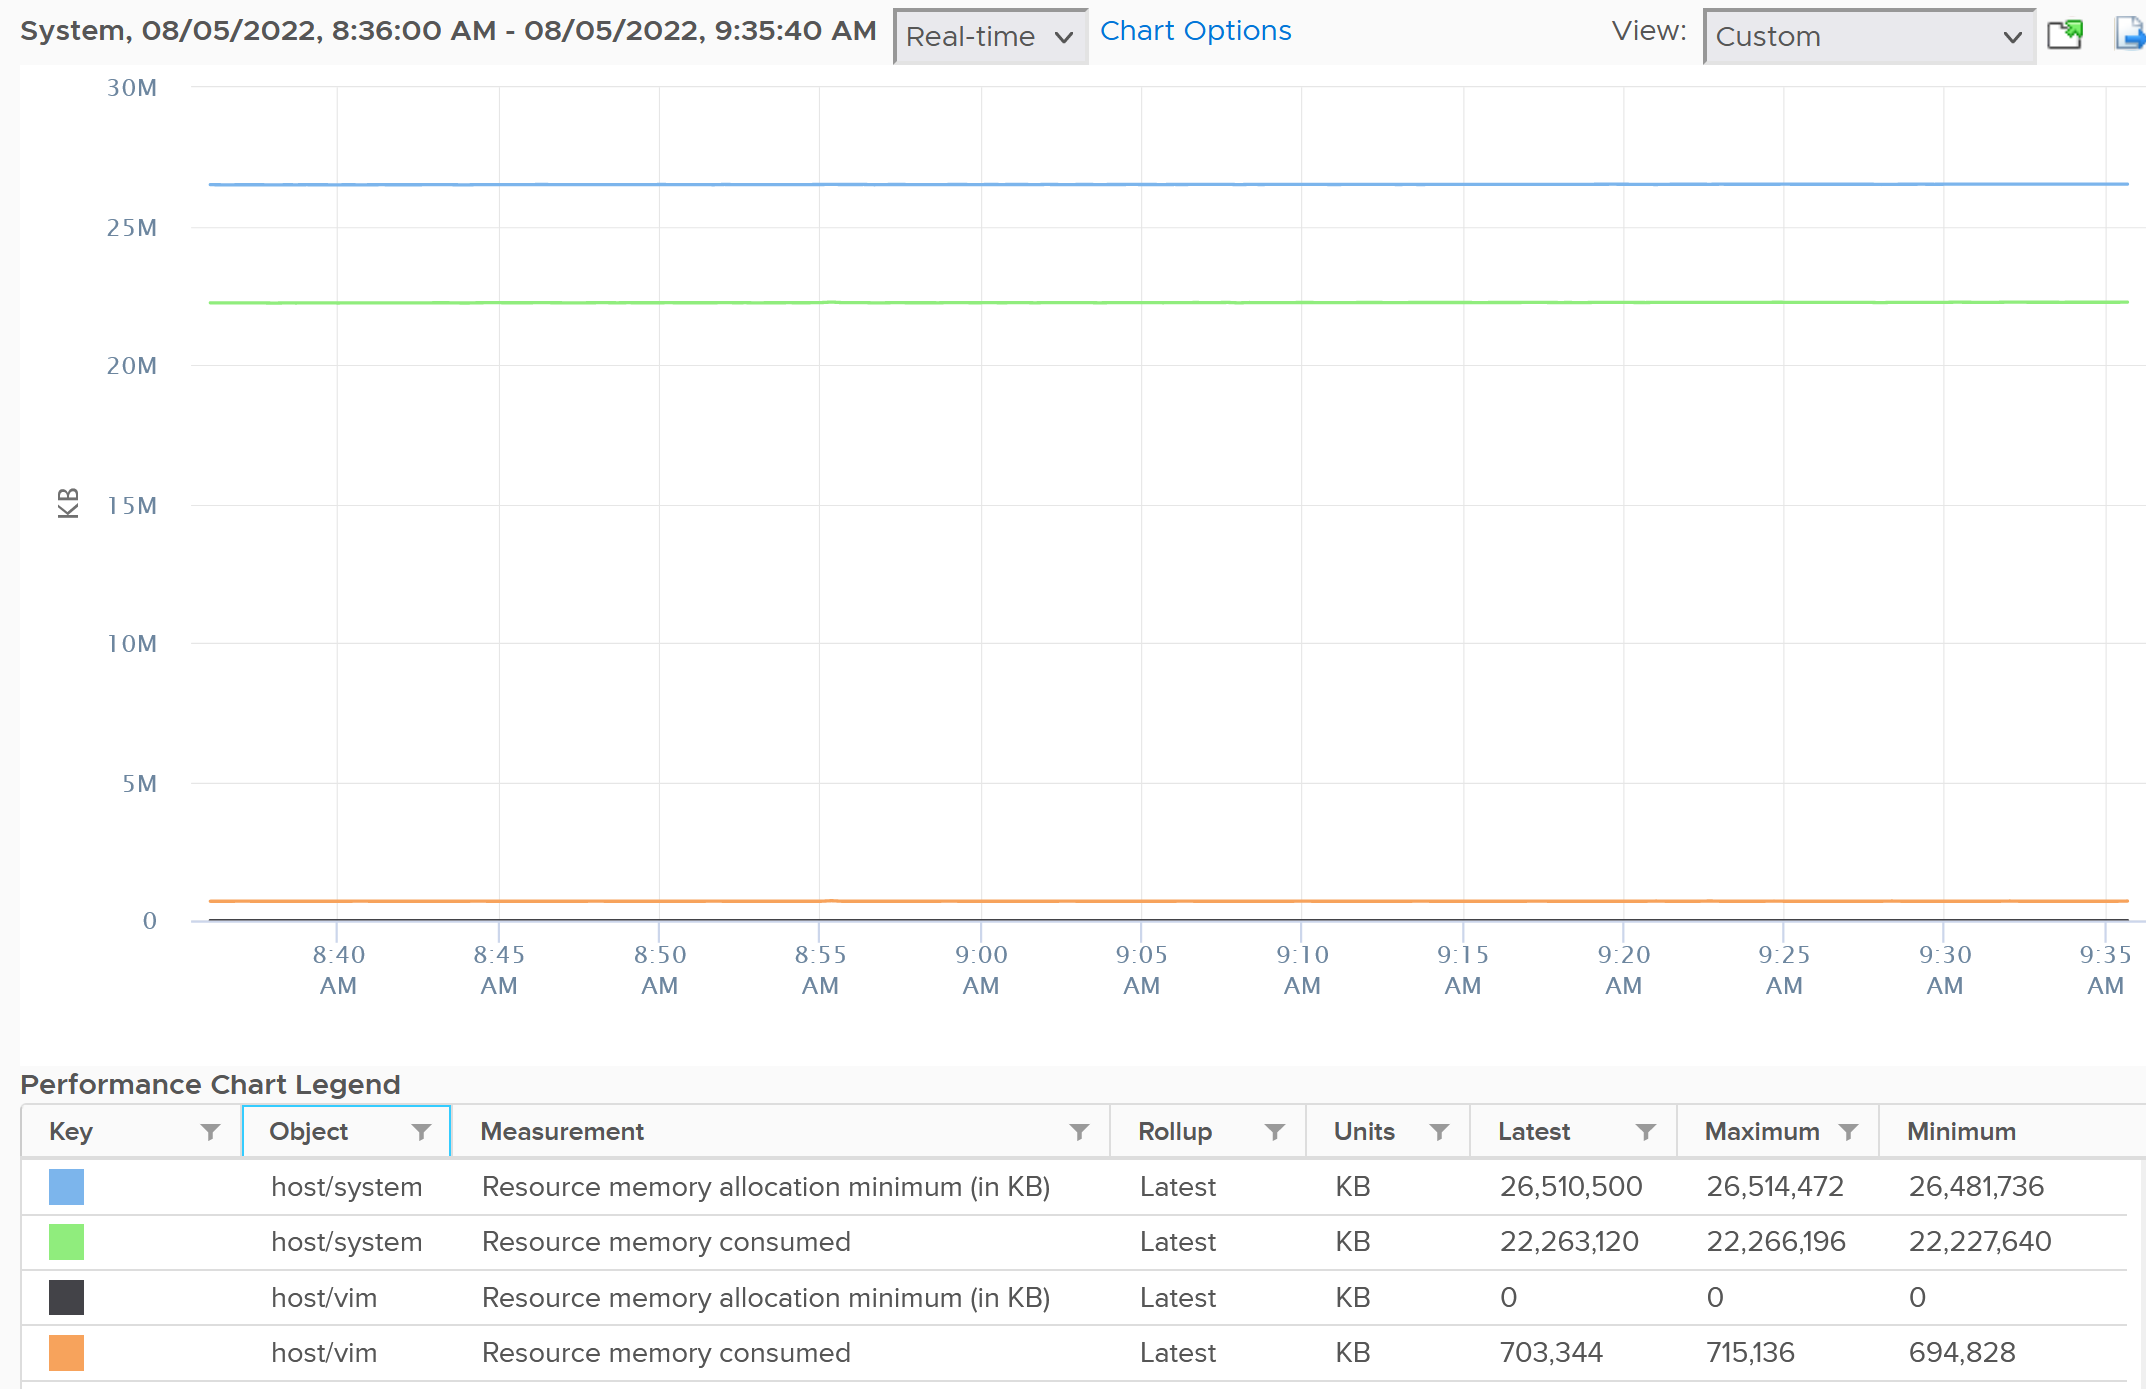
To see the actual usage, choose the metric Resource Memory Consumed metric from vSphere Client. Stack them, and you see something like this. The system part typically dwarfs the other 2 resources.
Do not take the value from Memory \ VMkernel consumed counter. That’s only the system resource. You can verify by plotting this and compare against host/system resource. You will get identical charts.
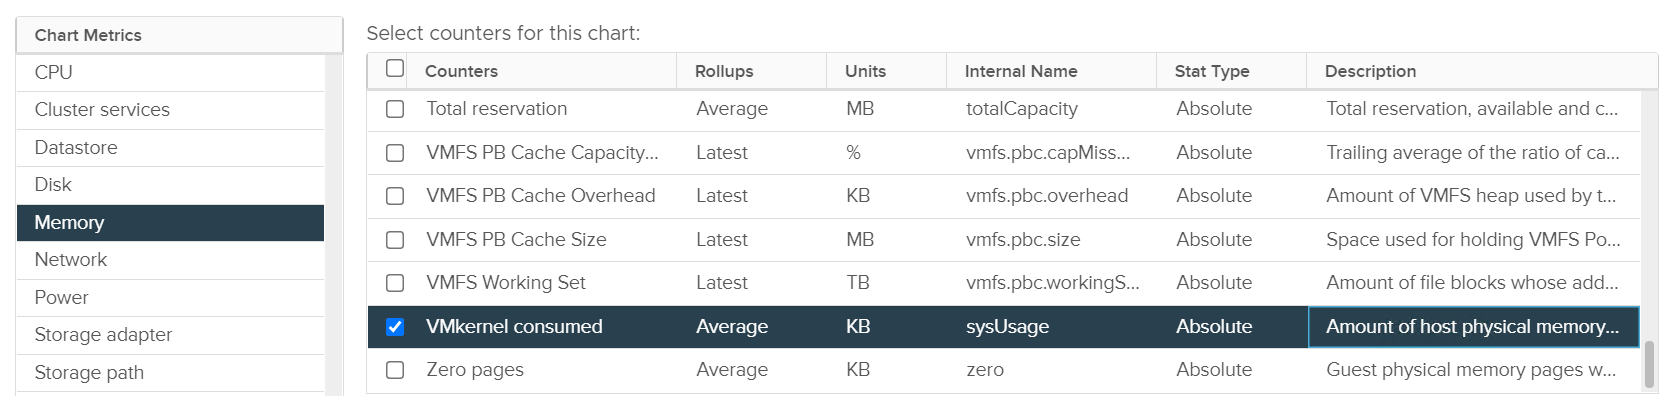
This value is for vSphere kernel modules. It does not include vSAN.
Storage
Used > Allocated
Can you use more than what you’re allocated?
That sounds illogical, doesn’t it?
Well, it can happen when “other consumption” comes into play.
For example, software-defined storage such as vSAN delivers the protection at software layer, not hardware layer.
The following screenshot shows a VM configured with 10 GB hard disk. That means the guest OS is allocated with 10 GB.
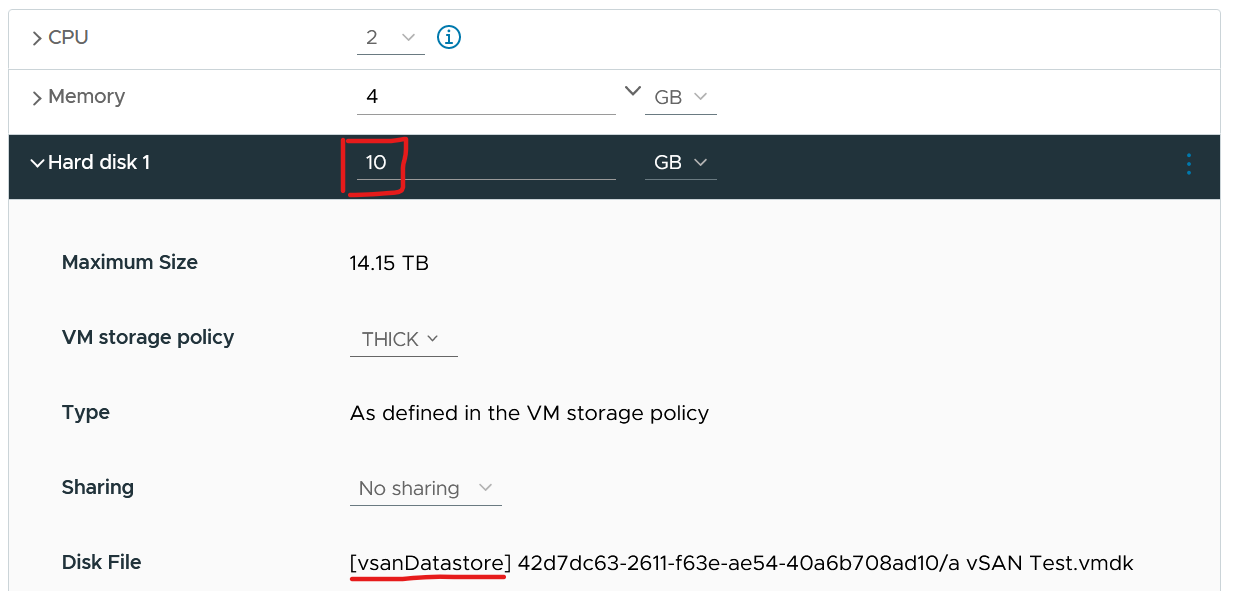
It’s thick provisioned as specified by vSAN policy.
Guess how much disk space it actually consumes at the VMFS layer?
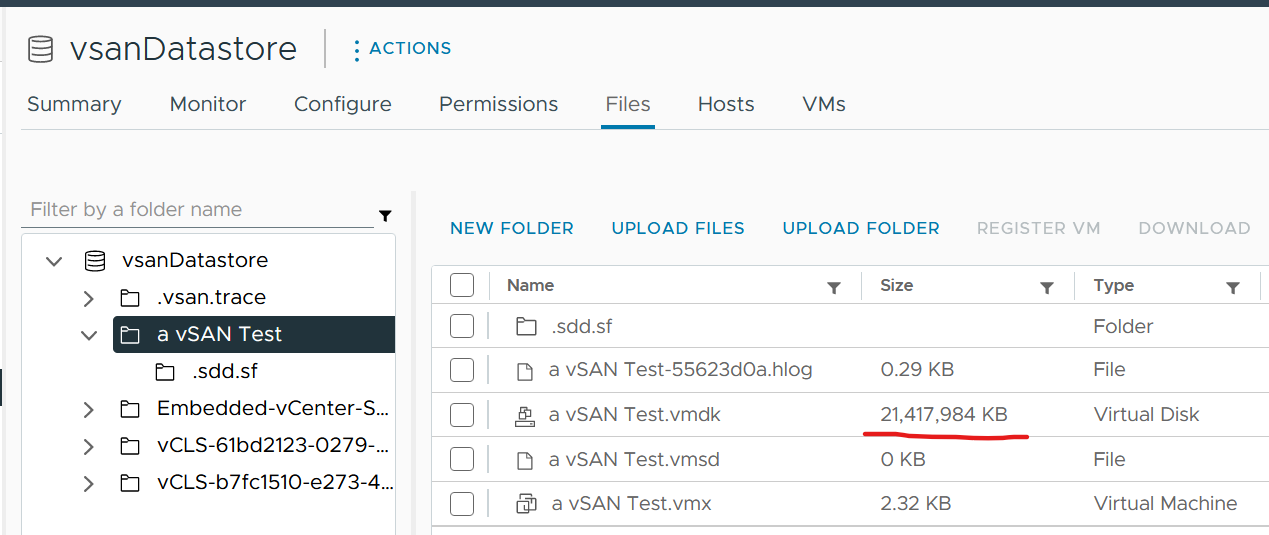
You’re right. It is 20 GB.
Implementation
Aria Operations metrics
| Memory \ Total Capacity (KB) | The capacity as seen by the kernel, which is essentially the physical size. |
|---|---|
| Memory \ Utilization (KB) | Sum of demand from all running VM (see below) + ESXi kernel reservation. Demand is the maximum of VM reservation and Guest OS needed memory + total page-in in the collection cycle (default is 5 minutes). Page in = page in rate x memory block size. If Guest OS is missing, it falls back to consumed. The amount also includes the VM memory overhead. |
| Memory \ Workload (%) | Utilization / Total Capacity. Likely this is usable. |
| Memory \ Memory Allocated on all Powered On Consumers | Sum of all running VM configured memory. This is used in allocation model. |
At the vSphere Cluster level, here are the metrics:
| Cluster Configuration \vSphere HA \ HA Memory Failover (%) | Cluster HA failover for memory. |
|----|----|
| Memory|Demand|Usable Capacity after HA and Buffer (GB) | Total Capacity minus HA above and buffer (not shown as property) |
| Memory|ESX System Usage (GB) | Kernel reservation |
| Memory \ Utilization (KB) | Sum of all ESXi |
| Memory|Demand|Workload (%) | Utilization / Usable |
| Memory \ Memory Allocated on all Powered On Consumers | Sum of all ESXi |
| Memory|Workload (%) | Normalized average of all ESXi? |
Cluster Capacity
Cluster capacity is more complex than ESXi capacity due to the following cluster-level property
| Total Capacity | Unlike ESXi, this could be dynamic due to reasons such as maintenance mode and DPM. Hybrid cloud such as VM sports on-demand host that is added dynamically. Dynamic cluster size increases complexity significantly. As a best practice, avoid removing hosts from the cluster if the cluster has < 5 ESXi hosts as your availability overhead becomes higher. |
| Buffer | For most cases, this is 10% for CPU and 0% memory. For stretched cluster, this is 50% for CPU and memory. For DR, this depends on the DR workload. |
| HA | This impacts usable capacity. For example, if it’s 9+1, then cluster average utilization at 100% means each host is averaging 90%. |
| Stretched Cluster | The 2 sites have their own capacity calculation, yet they impact each other. |
| Host-VM Affinity | The group of hosts have their own capacity, operating like a subcluster. |
| Resource Pool | Each pool has their own capacity. |
| DR | A cluster may participate in disaster recovery by providing destination during DR dry run and actual. This is why you need to specify buffer, so that usable capacity reflect this rarely happens workload. BTW, the buffer default value is 0% in VCF Operations. |
Total vs Usable
Let’s take an example.
Assuming 10 hosts in a cluster, with N+1 HA setting, and Buffer is set to 0%.
Usable Capacity is 9 hosts, so 9 is the 100% operationally.
From here, if a host is out, the calculation depends on what actually caused it. There are 3 different scenarios:
| | Intentional? | Desired? | Impact |
|------------------|--------------|----------|-----------------|
| vSphere DPM | Yes | Yes | Total Capacity |
| Maintenance Mode | Yes | No | Usable Capacity |
| HA happen | No | No! | Usable Capacity |
Intentional means it’s something you knowingly execute. In the case of vSphere DPM, it’s also something you want to happen. In the case of Maintenance Mode, you intentionally do it but it’s not something you want. So the 2 have different impact. vSphere DPM does not impact your HA as you still want HA even though you take out host(s). The length of DPM can be as long as there is no request for extra host. The length of maintenance mode should be as short as possible, hence the name maintenance.
HA events is an outage. It is obviously not something desired.
Undesired event impacts usable capacity and not total capacity.
| DPM Event | Maintenance Mode | HA Event | |
|---|---|---|---|
| Total Capacity | 9 | 10 | 10 |
| Usable Capacity | 8 | 9 | |
| Actual Availability | 9/9 = 100% | 9 / 10 = 90% | |
| Operational Availability | 9 / 8 = 100% (capped) | 9 / 9 = 100% | |
The actual availability drops to reflect reality. The operational availability remains at 100% due to N+1 HA design.
For completeness, let’s follow with a 2nd host out:
| DPM Event | Maintenance Mode | HA Event | |
|---|---|---|---|
| Total Capacity | 8 | 10 | 10 |
| Usable Capacity | 7 | 8 | |
| Actual Availability | 8 / 8 = 100% | 8 / 10 = 80% | |
| Operational Availability | 8 / 7 = 100% | 8 / 9 = 89% | |
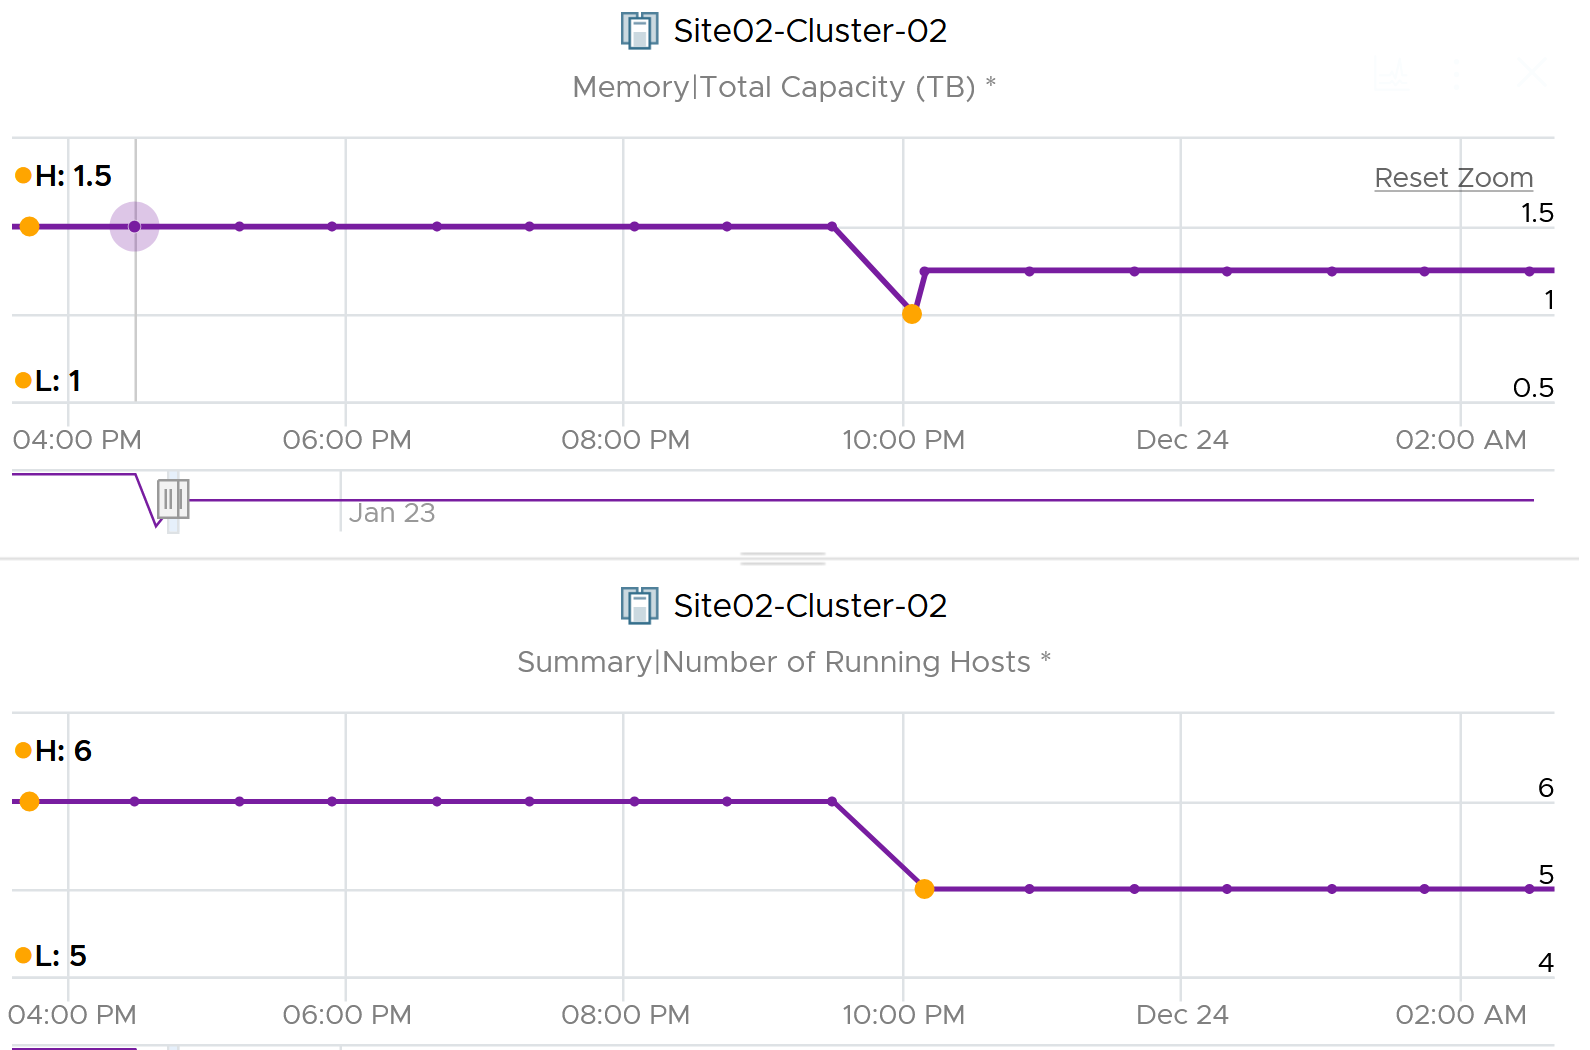
BTW, the metric Total Capacity only counts those ESXi hosts that are connected to vCenter. If a host is connection state = disconnected, its value becomes blank, so the Total Capacity is affected.
Other Metrics
Availability
The availability of a complex system such as an ESXi host is not a simple binary. There is degradation, which is important to distinguish to help manage in large farm.
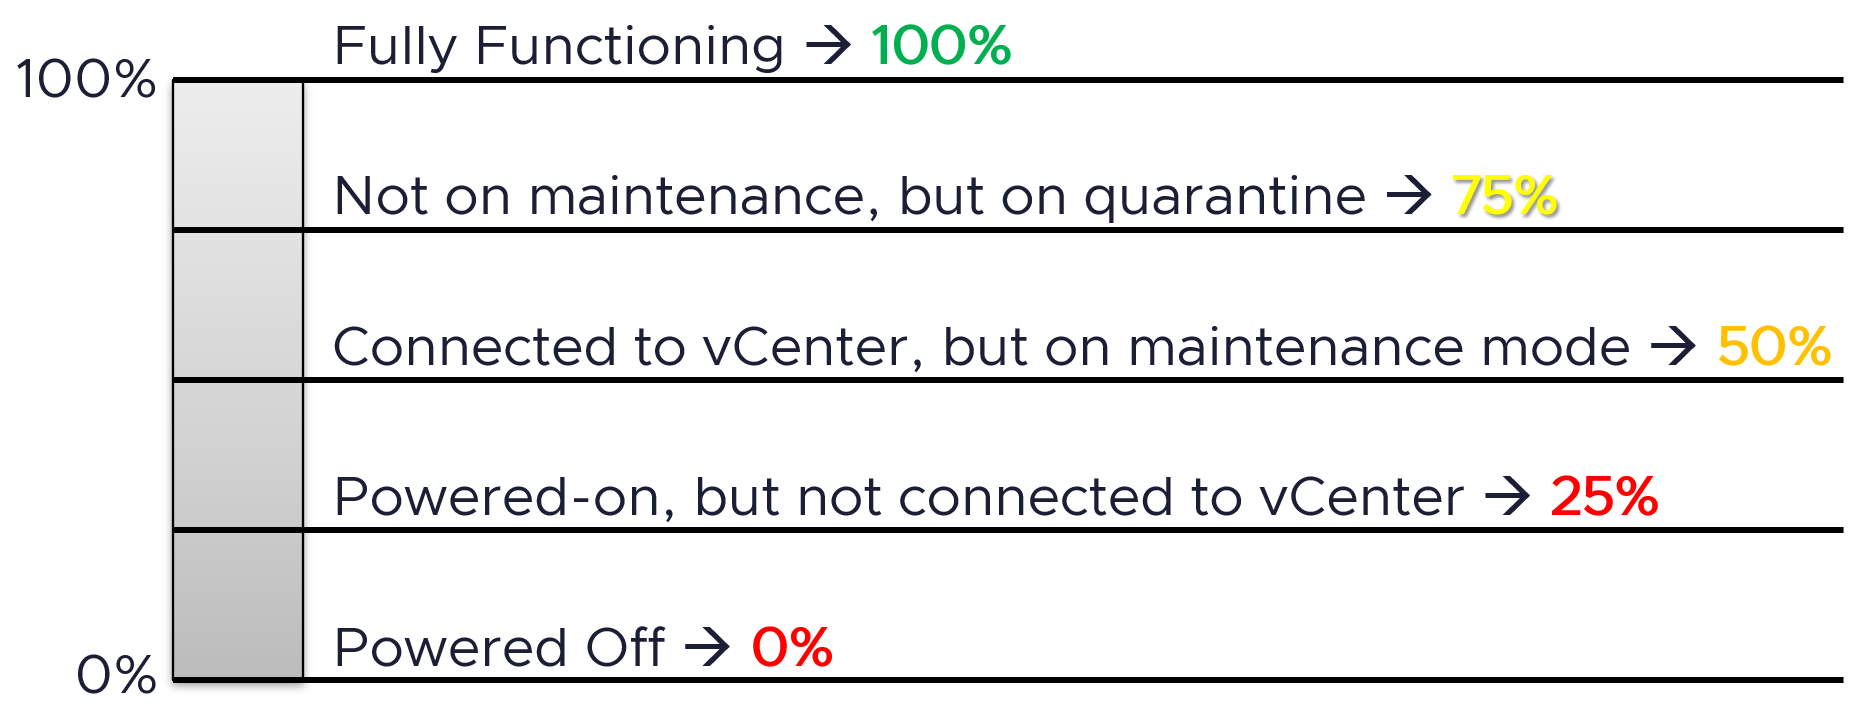
Implementation using VCF Operations super metric:
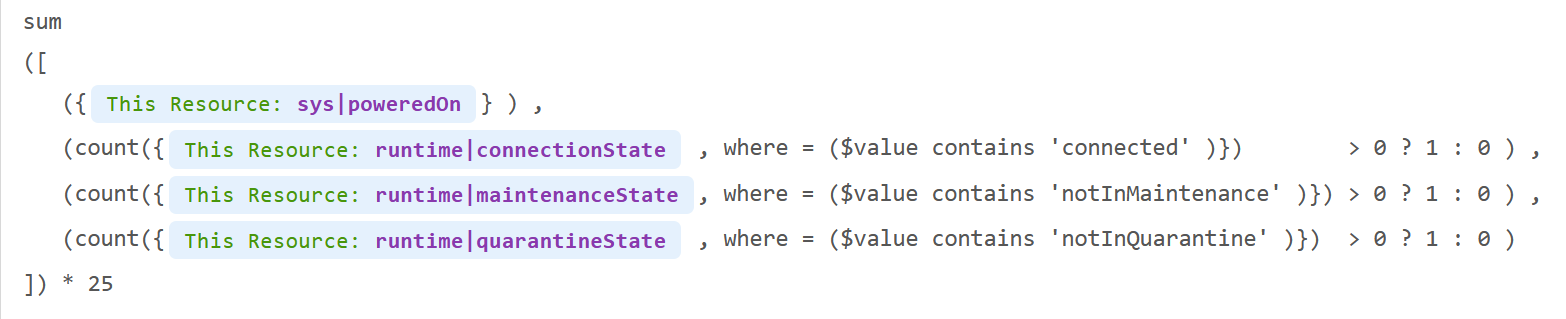
What are the limitations of the above?
Yes, it does not recognise the sub-degradation in a fully functioning ESXi. VMs running on an ESXi are unlikely to experience any performance degradation as the hardware has redundancy on network card, storage HBA, local disks, fan, and power supply. ESXi can also lose the iLO network as it’s a separate network.
esxtop
Now that we have covered many of the metrics, the esxtop output would be easier to understand. This documentation is not about how to use esxtop, but about what the metrics mean and their relevance in operations management.
Overview
While the manual uses the term Guest, esxtop does not actually have any Guest OS metrics. Distinguish between Guest OS and VM as they are 2 different realms.
The view from a VM (consumer) and the view from ESXi (provider) are of opposite nature. vCPU is a construct of a VM, while core and thread are constructs seen by ESXi. You get to see both VM level and ESXi level objects at the same time. It is confusing for newbie, but convenient for power user, and if you’re looking at esxtop, you are a power user 😊
The nature of esxtop means it is excellent for performance troubleshooting, especially real time and live situation where you know the specific ESXi Host. The tool is not so suitable for capacity management, where you need to look at long term (often weeks or months). As a result, I cover the contention metrics first, followed by consumption.
I have not had the need to use some of the metrics, hence I don’t have much guidance on them. If you do, let’s collaborate.
Grouping
The esxtop screen groups the metrics into 10 screen panels, as shown below:
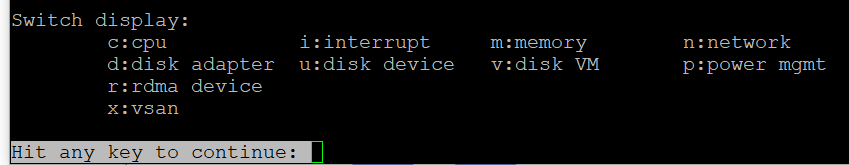
There are relationships among some of the 10 panels, but they are not obvious as the UI simply presents them as a list. To facilitate understanding of the metrics, we need to group them differently.
So instead of documenting the 10 panels, I’d group the panels into 4.
| Group | Consumer | Provider | Remarks |
| CPU | Yes | Sort of | The CPU panel has a 4 line summary that provides the provider’s viewpoint. I moved Power Management panel here as it only covers CPU. It does not cover memory, disk, network and other parts of the box (e.g. fan, motherboard). It complements the CPU panel as it covers the provider’s viewpoint. Take note that it does not show at socket level. And if you enable HT, it does not show at core level. I moved interrupt panel here as it’s about CPU. |
| Memory | 1 shared panel for both | Provider and Consumer are shown in 1 panel. The panel has a summary at the top, which cover the provider’s viewpoint | |
| Storage | Yes | Almost | The Disk VM panel covers from consumer’s viewpoint. The Disk Adapter panel and Disk Device panel cover from provider’s viewpoint, and are best to be analyzed together. BTW, notice the Path panel is missing. I moved vSAN panel here as all the metrics are disk metrics. There is no vSAN network and CPU counter, but you can see them in the respective network and CPU panel. |
| Network | 1 shared panel for both | Provider and Consumer are shown in 1 panel I moved RDMA device here as it’s about network card | |
Export
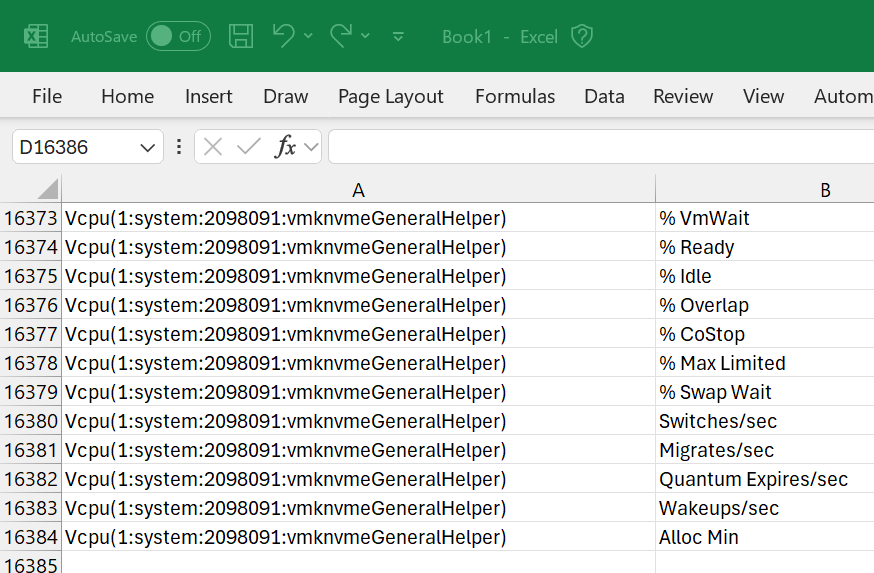
Avoid exporting to CSV file. If you need to do it, limit to specific metrics and keep the time short. If you collect everything, you end up with a large file (easily > 100 MB) with >10K metrics. The following shows 16384 metrics being collected.
CPU
The CPU panel consists of 2 parts:
-
Summary
-
Detail. It shows a table.
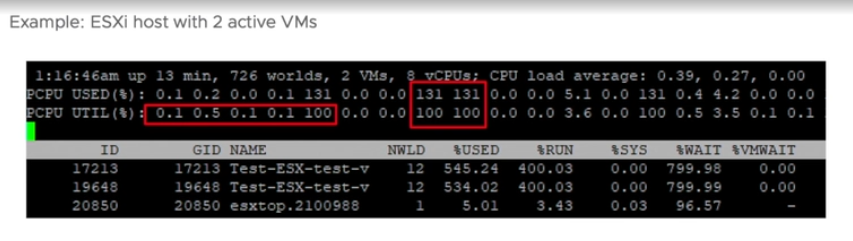
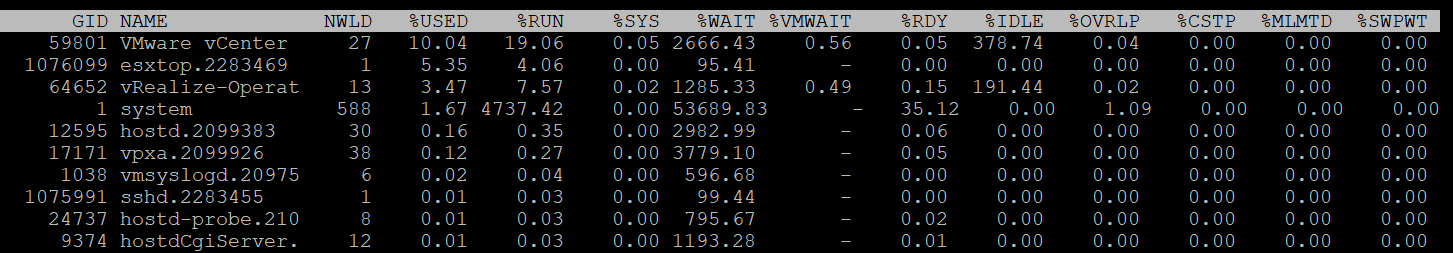
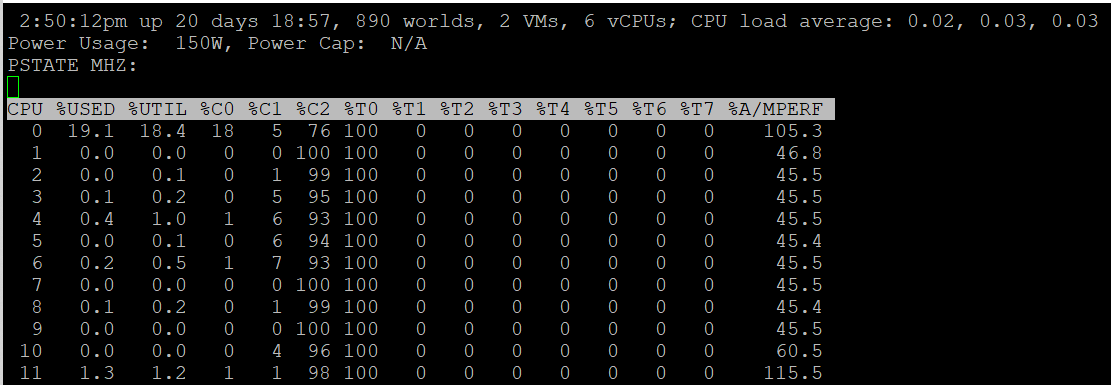
Here is the summary section. It has 4 lines.
The first line shows the summary of the physical load average in the last 1 minute, 5 minute and 15 minutes, respectively.
The next 3 lines covers Used (%), Utilization (%) and Core Utilization (%). The reason why I swapped the order in the book is Used (%) is built upon Utilization, and it’s a more complex counter. You can see in the following screenshot[^21] that Used (%) hit 131% while Util (%) maxed at 100%.
Note that their values are in percentage, meaning you need to know what they use for 100%.
If you guess that Used (%) and Utilization (%) eventually map into vSphere Client metrics Usage (%) and Utilization (%), respectively, you are right. However, you need to know how they map.
PCPU means a physical, hardware execution context. That means it is a physical core if CPU SMT is disabled, or a physical thread inside a core if SMT is enabled. It does not mean CPU socket. A single socket with 10 cores and 20 threads will have 20 PCPU metrics.
The white vertical line shows where I cut the screenshot, as the text became too small and unreadable if I were to include all of them. Anyway, it’s just repeating for each CPU physical thread.
At the end of each 3 lines (after the white line in preceding screenshot), there are NUMA information. It shows the average value across each NUMA node (hence there are 2 numbers as my ESXi has 2 NUMA nodes). The number after AVG is the whole box, system wide average. The per NUMA node metric values are useful to easily identify if a particular NUMA node is overloaded.
The detail section takes a consumer view. It is different to the physical view above.
Take a look at the panel below. Notice something interesting?
It mixes VM and non VM processes in a single table. The non-VM also has Ready time. What it does not have is VM Wait, which is expected.
If you want to only show VMs, just type the capital letter V.
-
Name based filtering allows regular expression based filtering for groups and worlds.
-
Type the capital letter G to only show groups that match given string. This is useful when a host has large number of VMs and you want to focus on a single or set of interesting VMs.
-
Once a group is expanded you can type the small letter g to show only the worlds that match the given string. This is useful when running a VM with many vCPUs and you want to focus on specific worlds like storage worlds or network worlds.
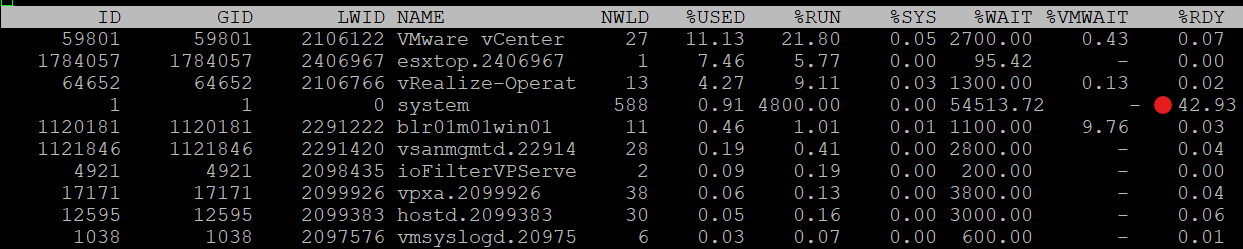
If you want to see all, how to tell which ones are VM? I use %VMWAIT column. This tracks the various waits that VM world gets, so it does not apply to non VM.
Notice the red dot in the picture. Why the Ready time is so high for system process?
Because this group includes the idle thread. Expand the GID and you will see Idle listed.
There are many columns, as shown below. The most useful one is the %State Times, which you get by pressing F.
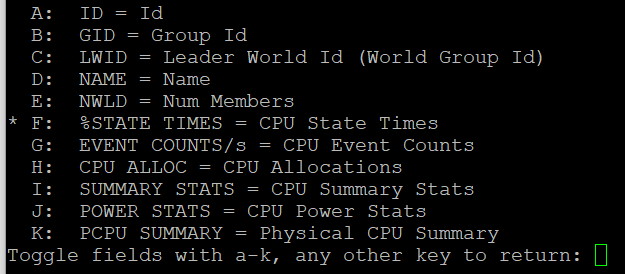
The rest of the information are relatively static or do not require sub-20 second granularity.
You know that only Utilization (%) and Used (%) exist at the thread level because they are the only one you see at, as shown below.
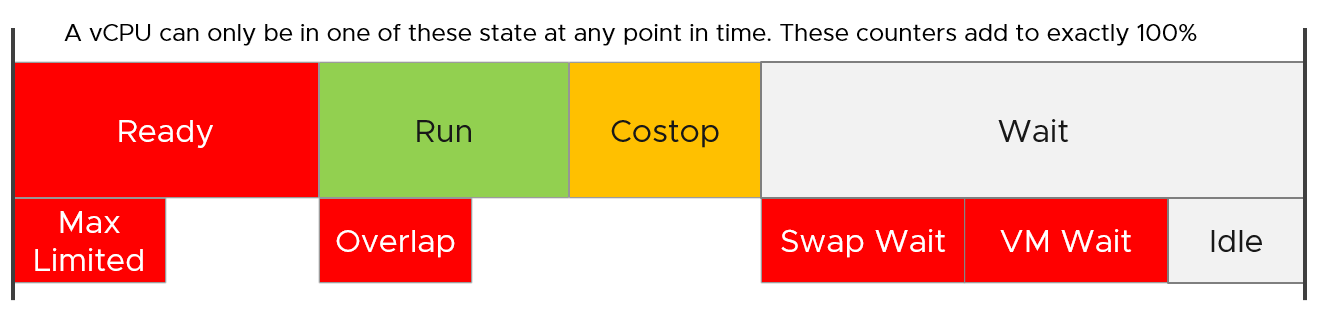
CPU State
We covered earlier in the CPU Metric that there are only 4 states. But esxtop shows a lot more metrics.
So what does it mean? How come there are more than 4 states?
The answer is below. Some of these metrics are included in the other metrics.
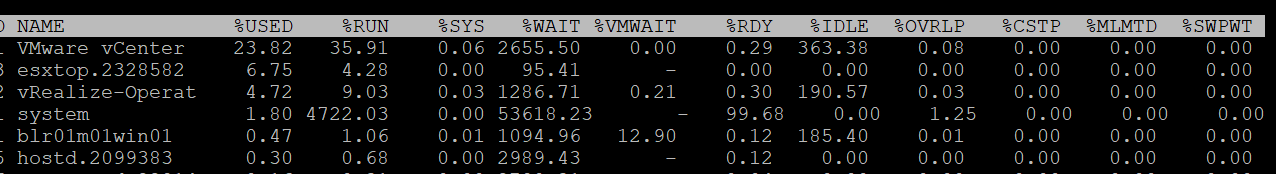
Review the metrics below, starting with %USED.
Which one does not actually belong to a CPU state, meaning it’s not something you mix with the rest?
That’s right, it’s %USED.
| %USED | It should be excluded from this panel as it is influenced by power management and hyperthreading. We explained the reason why in CPU Metric chapter. That’s why it’s necessary to review the VM CPU states before reading each esxtop metric. |
|---|---|
| %RUN | Run is covered in-depth under VM CPU Metrics. |
| %SYS | System time is covered in-depth under VM CPU Metrics. |
| %WAIT | The wait counter and its components are covered in-depth under VM CPU Metrics. VMWAIT includes SWPWT. VCF Operations does not show VM Wait and uses a new counter that excludes Swap Wait. The reason is the remediation action is different. You’re welcome. |
| %VMWAIT | |
| %SWPWT | |
| %IDLE | |
| %RDY | Ready is covered in-depth under VM CPU Metrics. As discussed in the CPU scheduling, each vCPU has its own ready time. In the case of esxtop, the metric is simply summed up, so it can go >100% in theory. |
| %CSTP | Co-Stop is covered in-depth under VM CPU Metrics. This is also 100% per vCPU. |
| %OVRLP | Overlap is covered in-depth under VM CPU Metrics. |
| %MLMTD | MLMTD is Max Limited, not some Multi-Level Marketing scam 😊. It measures the time the VM was halted due to manual limit, as opposed to the kernel has no CPU resource. This is more of an event as you should not be setting limit in the first place. |
CPU Event Count
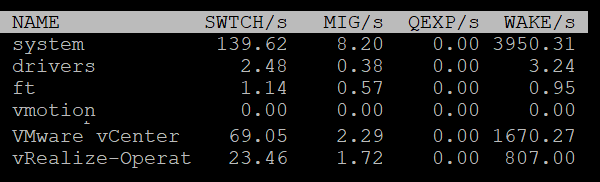
| SWTCH/s | Number of world switches per second, the lower the better. I guess this number correlates with the overcommit ratio, the number of VM and how busy they are. What number will be a good threshold and why? |
|---|---|
| MIG/s | Number of NUMA and core migrations per second. It will be interesting to compare 2 VM, where 1 is the size of a single socket, and the other is just a bit larger. Would the larger one experience a lot more switches? |
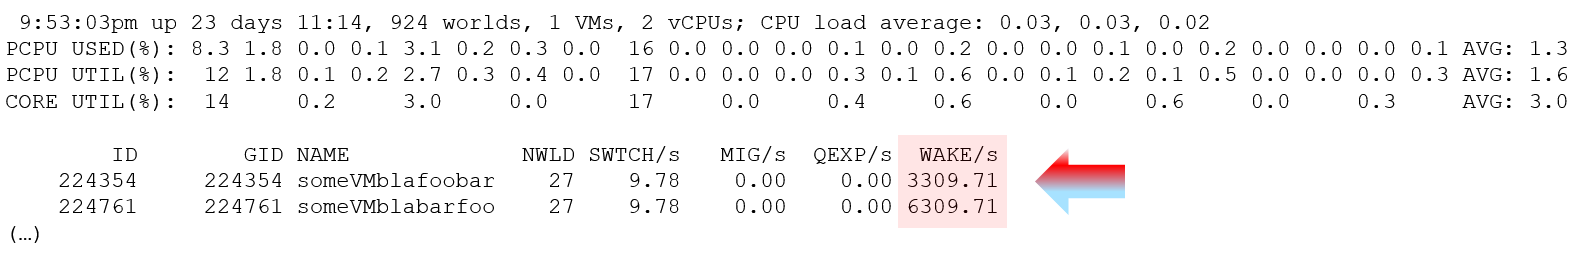
| WAKE/s | Number of time the world wakeups per second. A world wakes up when its state is changes from WAIT to READY. A high number can impact performance. |
The metric QEXP/s (Quantum Expirations per second) has been deprecated from ESXi 6.5 in an effort to improve vCPU switch time.
In rare case where the application has a lot of micro bursts, CPU Ready can be relatively higher to its CPU Run. This is due to the CPU scheduling cost. While each scheduling is negligible, having too many of them may register on the counter. If you suspect that, check esxtop, as shown below:
Summary Stats
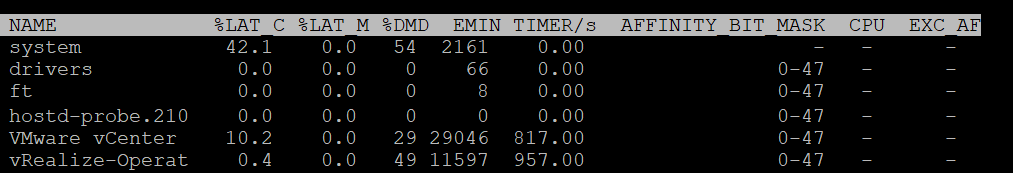
Other than the first 3 (which I’m unsure why they are duplicated here as they are shown in the CPU State already), the other metrics do not exist in vSphere Client UI and VCF Operations.
| %LAT_C | This is covered in-depth in CPU Contention |
|---|---|
| %LAT_M | This is covered in-depth in Memory contention |
| %DMD | This is covered in-depth in CPU Demand |
| EMIN | This is the minimum amount of CPU in MHz that the world will get when there is not enough for everyone. |
| TIMER/s | Timer rate for this world |
| AFFINITY BIT MASK | Bit mask showing the current scheduling affinity for the world. Not set for Latency Sensitive = High VMs |
| CPU | The physical or logical processor on which the world was running when esxtop obtained this information. BTW, I’m not 100% sure as this is always blank for me |
| EXC_AF | Yes means the VM has exclusive affinity. This happens when you enabled the Latency Sensitivity setting. Use this feature very carefully. |
The column HTQ is no longer shown in ESXi 7.0. In earlier release, this indicates whether the world is quarantined or not. ‘N’ means no and ‘Y’ means yes.
CPU Allocation
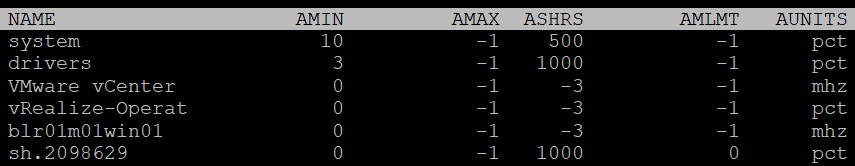
| AMIN | Allocation Minimum. Basically, the reservation |
|----|----|
| AMAX | Allocation Maximum. Basically, the limit. |
| ASHRS | Allocation shares |
| AMLMT | Max Limited. I’m unsure if this is when it’s applied or not. |
| AUNITS | Units. For VM, this is in MHz. For the kernel module, this is in percentage. |
Power Stats
This complements the power management panel as it lists per VM and kernel module, while the power panel lists per ESXi physical treads (logical CPU).
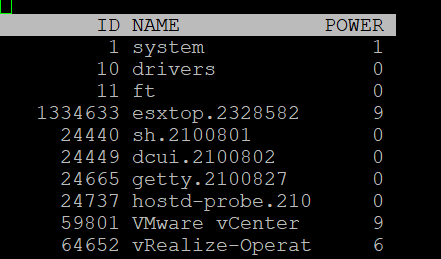
| POWER | Current CPU Power consumption in Watts. So it does not include memory, disk, etc. |
|----|----|
Power Consumption
Power management is given its own panel. This measures the power consumption of each physical thread. If you disable hyper-threading, then it measures at physical core.
The Power Usage line tracks the current total power usage (in Watts). Compare this with what the hardware specification. Power Cap shows the limit applied. You only do this hard limit when there is insufficient power supply from the rack.
The PSTATE MHZ line tracks the CPU clock frequency for each state.
Now let’s go into the table. It lists all the physical core (or thread if you enable HT). Note it does not group them by socket.
| %USED | Used (%) metric is covered in-depth in ESXi CPU metric sub-chapter. |
| %UTIL | Utilization (%) metric is covered in-depth in ESXi CPU metric sub-chapter. |
| %CState | Percentage of time spent in a C-State, P-State and T-State. Power management is covered in System Architecture sub-chapter. |
| %TState | |
| %A/Mperf | Actual / Measured Performance, expressed in percentage. The word measured in this case means the nominal or static value. So a value above 100% means Turbo, while a value below 100% means power saving kicked in. If this number is not what you are expecting, check the power policy settings in BIOS and ESXi. Notice this is not on a vCPU. This means you do not know the boost per VM. This counter is only applicable when the core is on %C0 state. In the preceding example, ignore the values from CPU 1 – CPU 11. |
The following screenshot shows ESXi with 14 P-States, where P0 is represented as 2401 MHz. Each row is a physical thread as HT is enabled.
See PCPU 10 and 11 (they share core 6). What do you notice?
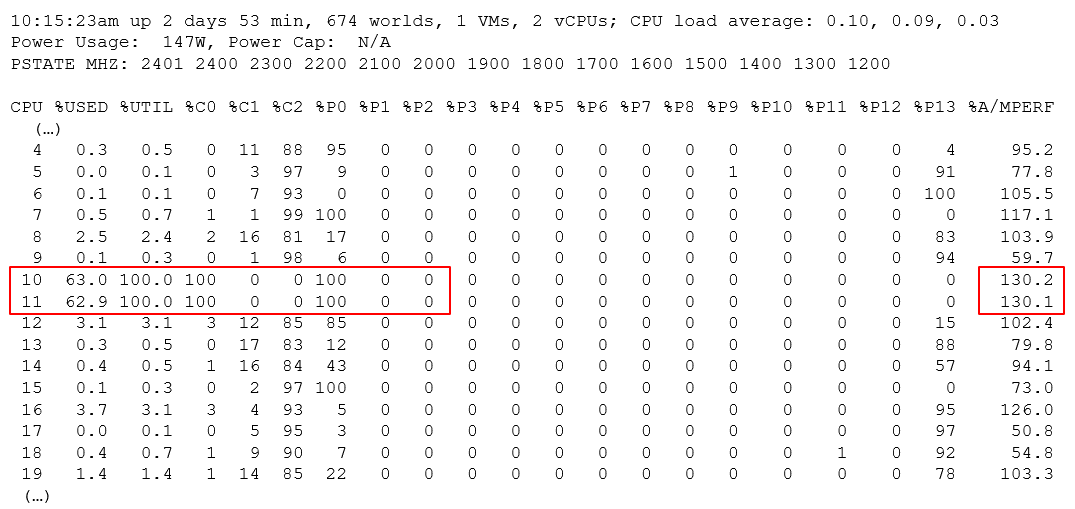
Utilization (%) shows 100% for both. This means both threads run, hence competing.
The core is in Turbo Boost. The %A/MPERF shows frequency increase of 30% above nominal. The core is in C0 state and P0 state. This counter was introduced in ESXi 6.5. It is not available via vSphere Client UI.
Why is Used (%) for PCPU 10 and 11 are showing 63.0% and 62.9%?
Unlike Utilization (%) which adds up to 200%, Used (%) adds up to 100%. So each thread maxes out at 50%. But Used (%) considers frequency scaling. Since there is a turbo boost at 130%, you get 50% x 130% = 65%. Pretty close to the numbers shown there.
Interrupt
This panel captures the interrupt vectors. In the following screenshot, I’ve added 2 vertical white lines to show where I cropped the screenshot. It’s showing the value of each CPU thread, so the column became too wide.
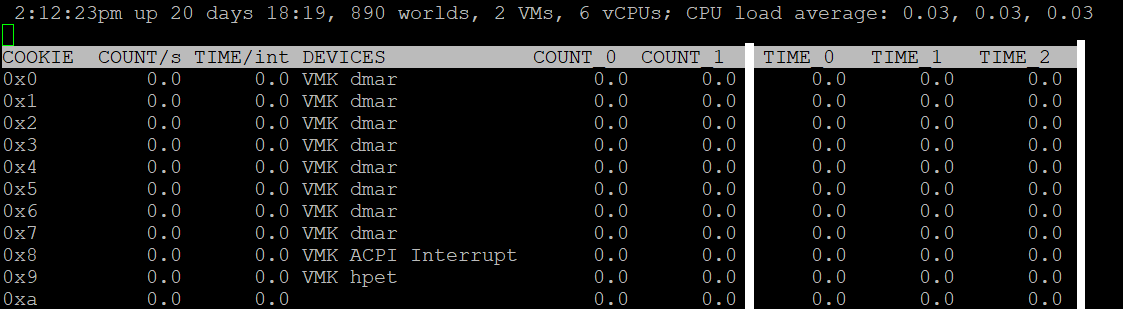
| COUNT/s | Total number of interrupts per second. This value is cumulative of the count for every CPU. |
| COUNT_x | Count 0, Count 1, etc. Interrupts per second on CPU x. My guess is CPU 0 is the first thread in the first core in the first socket. |
| TIME/int | Average processing time per interrupt (in microseconds). It will be interesting to profile this for each type of interrupt. |
| TIME_x | Time 0, Time 2, etc. Average processing time per interrupt on CPU x (in microseconds). |
| DEVICES | Devices that use the interrupt vector. If the interrupt vector is not enabled for the device, its name is enclosed in angle brackets (< and >). |
To see the list of devices, issue the command at ESXi console: sched-stats -t sys-service-stats. You will get something like this:
service count time maxElapsed maxService name
32 98973493 171.267 0.000 0.000 VMK-lsi_msgpt3_0
33 93243036 153.993 0.000 0.000 VMK-lsi_msgpt3_0
34 1783955246 1841.025 0.000 0.000 VMK-igbn-rxq0
36 4 0.000 0.000 0.000 VMK-Event
37 167025903 418.733 0.000 0.000 VMK-xhci0-intr
51 242318260 792.014 0.000 0.000 VMK-0000:19:00.1-TxRx-0
60 21281764 80.125 0.000 0.000 VMK-vmw_ahci_00003b000
244 176227 0.090 0.000 0.000 VMK-timer-ipi
245 1250405 0.163 0.000 0.000 VMK-monitor
246 1868139923 340.709 0.000 0.000 VMK-resched
248 414047027 189.255 0.000 0.000 VMK-tlb
4096 3193917027 1321.416 0.000 0.000 0_2nd-level-intr-handler
4097 304258696 193.711 0.000 0.000 1_smpcall
4099 246 0.003 0.000 0.000 3_VOB-Wakeup
4100 35706272 6.186 0.000 0.000 4_TimerBH
4101 399313616 10339.744 0.000 0.000 5_fastSlab
4104 859208 7.851 0.000 0.000 8_logEvent
4105 109560008 158.914 0.000 0.000 9_netTxComp
4106 26 0.197 0.196 0.196 10_keyboard
4107 56 0.001 0.000 0.000 11_SMIEnableCountPCPU-bh
4165 365305096 2433.530 0.001 0.001 TCPIPRX
4167 54024607 55.359 0.000 0.000 SCSI
4171 54520415 124.983 0.000 0.000 START-PATH-CMDS
4173 55109136 254.927 0.000 0.000 COMPL.-ADAPTER-CMD
4174 55102189 85.804 0.000 0.000 START-ADAPTER-CMDS
4180 5254928064 13877.461 0.001 0.001 Netpoll
BTW, some services maybe combined and reported under VMK-timer. For example, IOChain from vSphere Distributed Switch does not appear on its own.
Memory
The top part of the screen provides summary at ESXi level. They are handy in seeing overall picture, before diving into each VM or the kernel modules.
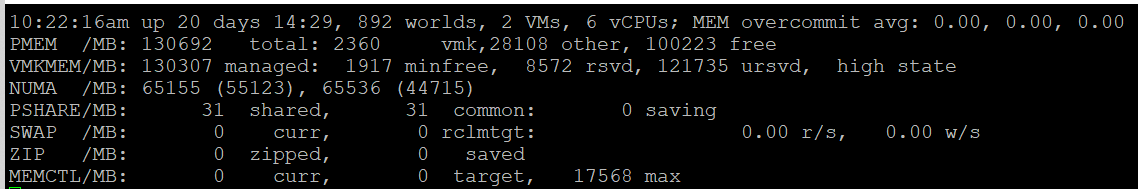
| MEM overcommit avg | Average memory overcommit level in the last 1-minute, 5-minute, and 15-minute, respectively. Calculation is done with Exponentially Weighted Moving Average. Memory overcommit is the ratio of total requested memory and the "managed memory" minus 1. According to this, the kernel computes the total requested memory as a sum of the following components:
If the ratio is > 1, it means that total requested VM memory is more than the physical memory available. This is fine, because ballooning and page sharing allows memory overcommit. I’m puzzled why we mix allocation and utilization. No 1 and no 3 make sense, but what exactly is no 2? My recommendation is you simply take the configured VM memory and ignore everything else. While it’s less accurate, since the purpose is capacity and not performance, it’s more than good enough and it’s easier to explain to management. There is no need to get other details. |
|---|---|
| PMEM | Physical Memory. Total = vmk + Other + Free Total is what is reported by BIOS. vmk is ESXi the kernel consumption. This includes kernel code section, kernel data and heap, and other the kernel management memory. Other is memory consumed by VM and non VM (user-level process that runs directly on the kernel) |
| VMKMEM | The kernel memory. The following metrics are shown:
I have not found a practical use case for the above 4 metrics. If you do, let me know! State is the memory state. You want this to be on high state. |
| NUMA | In the preceding screenshot, there are 2 NUMA nodes. For each node there are 2 metrics: the total amount and the free amount. Note that the sum of all NUMA nodes will again be slightly smaller than total, for the same reason why the kernel managed is less than total. If you enable Cluster-on-Die feature in Intel Xeon, you will see 2x the number of nodes. For details, see this by Frank Denneman. |
| PSHARE | shared: the amount of VM physical memory that is being shared. common: the amount of machine memory that is common across Worlds. saving: the amount of machine memory that is saved due to page-sharing. |
| SWAP | Swapped counter is covered under VM memory. What “cannot” be zipped is swapped. What you see on this line is sum of all the VMs. The metric rclmtgt shows the target size in MB that ESXi aims to swap. |
| ZIP | Zipped counter is covered under VM memory. What you see on this line is sum of all the VMs. |
| MEMCTL | Memory Control, also known as ballooning, is covered here under VM memory. What you see on this line is sum of all the VMs. |
There are a lot of metrics in many panels. It’s easier to understand if we group them functionally.
Contention
As usual, we start with the contention-type of metrics.
Balloon
I start with Balloon as this is the first level of warning. Technically, this is not a contention. Operationally, you want to start watching as Balloon only happens at 99% utilization. So it’s high considering you have HA enabled in the cluster.
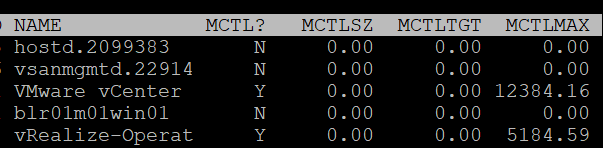
| | |
|----|----|
| MCTL? | ‘Y’ means the line is a VM, as the kernel processes is not subjected to ballooning. |
| MCTLSZ (MB) | Memory Control Size is the present size of memory control (balloon driver). If larger than 0 hosts is forcing VMs to inflate balloon driver to reclaim memory as host is overcommitted |
| MCTLTGT (MB) | Amount of physical memory the ESXi system attempts to reclaim from the resource pool or VM by way of ballooning. If this is not 0 that means the VM can experience ballooning. |
| MCTLMAX (MB) | Maximum amount of physical memory the ESXi system can reclaim from the resource pool or VM by way of ballooning. This maximum depends on the type of Guest OS. |
Compressed & Swapped
I think that Swap and Compressed should be shown together as what can’t be compressed is swapped.
Why am I showing Compressed first?
Because it’s faster than swapped.
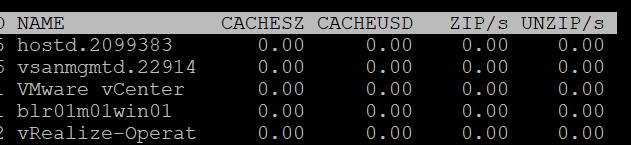
| CACHESZ (MB) | Compression memory cache size. |
| CACHEUSD (MB) | Used compression memory cache |
| ZIP/s (MB/s) | The rate at which memory pages are being zipped. Once zipped, it’s not immediately available for the VM. This is a capacity problem. Your ESXi needs more RAM. If the pages being zipped is unused, the VMs will not experience memory contention. Keep this number 0. See Capacity chapter for details. |
| UNZIP/s (MB/s) | The rate at which memory pages are being unzipped so it can be used by VM. This is a performance problem. The pages are being asked. The VM CPU is waiting for the data. If you check the VM memory contention counter, it will not be 0%. Make sure that number is within your SLA or KPI. |
Swapped
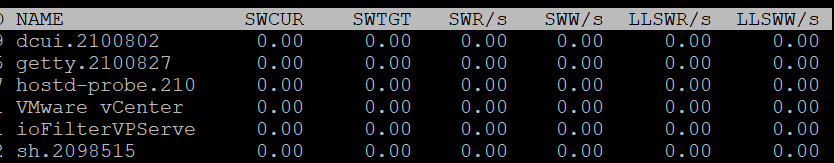
| SWCUR (MB) | Swapped Current is the present size of memory on swapped. It typically contains inactive pages. |
| SWTGT (MB) | The target size the ESXi host expects the swap usage by the resource pool or VM to be. This is an estimate. |
| SWR/s (MB) | Swapped Read per second and Swapped Write per second. The amount of memory in megabyte that is being brought back to memory or being moved to disk |
| SWW/s (MB) | |
| LLSWR/s (MB) | These are similar to SWR/s but is about host cache instead of disk. It is the rate at which memory is read from the host cache. The reads and writes are attributed to the VMM group only, so they are not displayed for VM. LL stands for Low Latency as host cache is meant to be faster (lower latency) than physical disk. Memory to host cache can be written from both the physical DIMM and disk. So the counter LLSWW/s covers all these sources, and not just from physical DIMM. |
| LLSWW/s (MB) |
NUMA
Logically, this statistic is applicable only on NUMA systems.
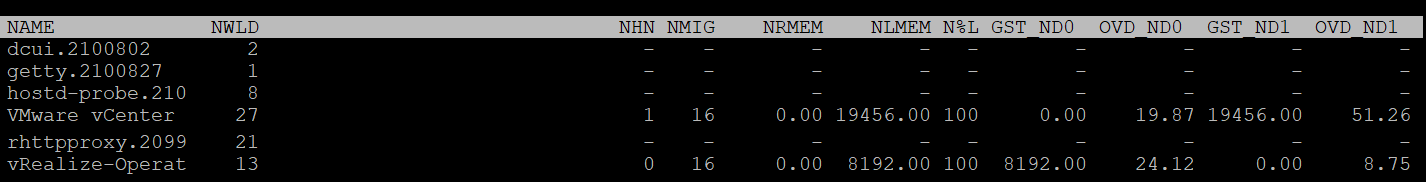
| NHN | The count of NUMA Home Node for the resource pool or VM. If the VM has no home node, a dash (-) appears. You want to see the number 1. If you see the number 2, that means the VM is split into multiple nodes, which could impact performance. When you enable CPU Hot Add, esxtop will report multiple home nodes as NUMA is disabled. It also does not distinguish remote and local memory as memory is interleaved. For more information, see this by Frank. |
| NMIG | Number of NUMA migrations. It gets reset upon VM power cycle, meaning this counter is accumulative. Be careful as you could be looking at past data. Use Log Insight to plot the event over time. Migration is costly as all pages need to be remapped. Local memory starts at 0% again and grow overtime. Copying memory pages across NUMA boundaries cost memory bandwidth. |
| NRMEM (MB) | Current amount of remote memory allocated to the VM or resource pool. Ideally this amount is 0 or a tiny percentage. You decrease the chance by decreasing the VM configured RAM. A VM whose configured memory is larger than the ESXi RAM attached to a single CPU socket have higher chance of having remote memory. |
| N%L | Current percentage of memory allocated to the VM or resource pool that is local. Anything less than 100% is not ideal. |
| GST_NDx (MB) | Guest memory allocated for a resource pool on NUMA node x, where GST_ND0 means the first node. The following screenshot shows the VMware vCenter VM runs on node 2 while the vRealize-Operat VM runs on node 1.
|
| OVD_NDx (MB) | VMM overhead memory allocated for a resource pool on NUMA node x, where x starts with 0 for the first node. |
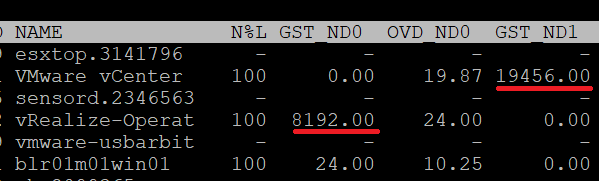
Consumption
I group metrics such as consumed, granted, and overhead under consumption as they measure how much the VM or the kernel module consumes.
Consumed
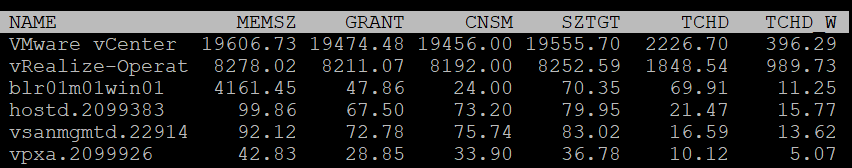
| MEMSZ (MB) | Amount of physical memory allocated to a resource pool or VM. The values are the same for the VMM and VMX groups. MEMSZ = GRANT + MCTLSZ + SWCUR + "never touched" I’m unsure where the compressed page goes. It’s still occupying space but 50% or 25%. |
| GRANT (MB) | Do not confuse it with Consumed 😊 |
| CNSM | Yup, this is that legendary Consumed metric. |
| SZTGT (MB) | Size Target in MB. Amount of machine memory the ESXi kernel wants to allocate to a resource pool or VM. The values are the same for the VMM and VMX groups. |
| TCHD (MB) | The size of touched pages in MB Working set estimate for the resource pool or VM. The values are the same for the VMM and VMX groups. |
| TCHD_W | As per above, but only for the write operations. A relatively much lower value compared to TCHD means the activities are mostly read. |
Overhead
I find overhead is a small amount that is practically negligible, considering ESXi nowadays sports a large amount of RAM. Let me know the use case where you find otherwise.
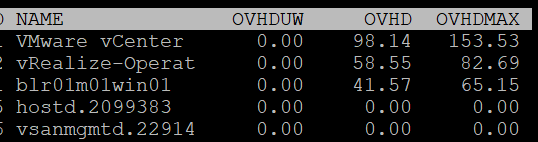
| | |
|----|----|
| OVHD (MB) | Current space overhead for resource pool. |
| OVHDMAX (MB) | Maximum space overhead that might be incurred by resource pool or VM. |
| OVHDUW (MB) | Current space overhead for a user world. It is intended for VMware use only. |
Shared
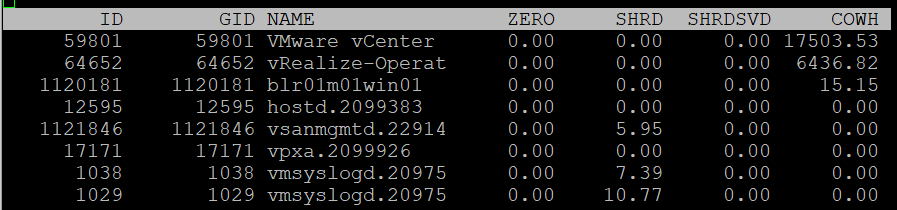
| ZERO (MB) | Resource pool or VM physical pages that are zeroed. |
| SHRD (MB) | Total amount that is shared. |
| SHRDSVD (MB) | Machine pages that are saved because of sharing. Notice this counter does not exist in vSphere Client UI. |
| COWH (MB) | Copy on Write Hint. An estimate of the amount of Guest OS pages for TPS purpose. |
Active
The manual uses the word Guest to refer to VM. I distinguish between VM and Guest. Guest is an OS, while a VM is just a collection of processes. Guest has its own memory management that is completely invisible to the hypervisor.
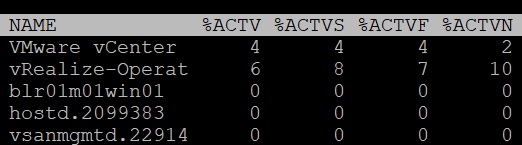
| %ACTV | Active is covered in-depth in Active metric |
| %ACTVS | Percentage Active Slow and Percentage Active Fast. Slow is the slow moving average, taking longer period. Longer is more accurate. I don’t have a use case for the fast moving average. |
| %ACTVF | |
| %ACTVN | Percentage Active Next. It predicts of what %ACTVF will be at next sample estimation. It is intended for VMware use only. |
Committed
Committed page means the page has been reserved for that process. Commit is a counter for utilization but it’s not really used, especially for VM.
Note: none of these metrics exist in vSphere Client and VCF Operations, as they are meant for internal use.
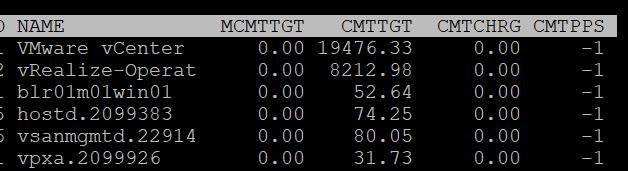
| | |
|----|----|
| MCMTTGT | Minimum Commit Target in MB. I think this value is not 0 when there is reservation, but I’m not sure. |
| CMTTGT | Commit Target in MB. |
| CMTCHRG | Commit Charged in MB. I think this is the actual committed page. |
| CMTPPS | Commit Pages Per Share in MB |
Allocation & Reservation
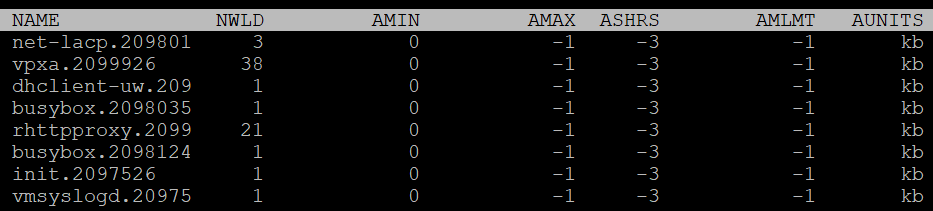
| AMIN | Allocation minimum. This is the term esxtop uses for memory reservation for this resource pool or VM. A value of 0 means no reservation, which is what you should set for most VM. Reservation for the kernel modules should be left as it is. |
| AMAX | Allocation maximum. This is the term esxtop uses for memory limit for this resource pool or VM. A value of -1 means Unlimited. Limit for the kernel modules should be left as it is. |
| AMLMT | Limit. You should expect the value -1, means no limit assigned. I’m not sure how this differs to AMAX. |
| ASHRS | Memory shares for this resource pool or VM. |
| AUNITS | This is just displaying the units of allocations counters |
Checkpoint
Checkpoint is required in snapshot or VM suspension. You can convert a VM checkpoint into a core dump file, to debug the Guest OS and applications.
| CPTRD (MB) | Checkpoint Read. Amount of data read from checkpoint file. A large amount can impact the VM performance. |
| CPTTGT (MB) | Checkpoint Target. The target size of checkpoint file that the kernel is aiming for. I’m unsure why it needs to have a target, unless this is just an estimate of the final size and not a limit. |
Storage
The Storage monitoring sports 3 panels:
-
VM
-
Adapter
-
Device
We covered in Part 2 that an ESXi host has adapter, path and devices. I’m unsure why esxtop does not have a panel for path. It would be convenient to check dead path or inactive path as the value will be all 0. If your design is active/active, it can be useful to compare if their throughput is not lopsided.
Datastore is also missing. While VMFS can be covered with Device (if you do 1:1 mapping and not using extent), NFS is not covered.
On the other hand, esxtop does provide metrics that vSphere Client does not. I will highlight those.
ESXi uses adapter to connect to device. As a result, their main contention and utilization metrics are largely similar. I’ve put them side by side here, and highlight the similar metric groups with vertical green bar. I highlighted the word group, as the group name may be identical, but the actual metrics within the group differ.
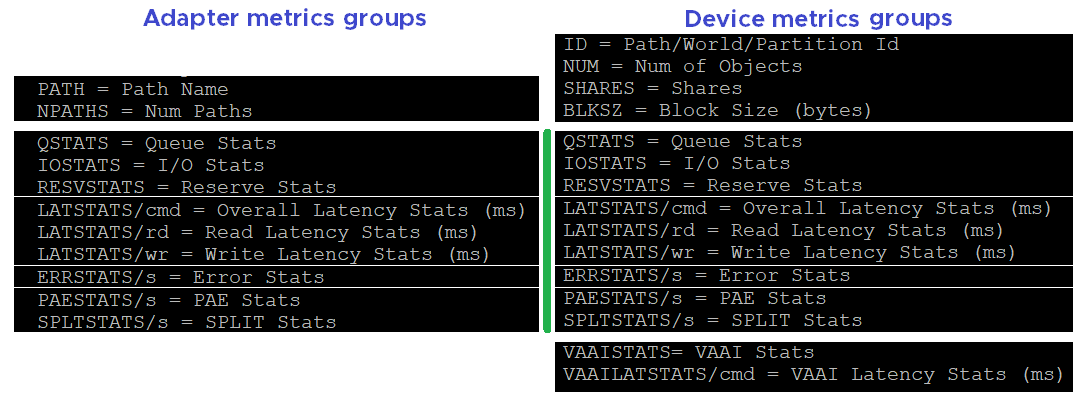
VM
We begin with VM as that’s the most important one. It complements vSphere Client by providing unmap and IO Filter metrics.
You can see at VM level, or virtual disk level. In the following screenshot, I’ve expanded one of the VM. The VM shown as vRealize-Operat has 3 virtual devices.
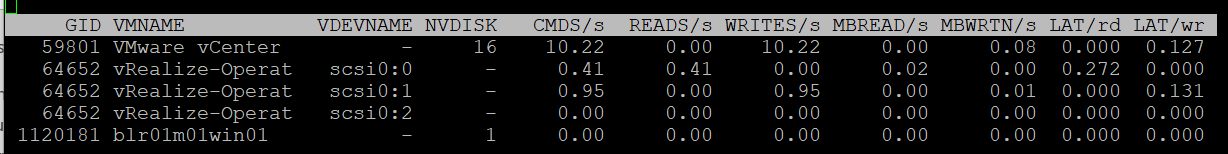
Contention
| | |
|--------|----------------------------------------------|
| LAT/rd | Average latency (in milliseconds) per read. |
| LAT/wr | Average latency (in milliseconds) per write. |
Consumption
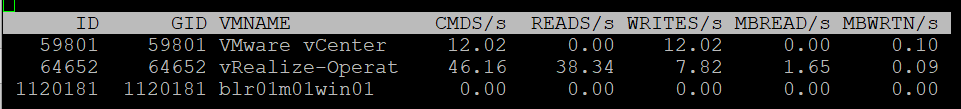
| CMDS/s | Count of disk IO commands issued per second. This is basically IOPS. Both the Read IOPS and Write IOPS are provided. |
| READS/s | |
| WRITES/s | |
| MBREAD/s | Total disk amount transferred per second in MB. This is basically throughput. Both the read throughput and write throughput are provided. |
| MBWRTN/s |
Unmap
It has unmap statistics. This can be useful that there is no such information at vSphere Client. In the UI, you can only see at ESXi level.

| SC_UMP/s | Successful, Failed and Total Unmaps per second. Unmap can fail for a variety of reason. One example that was addressed in vSphere 6.7 Patch ESXi670-202008001 and documented in in KB is Guest OS does not refresh unmap granularities and keep sending unmap based on older value. Eventually limit is reached and the operation fail. |
| FL_UMP/s | |
| UMP/s | |
| SC_UMP_MBS/s | As above, but in MB/second. |
| FL_UMP_MBS/s |
IO Filter
I/O Filter in ESXi enable the kernel to manipulate the IO sent by Guest OS before processing it. This obviously opens up many use cases, such as replication, caching, Quality of Service, encryption.
There is no such metric at vSphere Client. You will not find IO Filter metrics at both VM object and ESXi object.
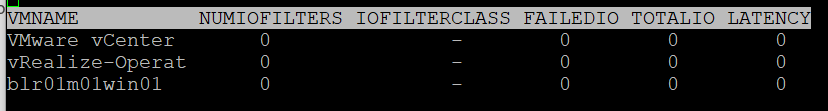
| NUMIOFILTERS | Number of IO Filters |
| IOFILTERCLASS | Type of IO Filter Class |
| FAILEDIO | I think Failed IO should be 0 at all times. |
| TOTALIO | |
| LATENCY | I’m unsure if this latency measures the additional overhead introduced by IO Filter, or the total latency as seen by the VM. |
Configuration
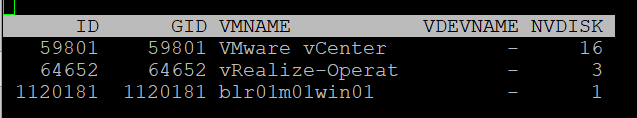
| | |
|-----------|-----------------------------------------------|
| ID | Resource pool ID or VSCSI ID of VSCSI device. |
| GID | Resource pool ID. |
| VMNAME | Name of the resource pool. |
| VSCSINAME | Name of the VSCSI device. |
| NDK | Number of VSCSI devices |
Disk Adapter
ESXi uses adapter to connect to device, so let’s begin with adapter, then device.
The panel has a lot of metrics and properties, so let’s group them for ease of understanding.
Errors
Since you check availability before performance, let’s check the errors first. This type of problem is best monitored as accumulation within the reporting period as any value other than 0 should be investigated.
BTW, none of these metrics are available at vSphere Client UI.
| FCMDS/s | Number of failed commands issued per second. How does this differ to Reset and Aborted? Number of failed read commands issued per second. Number of failed write commands issued per second. |
| FREAD/s | |
| FWRITE/s | |
| FMBRD/s | Megabytes of failed read operations per second. Megabytes of failed write operations per second. |
| FMBWR/s | |
| CONS/s | Number of SCSI reservation conflicts per second. This number should stay 0? Number of failed SCSI reservations per second, if the conflict can’t be solved timely. Number of SCSI reservations per second. This number should stay within the limit, but how to know what the limit is? |
| FRESV/s | |
| RESV/s | |
| ABRTS/s | Number of commands cancelled per second. |
| RESETS/s | Count of disk commands reset per second. |
Queue
For storage, the queue gives insight into performance problem. It’s an important counter so I was hoping there will be more, such as the actual queue.
| AQLEN | Current queue depth of the storage adapter. This is the maximum number of kernel active commands that the adapter driver is configured to support. This counter is not available in vSphere Client UI |
Contention
You expect to get 4 sets (Device, Kernel, Guest, Queue). For each set, you expect read, write, and total. 12 metrics, and that’s exactly what you got below.
| DAVG/cmd | Average latency per command in milliseconds. It’s an average number, not the last number in the reporting period. If you have 1000 IOPS, that means 5K IOPS over the 5 second reporting period. It’s a weighted average between read and write. If the IO commands are mostly read, then high latency from write could be masked out. |
| KAVG/cmd | |
| GAVG/cmd | |
| QAVG/cmd | |
| DAVG/rd | Average read latency per read operation in milliseconds. The same set of metrics as above, except it only counts the reads. It’s useful to see read and write separately as the numbers tend to be different. More importantly, the remediation action is different. |
| KAVG/rd | |
| GAVG/rd | |
| QAVG/rd | |
| DAVG/wr | The same set of metrics as above, except it only counts the writes. |
| KAVG/wr | |
| AVG/wr | |
| QAVG/wr |
Consumption
Now that we get the more important metrics (errors, queue, and contention) done, you then check utilization counter. In this way you have better context.
| ACTV | The definition is “Number of commands that are currently active”. I don’t know how it differs to IOPS as I’m unsure what the word “active” exactly mean here. |
| CMDS/s | I combine these 3 metrics as they are basically IOPS. Total IOPS, read IOPS and write IOPS. |
| READS/s | |
| WRITES/s | |
| MBREAD/s | I combine them as they measure throughput. Interestingly, there is no total throughput metric, but you can simply sum them up. Read the string MBWRTN as MB Written. |
| MBWRTN/s |
PAE and Split
| PAECMD/s | PAE Command per second and PAE Copy per second. PAE (Physical Address Extension) no longer applicable in 64-bit and modern drivers/firmware/OS, as the size is big enough. Copy operations here refer to the kernel copies the data from high region (beyond what the adapter can reach) to low region. This statistic applies to only paths. |
| PAECP/s | |
| SPLTCMD/s | Split Commands per second. Disk IO commands with large block size have to be split by the kernel. This can impact the performance as experiences by the Guest OS. |
| SPLTCP/s | Number of split copies per second. A higher number means lower performance |
Configuration
The panel provides basic configuration. I use vSphere Client as it provides a lot more information, and I can take action on them. The following is just some of the settings available.
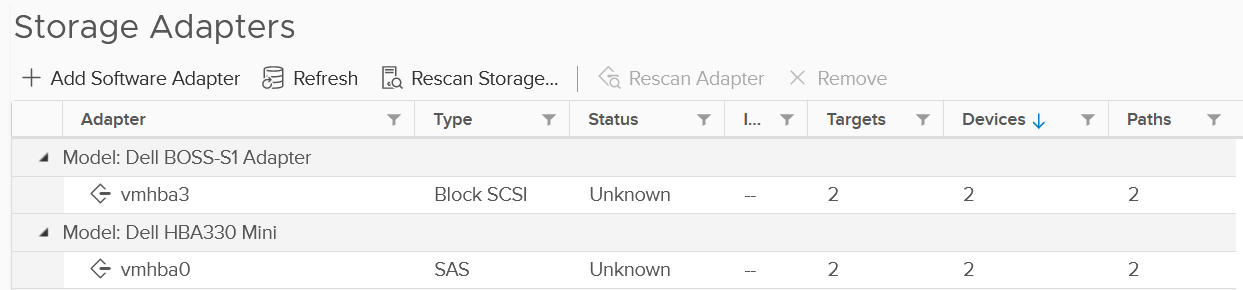
Compare the above with what esxtop provides, which is the following:
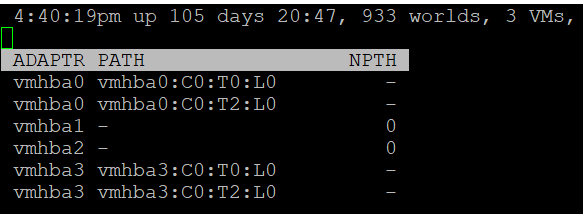
| | |
|----|----|
| NPTH | Number of path. This should match your design. An adapter typically has more than 1 path, which is why I said it would be awesome to have a panel for path |
Disk Device
The device panel has a lot of metrics and properties, so let’s group them for ease of understanding.
Errors
I’m always interested in errors first, before I check for contention and utilization.
| | |
|----|----|
| ABRTS/s | Number of commands cancelled per second. Expect this to be 0 at all times. |
| RESETS/s | Number of commands reset per second. Expect this to be 0 at all times. |
Queue
You’ve seen that there is only 1 counter for queue in Disk Adapter. How many do you expect for Disk Device?
Interestingly, there are 6 metrics for queue, as shown below.
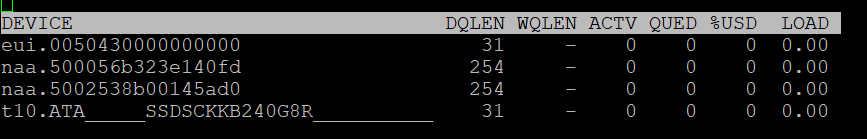
| LOAD | The formula is (active commands + ESXi kernel queued commands) / queue depth. If LOAD > 1, check the value of the QUED counter. |
| QUED | Number of commands in the kernel that are currently queued. You want this to be as low as possible, well below the queue depth. |
| %USD | USD (%) = ACTV / QLEN For world stats, QLEN is WQLEN. For LUN (aka device) stats, QLEN is DQLEN. Percentage of the queue depth used by ESXi kernel active commands. So this does not include the queued command? Does it mean that if this number is not 100%, then there is nothing in the queue, as queue should only develop when it’s 100% used? Obviously when Used = 100% it means the queue is full. That will introduce outstanding IO, which in turn will increase latency |
| DQLEN | I combine this together as a device can have 1 or more world, and there is a per-device maximum. DQLEN is the device configured queue length. The corresponding counter for adapter is called AQLEN WQLEN is the world queue depth. The manual states “This is the maximum number of ESXi kernel active commands that the world is allowed to have”. So it does not look like the queue at present. So we show maximum value for each world, and the present value for each device. |
| WQLEN | |
| ACTV | The definition is “Number of commands that are currently active”. I think this means the IO in flight. This is worth profiling and I expect it to be small most of the time. |
Contention
See Disk Adapter as both sport the same 12 metrics.
Consumption
See Disk Adapter as both sport the same 5 metrics.
PAE and Split
See Disk Adapter as both sport the same 4 metrics.
Configuration
As you can expect, esxtop provides minimal configuration information. They are shown below.
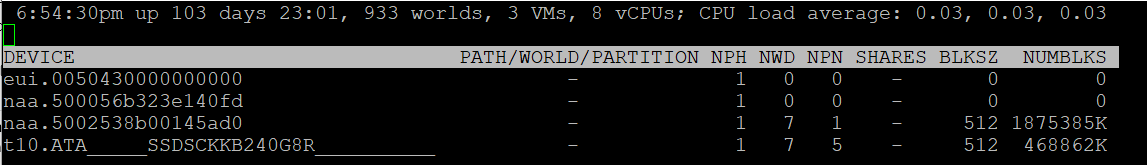
Path/World/Partition
They are grouped as 1 column, and you can only see one at a time.
By default, none of them is shown. To bring up one of them, type the corresponding code. In the following screenshot, I’ve type the letter e, which them prompted me to enter one of the device.
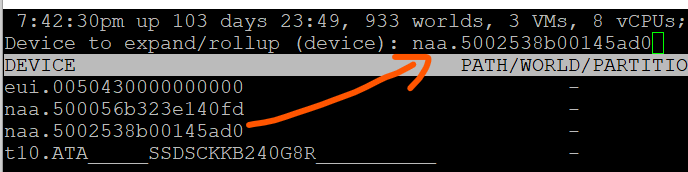
Path is obviously the path name, such as vmhba0:C0:T0:L0.
A disk device can have >1 world, which I’m unsure why. You can see each world ID, and you get the statistics per world.
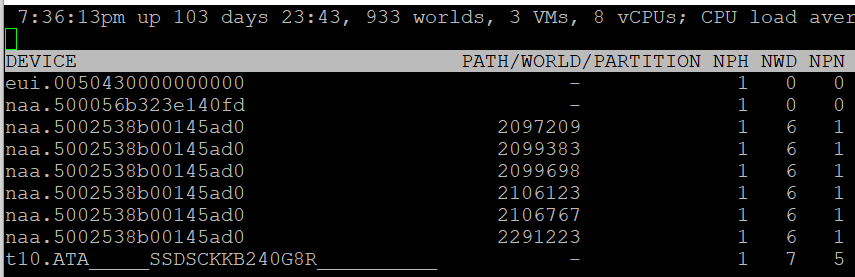
Partition shows the partition ID. Typically this is a simple number, such as 1 for the first partition. vSphere Client provides the following, which is more details yet easier.
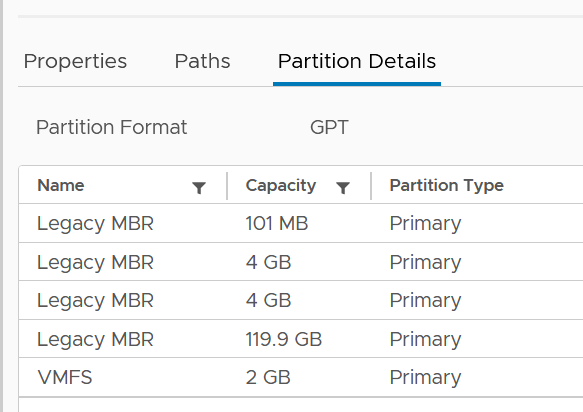
Others
Let’s cover the rest of the metrics.
| NPH | Number of paths. This should not be 1 as that means a single point of failure. |
| NWD | Number of worlds. If you know the significance of this in troubleshooting, let me know. |
| NPN | Number of partitions. Expect this to be 1 for VMFS |
| SHARES | Number of shares. This statistic is applicable only to worlds. This is interesting, as that means each world can have their own share? Where do we set them then? |
| BLKSZ | Block size in bytes. I prefer to call this sector format. International Disk Drive Equipment and Materials Association (IDEMA) increased the sector size from 512 bytes to 4096 bytes (4 KB). This is important, and you want them to be in 4K (Advanced Format) or at least 512e (e stands for emulation). Microsoft provides additional information here. |
| NUMBLKS | Number of blocks of the device. Multiply this with the block size and you get the total capacity. In vSphere UI, you get the capacity, which I think it’s more relevant. |
For configuration, I use vSphere Client as it provides a lot more information, and I can take action on them. The following is just some of the settings available.
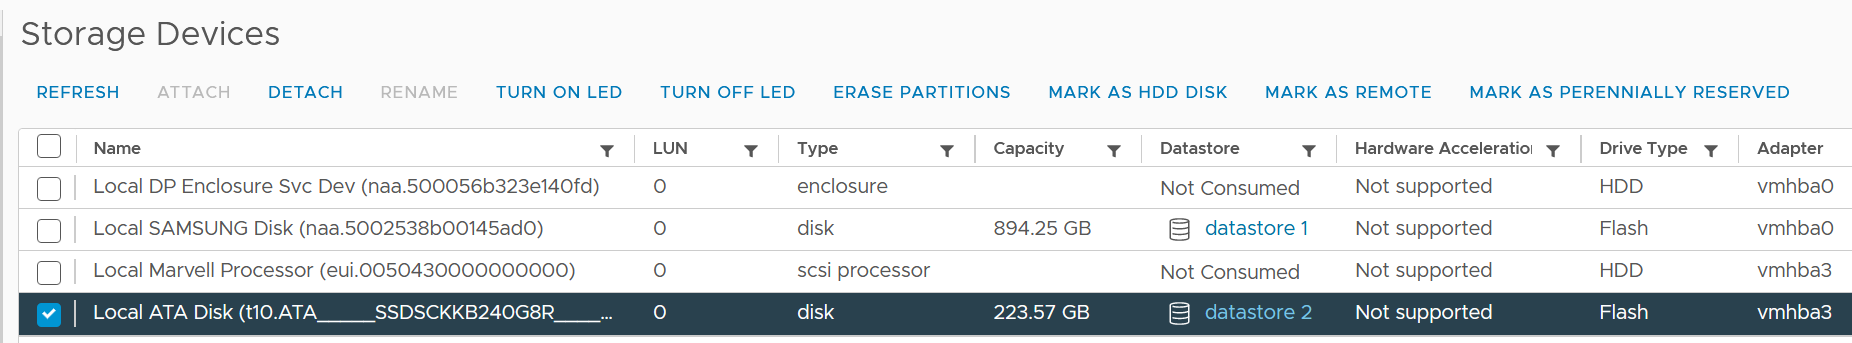
VAAI
VMware vSphere Storage APIs - Array Integration (VAAI) offloads storage processing to the array, hence improving performance or reducing overhead. This is obviously vendor-dependant. There is no VAAI counter at adapter level or path level, as the implementation is at back-end array.
The VAAI has a lot of metrics. There are essentially 2 types of metrics: non latency and latency metrics.
As with metrics, check for contention type of metrics first. There are metrics that track failed operations, such as CLONE_F, ATSF and ZERO_F.
In this book, I’m grouping them by function as it’s easier to understand.
I saw this note from VMware vSphere Storage APIs – Array Integration (VAAI) document by Cormac Hogan, which I think it’s worth mentioning. Because the nature of VAAI as an offloads, you will see higher latency value of KAVG metric. Other latency metrics are not affected, so there is no issue unless there are other symptoms present.
At this moment, I have not found the need to document them further. So what you get here is mostly from the KB article above. Andreas Lesslhumer also has useful information in this blog article. Other references are this blog by Cormac and this this KB article.
Extended Copy
Hardware Accelerated Move (the SCSI opcode for XCOPY is 0x83)
| Clone_RD | RD stands for reader. The number of CLONE commands successfully completed where this device was a source. WR stands for writer. The number of CLONE commands successfully completed where this device was a destination The number of failed CLONE commands |
| Clone_WR | |
| Clone_F | |
| LCLONE_RD | The same set of 3 metrics, except for Linked Clone. |
| LCLONE_WR | |
| LCLONE_F | |
| MBC_RD/s | MBC = megabytes of clone data. RD/s is read per second, and WR/s is written per second |
| MBC_WR/s | |
| AVAG/suc | The average clone latency per successful command The average clone latency per failed command |
| AVAG/f |
Atomic Test & Set
Hardware Accelerated Locking on Single Extent Datastore or on Multi Extent Datastore (SCSI code 0x89).
| | |
|----|----|
| ATS | The number of Atomic Test & Set (ATS) commands successfully completed |
| ATSF | The number of ATS commands failed. Expect this to be 0? |
| AAVG/suc | The Average ATS latency per successful command |
| AAVG/f | The Average ATS latency per failed command |
Write Same
Hardware Accelerated disk space initialization by writing 0s on all the blocks for faster future operations. The SCSI code for WRITE SAME operations is 0x93 or 0x41.
| | |
|----------|----------------------------------------------------|
| ZERO | The number of ZERO commands successfully completed |
| ZERO_F | The number of ZERO commands failed |
| MBZERO/s | The megabytes zeroed per second |
| ZAVG/suc | The average zero latency per successful command |
| ZAVG/f | The average zero latency per failed command |
Unmapped
Unmapped block deletion (SCSI code 0x42). We discussed unmapped block (TRIM) in earlier chapter.
| | |
|----|----|
| DELETE | The number of successful DELETE commands |
| DELETE_F | The number of failed UNMAP commands, this value should be 0 |
| MBDEL/s (MB/s) | The rate at which the DELETE command getting processed. Measured in Megabytes per second |
Others
| RESSPACE | Reservation Space. The number of commands which were successful while doing space reservation for a VMDK file in thick Provisioning format. RESSPACE_F captures the failure. |
| RESSPACE_F | |
| EXTSTATS | Extended Statistics The number of commands which were successful in reporting extended statistics of a clone after the cloning process had been completed. EXTSTATS_F captures the failure |
| EXTSTATS_F | |
| CAVG/suc | The average clone latency per successful command. Unit is millisecond per clone. CAVG/f captures the failures. |
| CAVG/f | |
| LCAVG/suc | As per above, but for Linked Clone. |
| LCAVG/f | |
| RAVG/suc | The average latency (in ms) per successful VAAI Space Reservation command. RAVG/f captures the failures |
| RAVG/f | |
| ESAVG/suc | As per above, but for Extended Statistics |
| ESAVG/f |
vSAN
I group the vSAN panel under Disk as esxtop only covers storage related information. There is no network or compute (vSAN kernel modules).
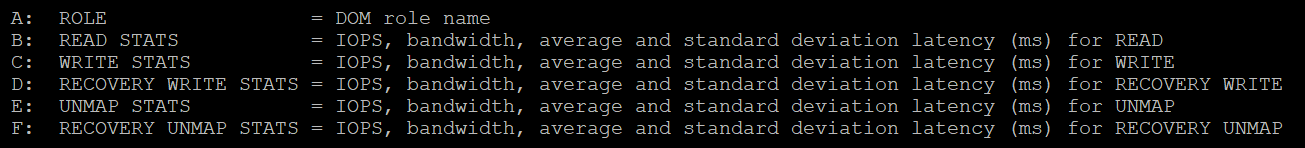
The panel provides visibility into 5 types of IO operations:
-
Read
-
Write
-
Recovery Write
-
Unmap
-
Recovery Unmap
For each, it provides the IOPS, bandwidth, average latency (ms) and standard deviation latency (ms). Take note that some use MB, while others use GB.
| ROLE | The Distributed Object Manager (DOM) role of that component, such as client, owner, and component manager. |
READS/s MBREAD/s AVGLAT SDLAT | Reads/second is the number of reads operations. This is IOPS. MBReads/s is read throughput in Megabytes/second. AvgLat is the average latency. Standard deviation of latency, when above 10ms latency. |
WRITES/s MBWRITE/s AVGLAT SDLAT | Same set of metrics, like above, but for write |
RECOWR/s MBRECOWR/s AVGLAT SDLAT | Same set of metrics, like above, but for Recovery Write. Recovery covers component rebuild task (e.g. from disk failure). Read the string MBRECOWR as MB Reco Wr. |
UNMAPS/s GBUNMAP/s AVGLAT SDLAT | Same set of metrics, like above, but for unmap operations. I think this number should be within your expectation, as excessive unmap can impact performance. GBUNMAP/s = Unmapped rates in Gigabytes/second Read the string GBUNMAP as GB Unmap |
RECOUN/s GBRECOUN/s AVGLAT SDLAT | Same set of metrics, but for Recovery Unmap operations. Read the string GBRECOUN as GB Reco Un. RecoUn/s is the number of recovery unmapped operations per second. GBRecoUn/s is the amount of disk space in GB/second by Recovery Unmapped. |
Network
Take note that the network panels mix the virtual and physical networks.
Focus on the virtual network first as that’s closer to the VM and kernel.
Contention
As usual, we check contention first. There are no network latency and packet retransmit metrics.
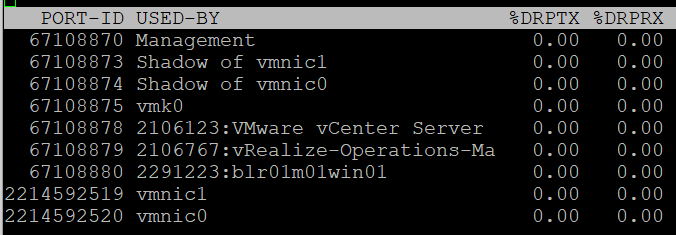
| %DRPTX | Percentage of Dropped Packet. Expressed in percentage, which makes it easier as you expect this not to exceed 0.x%. In dedicated network such as vSAN and vMotion, this should be flat 0% non-stop for every single ESXi. Transmit and Receive have different nature. A high drop in transmit means your physical NIC card or uplink switch is unable to cope. A high drop in receive means your ESXi or VM may not have enough CPU to process the packet, or the ring buffer size is too small. esxtop show dropped packets: The screen output show dropped receive packets at the virtual switch port. They are actually dropped between the virtual switch and the guest OS driver. The dropped packets can be reduced by increasing the Rx buffers for the virtual network driver. |
| %DRPRX |
Consumption
As usual, check the non-unicast packets first and make sure they match the expectation at that time.
Non-Unicast Packets
| PKTTXMUL/s | Number of multicast packets transmitted or received per second. Read the string PKTTXMUL as Pkt Tx Mul, which is Packet TX Multicast. Same with PKTRXMUL. |
| PKTRXMUL/s | |
| PKTTXBRD/s | Number of broadcast packets transmitted or received per second. Read the string PKTTXBRD as Pkt Tx Brd, which is Packet TX Broadcast. Same with PKTRXBRD |
| PKTRXBRD/s |
All Packets
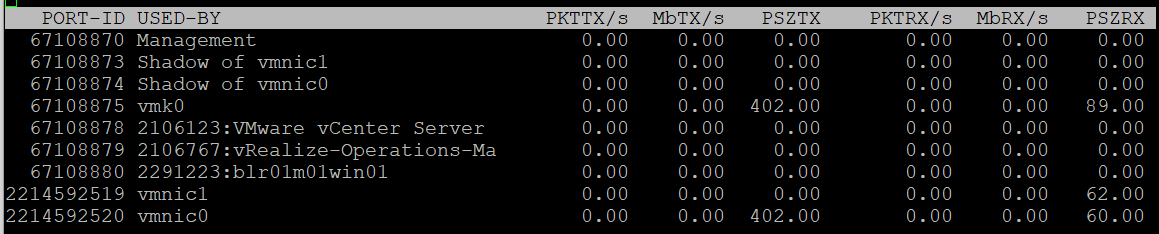
| PKTTX/s | This is the total packets, so it includes multicast packet and broadcast packet. Multicast packet and broadcast packet are listed separately. This is handy as they are supposed to low most of the time. |
| PKTRX/s | |
| MbTX/s | This is measured in bit, unlike vCenter Client UI which shows in byte. Packet length is typically measured in bytes. A standard packet is 1500 bytes, so a 10 Gb NIC would theoretically max out at 833,333 packets on each direction. Compare this with your ESXi physical network card. |
| MbRX/s | |
| PSZTX | This is convenient. If you see a number far lower than 1500, it’s worth discussing with network team. |
| PSZRX |
There is another metric ACTN/s, which is the number of actions per second. The actions here are the kernel actions. It is an internal counter, not relevant to day to day operations.
Configuration
This panel mixes physical and virtual. For virtual, it shows both the kernel network and VM network. I find it easier to use the information in vSphere Client.
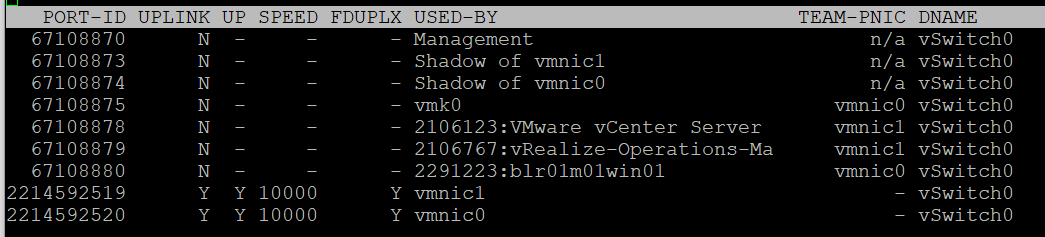
| | |
|----|----|
| PORT-ID | Virtual network device port ID. |
| UPLINK | ‘Y’ means that the corresponding port is an uplink. ‘N’ means it is not. The physical NIC cards (vmnic0, vmnic1, etc.) serve as the uplink |
| UP | ‘Y’ means that the corresponding link is up. ‘N’ means it is not. |
| SPEED | Link speed in Megabits per second. |
| FDUPLX | ‘Y’ means the corresponding link is operating at full duplex. ‘N’ means it is not, which is a problem. |
| USED-BY | Virtual network device port user. |
| DNAME | Virtual network device name. |
The metric DTYP (Virtual network device type, where H means Hub and S means switch) does not seem to be available anymore.
vSphere Client separates the components. You can see the virtual switches, the kernel network and physical cards. The level of details is more comprehensive.
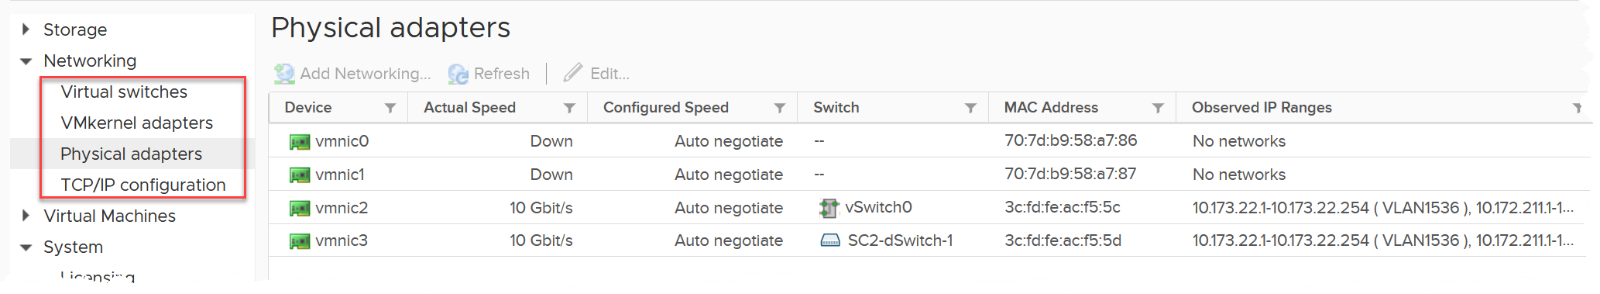
RDMA Device
Remote Direct Memory Access (RDMA) enable direct access to the physical network card, bypassing the OS overhead. The following screenshot, taken from here, shows 2 types of access from application (that lives inside a VM. The VMs are not shown).
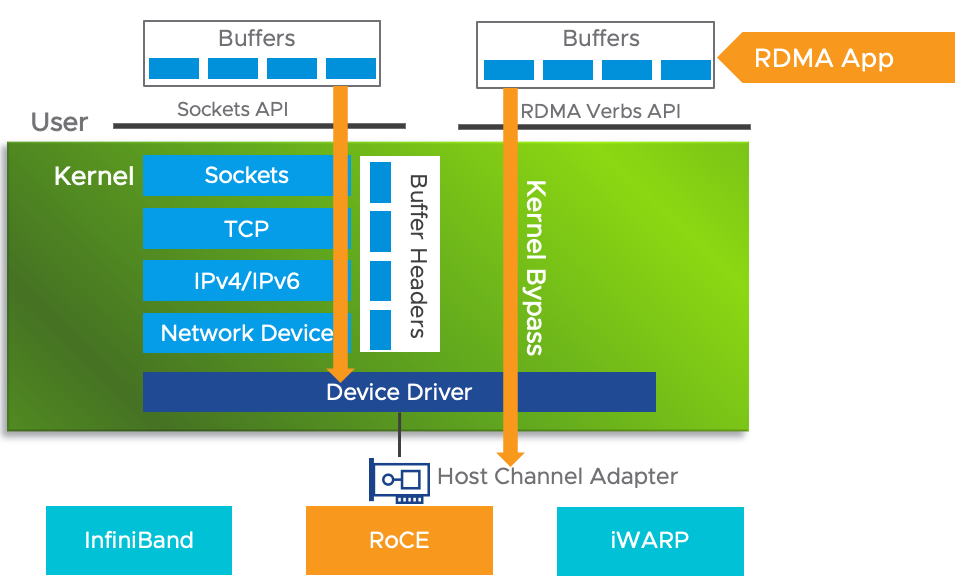
Usage
Since it’s about network, you get both the TX (transmit or sent) and RX (received or incoming).
For contention, there is only packet dropped. There is no packet retransmit or latency. The metrics are:
| %PKTDTX | Percentage of packet dropped relative to number of packets sent. |
| %PKTDRX |
For utilization, you get them in both amount of data, and number of packets. Both are important metrics. There is no breakdown on the type of packets (broadcast, multicast, unicast).
| PKTTX/s | Packets per second. Check the limit for packet per second in your specific card. |
| PKTRX/s | |
| MbTX/s | Network throughput in Megabit/second. |
| MbRX/s |
There is no packet size. This can be handy to determine if they are much smaller or larger than you expect. For example, if you expect jumbo frame but the reality is much smaller.
These metrics are not available in vSphere Client UI, so you need to use esxtop to get the visibility. Just in case you’re wondering where I got the following screenshot from, they are courtesy of Shoby Cherian and Aditya Kiran Pentyala.
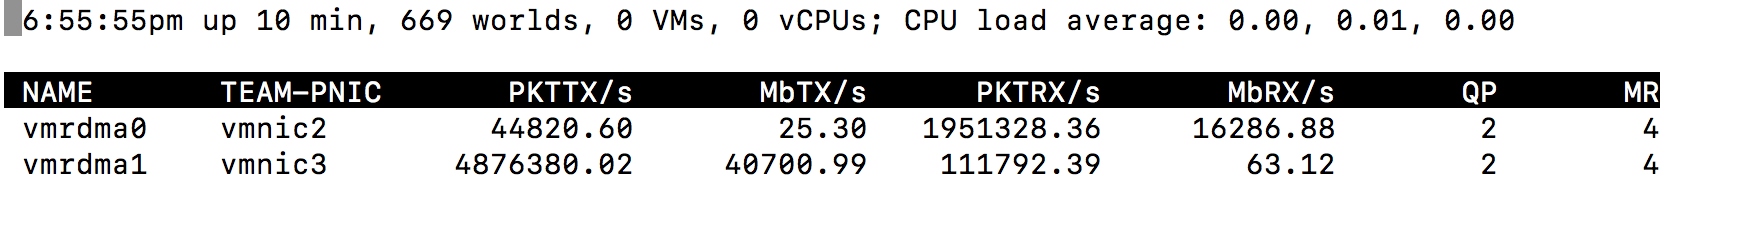
You also get the queue usage information.
| QP | Number of Queue Pairs Allocated and Completion Queue Pairs Allocated. RDMA uses these queues for communication. |
| CQ | |
| SRQ | Number of Shared Receive Queues Allocated I think this is required in virtualization as the physical NIC card can be shared. |
| MR | Memory Regions Allocated. Check that this is inline with your expectation. |
For more reading on RDMA, I found this academic paper, title “Understanding the concepts and mechanisms of RDMA” useful.
Configuration
vSphere Client provides the following information. You get the first 4 columns in esxtop.
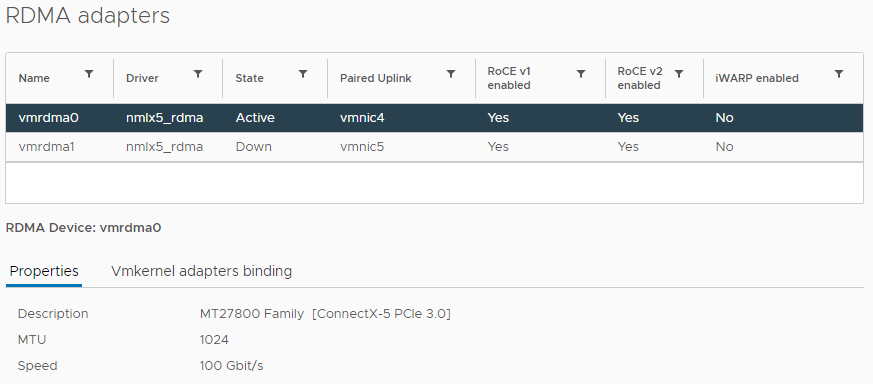
The information you get in esxtop covers the first 4 columns in the preceding screenshot. They are:
| | |
|----|----|
| NAME | Name of the device |
| DRIVER | Name of the driver |
| STATE | Active or down |
| TEAM-PNIC | The physical Network Interface Card that the RDMA adapter is paired with. |
Chapter 8