CPU
Architecture
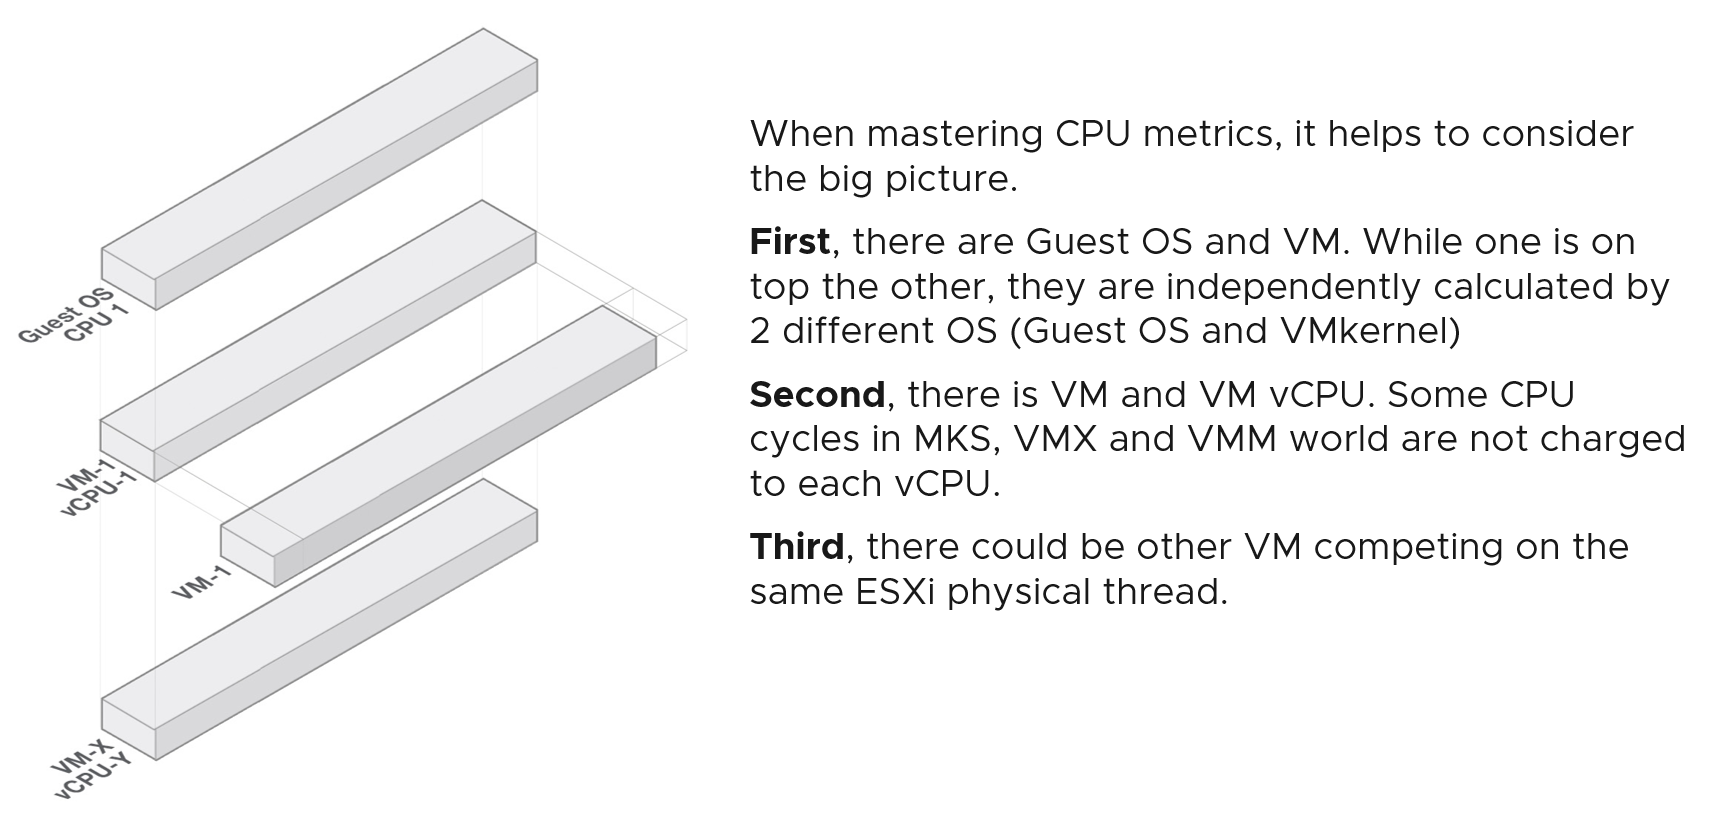
What used to be Windows or Linux running on a server has transformed into Guest OS 🡪 VM 🡪 ESXi. There 3 distinct layers resulted in complexity documented in Part 2 Chapter 1. This is not as complex as memory, where you have 4 layers as process running inside a Guest OS represents another layer.
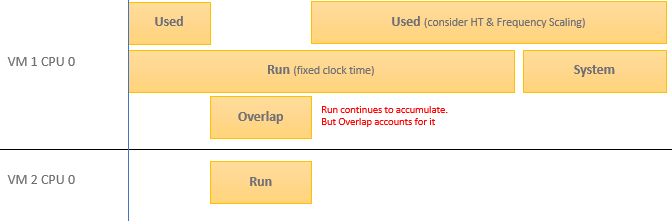
The following infographic shows how the nature of CPU metrics changes as a result of virtualization.
 [^2]
[^2]
Specifically for CPU, we need to be aware of dynamic metric. This means their values fluctuates depending on CPU clock speed and HT effect. As a result, the values are harder to figure out due to lack of observability on the fluctuation. This is not an issue if the range is negligible. It is not. For example, HT can increase the value of CPU Latency anywhere from 0% to 37.5%.
Guest OS vs VM
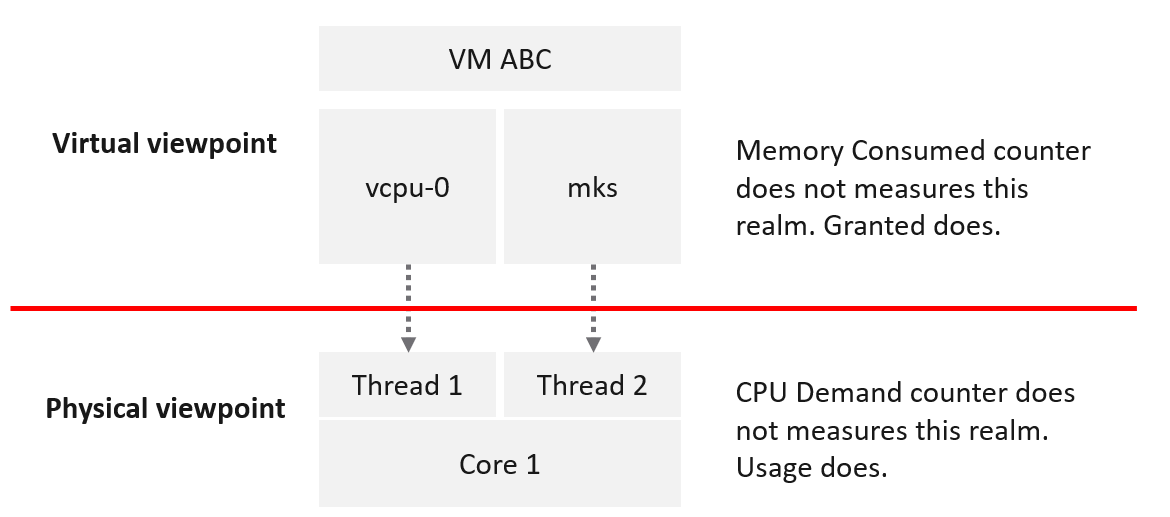
CPU metrics for a VM differ greatly from those in the Guest OS. For example, vCenter provides 5 metrics to account for the utilization of VM CPU, yet none directly maps to Windows/Linux CPU utilization.
The following diagram shows some of the differences.
When the kernel de-schedules a VM to process something else (e.g. other VM, kernel interrupt) on the same physical thread or core, the Guest OS does not know why it is interrupted. In fact, it experiences frozen time for that particular vCPU running on the physical core. Time jumps when it’s scheduled again. See this paper for the explanation.
Microsoft Windows and Linux handle this freeze differently when running on vSphere.
-
For Windows, the frozen part is not accounted, resulting in higher value being reported. Let’s take an example
-
0 – 1 second: CPU runs 100%
-
1 – 2 second: CPU halted. Windows unaware.
-
If Windows reports every 2 seconds, then it reports 100% while vSphere reports 50%.
-
-
Linux accounts via the metric Steal Time. The value is accurate so long you use paravirtualized system clock.
On the other hand, ESXi cannot see how the Guest OS schedules its processes. ESXi can only see what’s being sent out by the Guest.
Because of this, it’s important to use the correct metrics at the correct layers.
Difference in the CPU Utilization metrics:
| Guest OS | Depending on the version of Guest OS, some may not be aware of CPU scaling. The real time frequency has to be obtained from the BIOS or VMM layer. I’m unsure how frequent this gets updated by ESXi to the VM, as it varies per core and over time. |
|---|---|
| It’s unaware of the hyper-threading, because the information is not being supplied by ESXi VMM module. | |
| VM | When the vCPU shares a physical core, the CPU Usage will drop by 37.5%. |
| Includes IO processing done on behalf of the hypervisor. In heavy databases or NSX Edge, this is significant. This increases VM CPU Usage. |
Both layers need to be monitored, as each measure different performance problems. Hence it’s imperative to install VMware Tools. It reports the statistics about Guest OS to the ESXi host every 20 seconds by default.
The following example summarizes that mapping between Guest and VM is not possible.
| Type | MS Windows Metric | VM Metric |
|---|---|---|
| Contention | Run Queue | None. All these are internal operations of Windows or Linux. |
| DPC Time | ||
| Context Switch | ||
C1 Time C2 Time C3 Time | None. ESXi does not break down per VM as it focuses on the physical core. | |
| None | CPU Ready CPU Co-Stop CPU System | |
| Utilization | Usage | Run – Overlap – VMX – System. In Linux, the usage counters shown by the commands top, htop, or vmstat measures the time spent. It does not include the speed during the run. |
I put Linux separately as Windows and Linux have different approaches. The metrics for Linux are:
| User | This means non kernel. Applications typically run here. |
|----|----|
| System | This is the kernel or privileged ring, where core operating systems function run. |
| Idle | Not running. This should correlate with the CPU run queue. |
| Wait | The time spent waiting for IO (disk or network) |
| Steal | I think this is only applicable in virtual machine, not physical. This is the time it’s frozen because underlying hypervisor does not have physical thread to run the VM vCPU. |
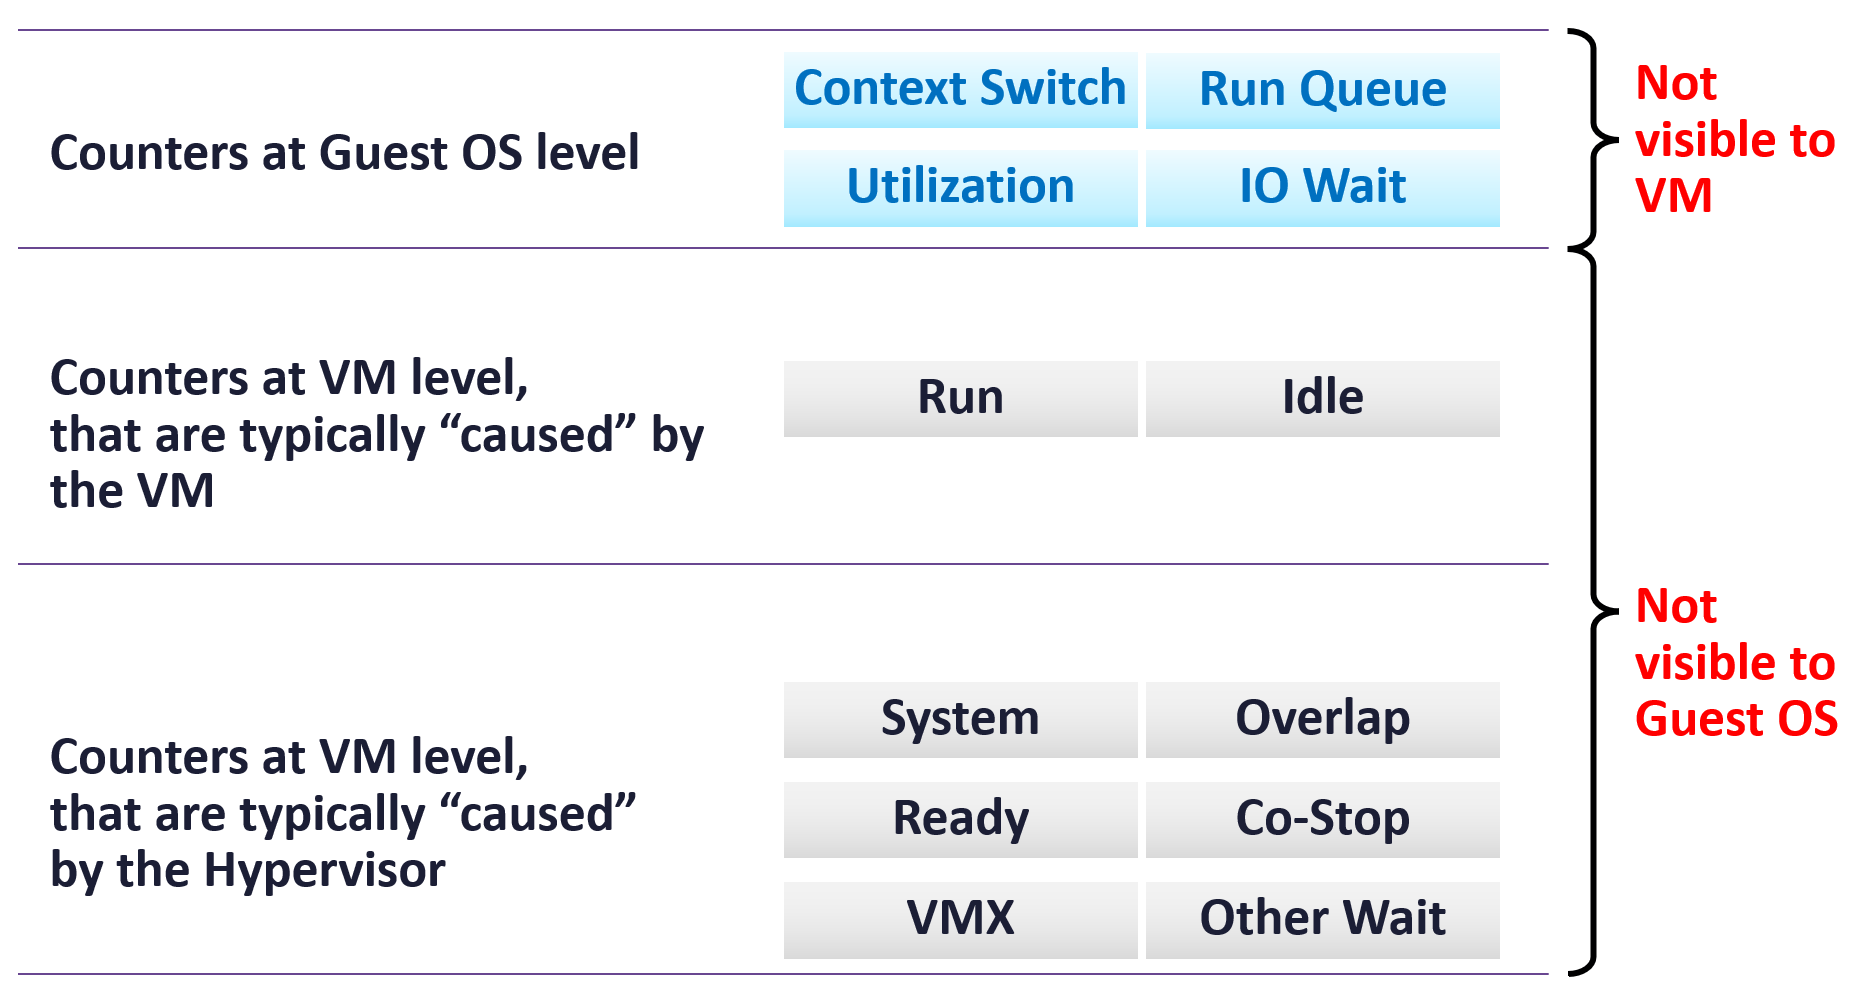
The following diagram shows the difference between Guest OS and VM.
We will explain the above diagram after we cover the counters.
ESXi ≠ VM + Kernel
Let’s use an example to drive the point.
Review the diagram. What do you notice?
Yes, the sum of VM CPU Usage is greater than the ESXi total capacity! How could it be?
The answer is different perspective.
Just like Guest OS and VM have different vantage points, the same complexity happens between VM and ESXi.
The complexity comes from the different vantage points. The metrics at ESXi and VM level measure different things. As a result, the counter at ESXi level cannot be the sum of its VMs + kernel.
VM takes the consumer view, meaning it sees the virtual layer. It sees 2 virtual CPUs, unaware of HT. A VM may compete with other VMs, but they are always unaware of one another.
ESXi takes the provider view, meaning it sees the physical layer. It sees 1 core with 2 threads, fully aware of HT. Concept such as Ready and Wait are not applicable as a core is either runs or idle. The kernel practically does not experience contention as it has the highest priority.
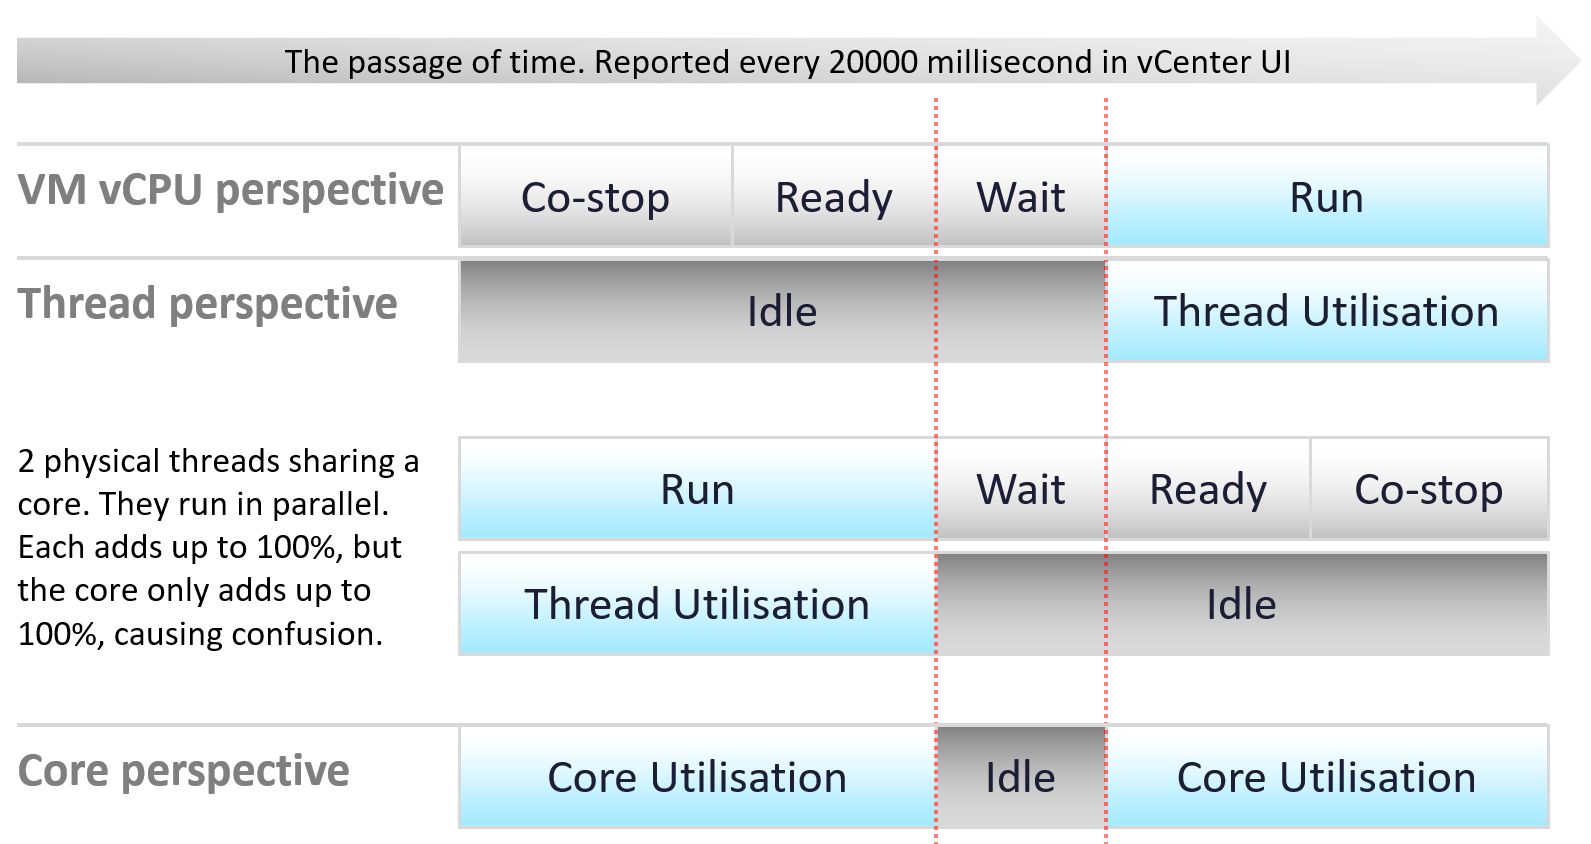
The preceeding diagram shows that there are actualy 3 levels of measurements:
| VM vCPU | Since a vCPU is a consumer, when it does not get what it wants, it needs to account for it. This is why you see counters such as ready and co stop. |
|---|---|
| ESXi Thread | Since a thread is consumer, it never experiences contention. It either runs or not. |
| Since each thread runs in parallel, each gets their own 100%. Now, do not total them and conclude the core can run at 200%. Yes, I know esxtop shows that. It is not wrong, but there is a simpler way. Simply look at it from core perspective. | |
| ESXi Core | The core is the one doing the actual work, not the thread. So the one that is running is actually the core. That’s why it’s correct that a core registers 100% and not 50% when it only runs one of its threads. |
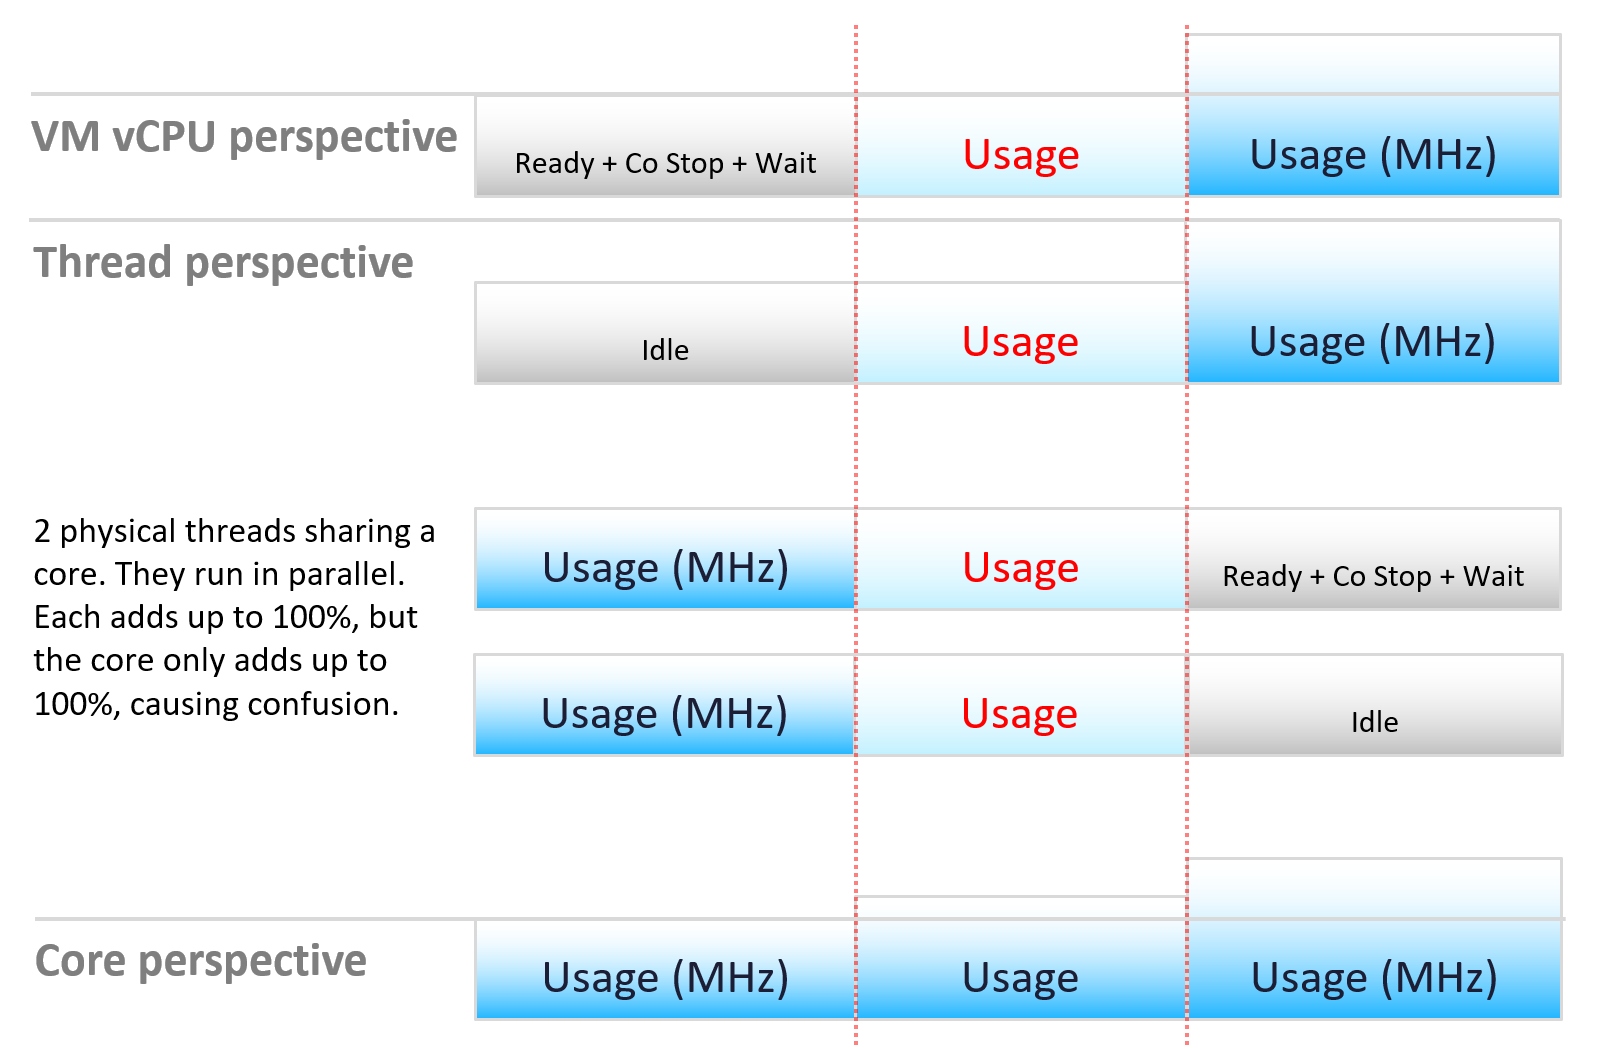
Now, there is a complication.
When a core is running, it can run at different frequency and efficiency.
This is where the Usage (MHz) counter comes in.
If the word Usage is confusing, think of the word throughput or cycles completed.
Let’s apply the above into the 2 pillars of operations management:
-
performance
-
capacity
Review the following infographic. Go through it vertically, then horizontally.
What’s your take on the metrics?
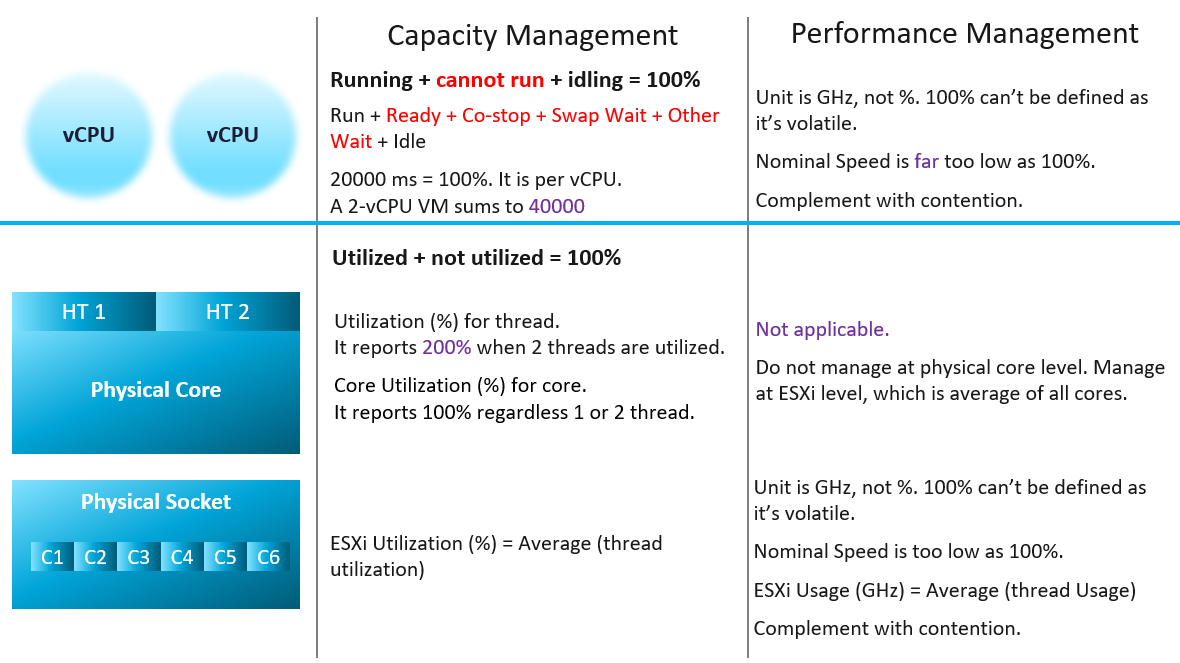
Capacity is always based on a static counter. That’s why it can use percentage as the unit.
-
For VM, it’s about consuming the given vCPU.
-
For ESXi, it’s about the utilization of the threads.
The CPU frequency is about performance, not capacity. That’s why metrics such as Usage and Demand are not used in capacity.
Performance is about speed, not space. That’s why CPU frequency, a key indicator of speed, has to be included.
-
The capability of today’s CPU means the CPU speed varies over time and varies among its cores. As such, there is no 100% as the upper limit cannot be determined. Even if it is possible, there is no API to access this information.
-
This means we can’t use percentage as unit.
-
Since the upper limit is not known, we need to complement with contention counters (e.g. ready and overlap) so we can proactively manage.
CPU vs vCPU
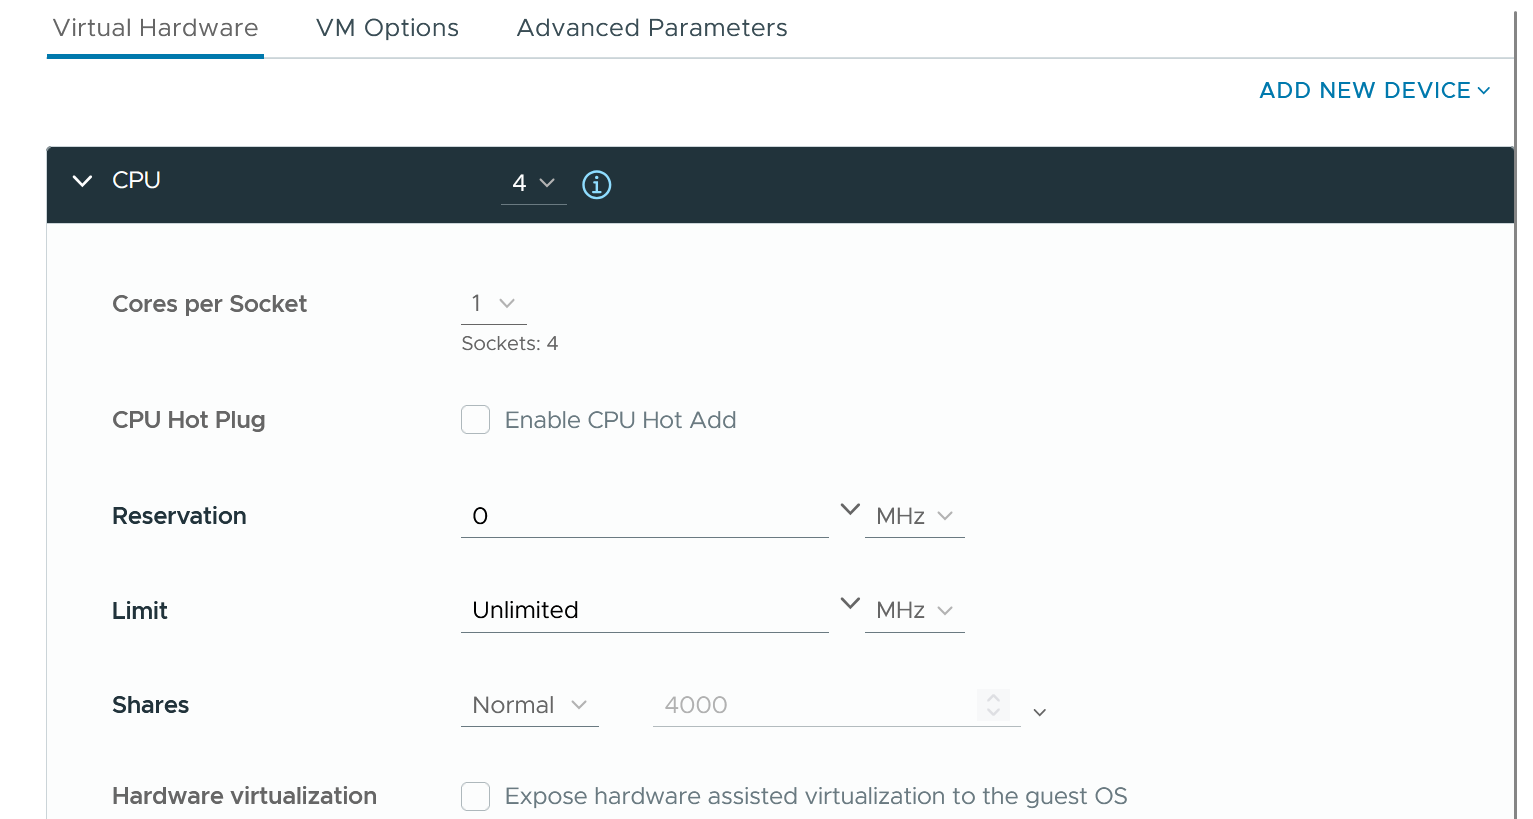
One major difference is there is no hyperthreading at vCPU level. vSphere only expose vSocket and vCore. Within a vCore, there is no hyperthreading.
System on a Chip
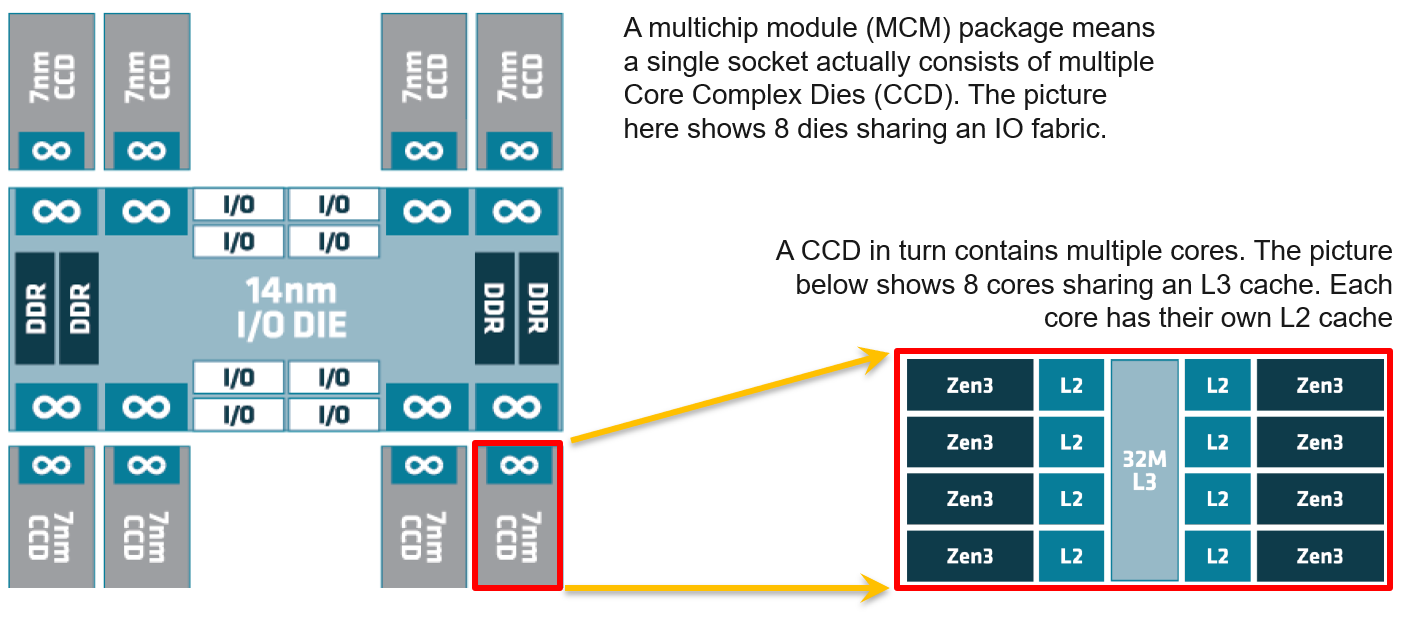
As CPU architecture moves towards System on a Chip design, it’s important not to assume that a CPU socket is a simple and linear collection of cores. Take a 64-core AMD EPYC for example. It’s actually made of 8 Core Complex Dies. Each CCD has their own L3 cache. Within a CCD, there are 8 Zen 3 cores, each having their own L2 cache.
The following diagram (taken from page 5 on the AMD link above) shows there its locality effect within a single socket. A thread is closer to another thread on the same CCD. You can see an example of the performance impact on this blog here by Todd Muirhead.
NUMA
NUMA Node = Socket / Package, as 1 socket can have >1 package (if you enable Cluster-on-Die feature of Intel Xeon).
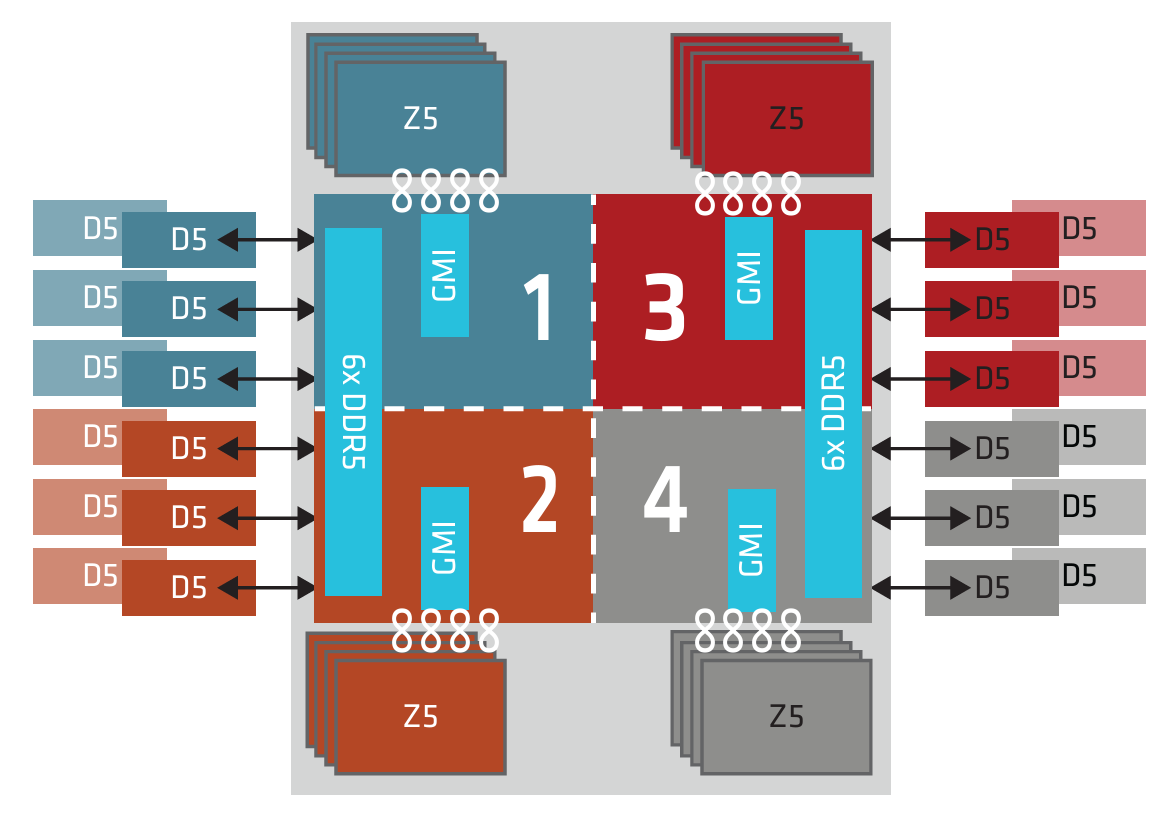
The whitepaper from AMD on EPYC 9005 Series processors shows that the socket is best divided into 4 NUMA domains. This setting is called NPS4. The following diagram shows NPS4, where each domain has 6 memory DIMMS and 3 memory controllers.
Review the NUMA effect in this KB.
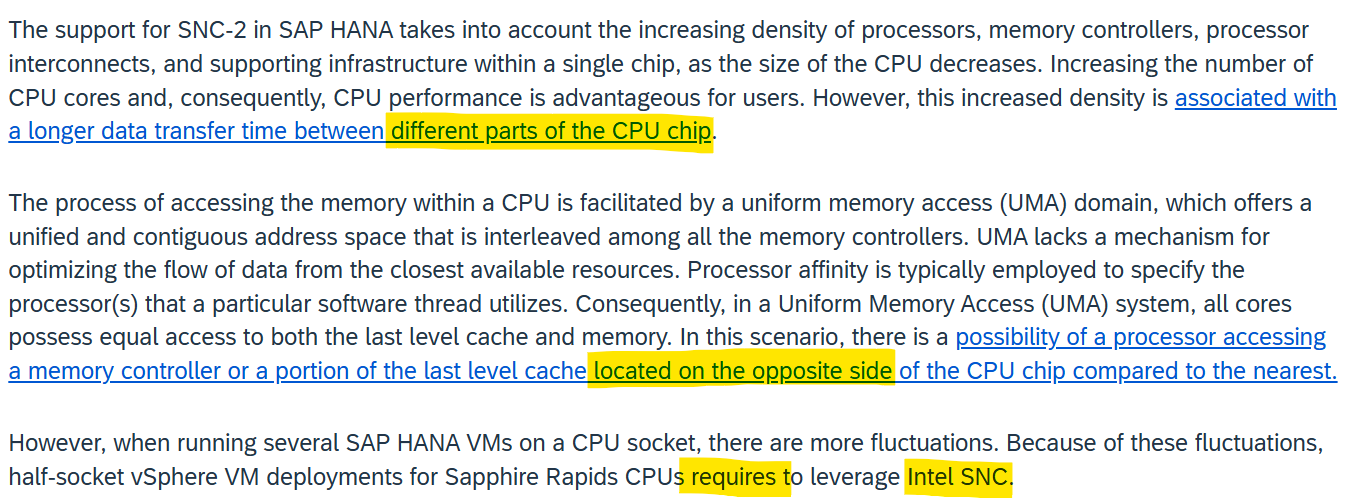
From workload perspective, the situation is similar in Intel CPU. The paper from SAP below shows that SAP recommends Intel Sub-NUMA Cluster (SNC) to be enabled:
In terms of latency, this site showed the test result of Xeon 6 cache. The latency went up from 33 ns for local L3 cache to 80 ms to an L3 that is further away.
State of a VM vCPU
ESXi Scheduler keeps in mind the following goals:
-
To balance load across physical cores.
-
To preserve cache state, minimize migration cost.
-
To avoid contention from hardware (hyperthreading, low level cache, etc.) and sibling vCPUs (from the same VM).
-
To keep VMs or threads that have frequent communications close to each other.
With the above understanding, now look at the life of a single vCPU of a VM.
At the most basic level, a VM CPU is either being utilized or not being utilized by the Guest OS. At any given moment, it either runs or it does not, there is no “walk” state.
| Being used | The hypervisor must schedule the vCPU. A multi vCPU VM has multiple schedules, 1 for each vCPU. For each vCPU:
|
|---|---|
| Not being used | There are 2 possible reasons why it’s used:
|
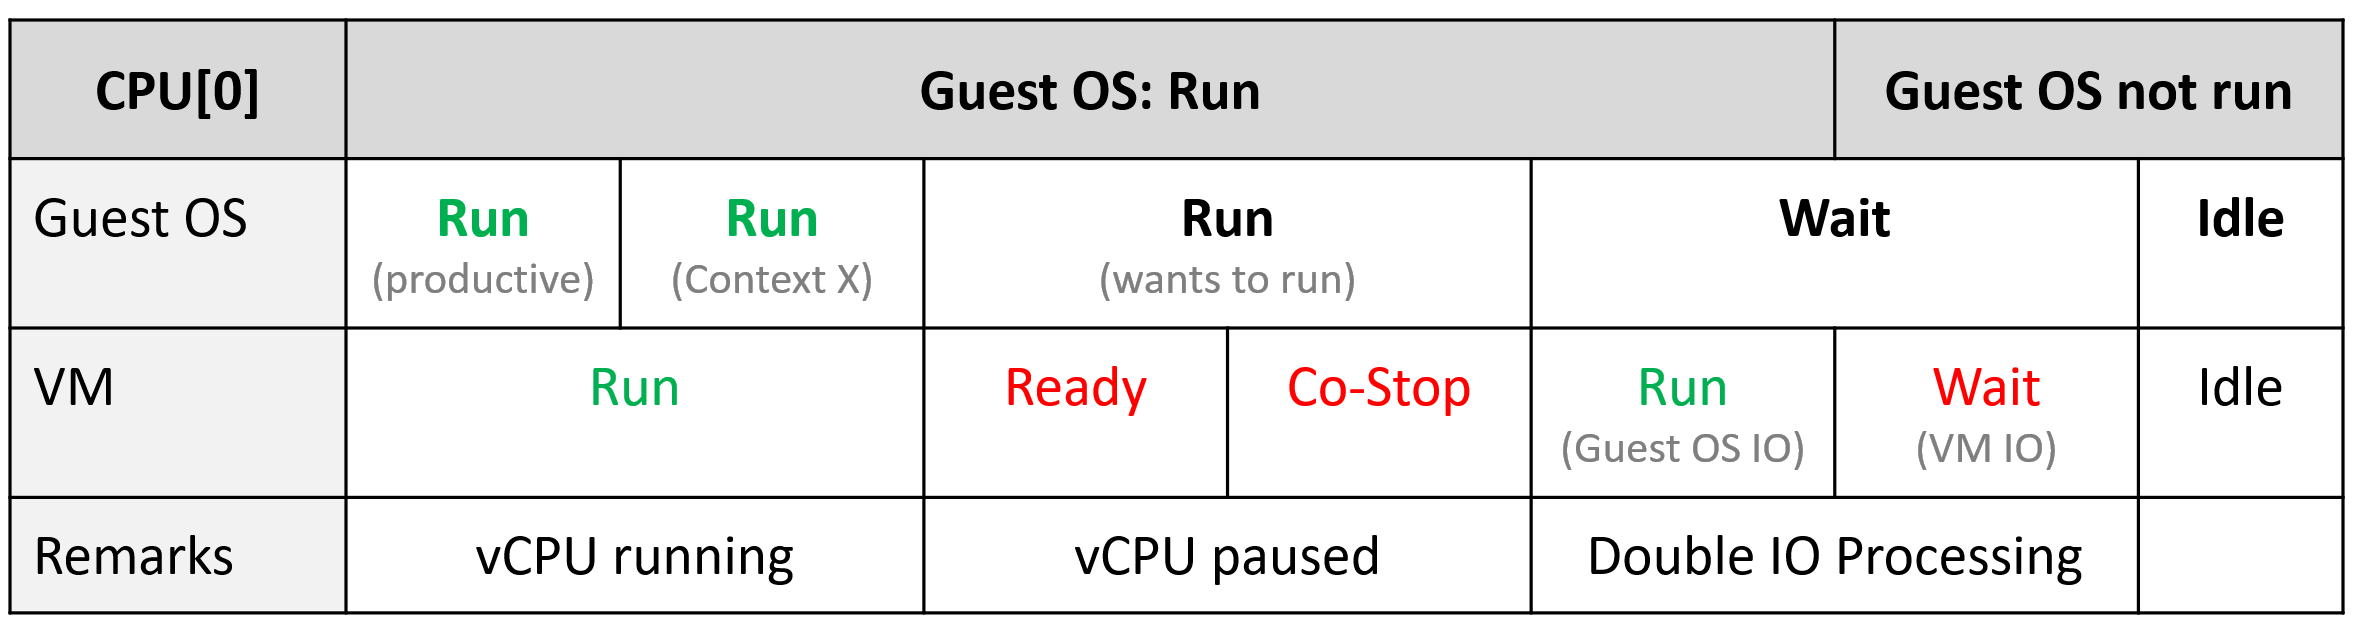
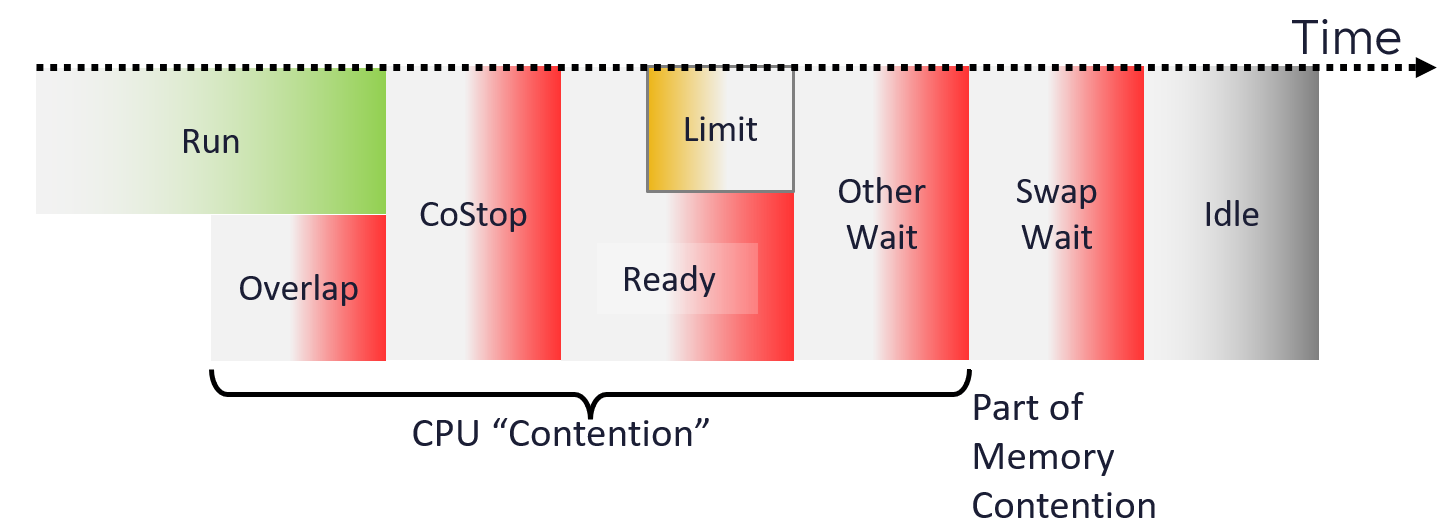
With the above understanding, we’re ready to examine the following state diagram[^3]. The diagram shows a single schedule (1 vCPU, not the whole VM). It’s showing the view from hypervisor (not from inside the Guest OS):
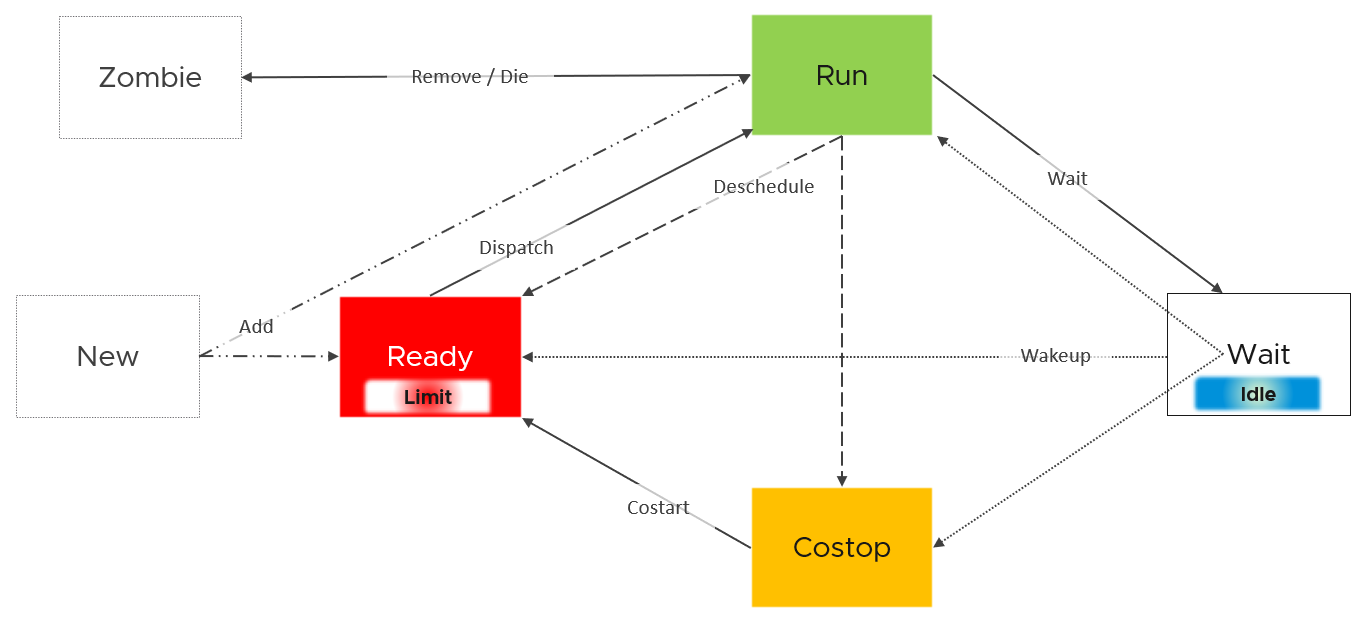
ESXi places each vCPU of the VM in one of the 4 above states. A vCPU cannot be in 2 states at the same time. This is fundamental in understanding the formula behind CPU metrics.
-
Run does not check how fast it runs (frequency) or how efficient it runs (hyperthreading). Run measures how long it runs, hence the counter is in milliseconds, not GHz.
-
Ready and Co-stop.\
They are mutually exclusive as they have opposite reason.\
Co-stop is “caused by” the VM, while Ready is caused by the ESXi. You can reduce Co-stop by reducing the VM size, especially relative to the NUMA boundary. You can’t do the same on Ready.
-
Wait handles both Idle and Wait. The reason is the hypervisor cannot tell whether the Guest OS is waiting for IO or idle. As far as the hypervisor concern, it’s not doing anything. This also measures the state where the wait is due to hypervisor IO.
Regardless of the cause of the pause, a freeze is a freeze. The impact to Windows or Linux is the same.
Back to the kernel 4 possible states, you can conclude that:
-
Run + Ready + Co-stop + Wait = 100%
-
VM 2 can run when VM 1 is on Co-stop state, Ready state, or Wait state. This is because the physical thread becomes available.
Ready, Co-stop, Wait are unaware of contention due to hyperthreading. The vCPU is not placed in ready state because both threads can execute at the same time. The contention for shared resources happens at low level hardware and essentially transparent to ESXi scheduler. If you are concerned about this certain degradation in throughput when two worlds execute at the same time on the same core, what counter should you use?
You’re right. It’s CPU Latency. Different purpose, different counter.
OS Comparison
Those of you familiar with Operating Systems[^4] kernel will notice that the diagram is similar with a physical OS scheduler state diagram. I’m taking [[Huawei Harmony OS](https://device.harmonyos.com/en/documentation)](https://developer.huawei.com/consumer/en/harmonyos/develop/) as an example as it’s a new OS and it’s designed for a range of device[^5].
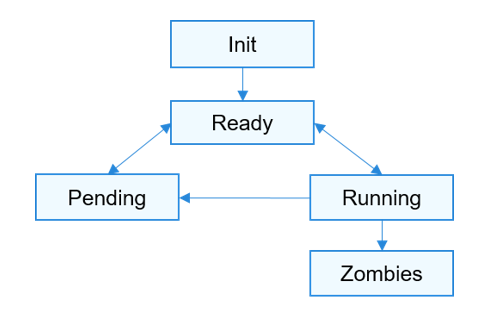
| Init | The process is being created. Maps to New in the kernel |
|---|---|
| Ready | The process is in the ready list and waits for being scheduled by the CPU. Maps to Ready in the kernel |
| Running | Maps to Run in the kernel |
| Pending | The process is blocked and suspended. When all threads in a process are blocked, the process is blocked and suspended. Maps to Wait in the kernel. Notice they also include Idle here in their Wait state. |
| Zombies | Maps to Zombies in the kernel |
| “none” | Our Co-stop is unique as VM is a multi-process scheduled entity |
Fair Share Scheduler
The preceding state diagram is only for 1 vCPU. ESXi schedules multiple VMs, and each can have multiple vCPU. How do you ensure fairness since cores in a single socket can run at different speed? How do you account for hyperthreading? How do you account for VM doing heavy IO processing?
Enter the Fair Share Scheduler.
It gives each vCPU a slice of time. Since the quality can vary, ESXi extends the time for a particular vCPU to maintain relative fairness. It uses a CPU counter called Used (ms), which adjusts the simple runtime (CPU Run) by:
-
Increasing the run time if the vCPU runs on a shared physical core.
-
Adjusting the run time to account for CPU frequency.
-
Decreasing the run time to account for IO work performed by the hypervisor on behalf of the vCPU.
BTW, if you need a comparison, this is a good reading on the latest Linux EEVDF Scheduler. This Earliest Eligible Virtual Deadline First has completey replaced the Completely Fair Scheduler (CFS) in Linux 6.12. The main limitation of CFS is how it handles short burst tasks that need to be scheduled immediately.
State Across Time
The above is at any given moment. To measure over time and report it (say every 20 seconds), we need to add a time dimension. The following example shows the above state diagram repeated over time, where each block is 1 second. In reality, the scheduler checks every 2- 30 milliseconds.
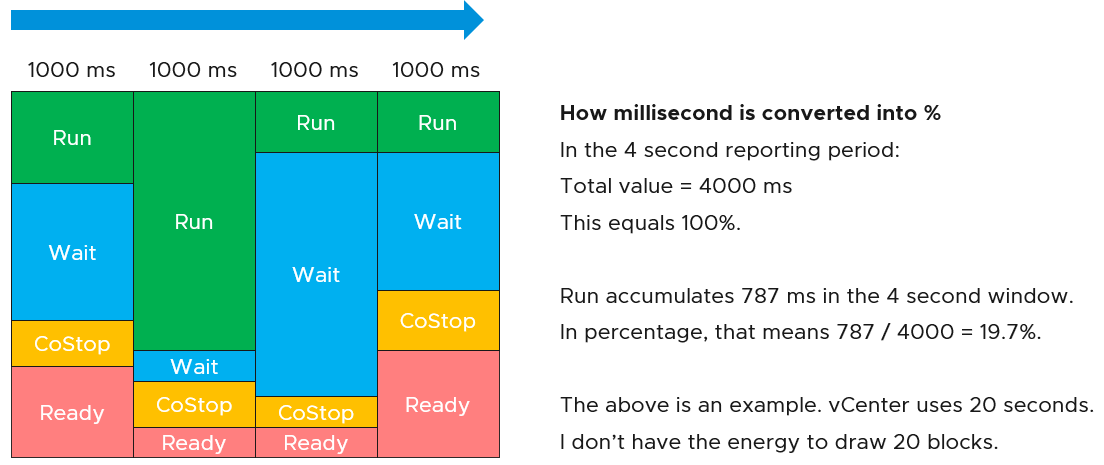
vCenter happens to use 20000 milliseconds as the reporting cycle, hence 20000 milliseconds = 100%.
The above visually shows why Ready (%) + Co-stop (%) needs to be seen in context of Run. Ready at 5% is low when Run is at 95%. Ready at 2% is very high when Run is only 10%, because 20% of the time when the VM wanted to run it couldn’t.
The above is per vCPU. A VM with 24 vCPU will have 480,000 as the total. It matters not if the VM is configured with 1 vCPU 24 vCores or 24 vCPU with 1 vCore each.
You can prove the above by stacking up the 4 metrics over time. In this VM, the total is exactly 80000 ms as it has 4 vCPU. If you wonder why CPU Ready is so high, it’s a test VM where we artificially placed a limit.
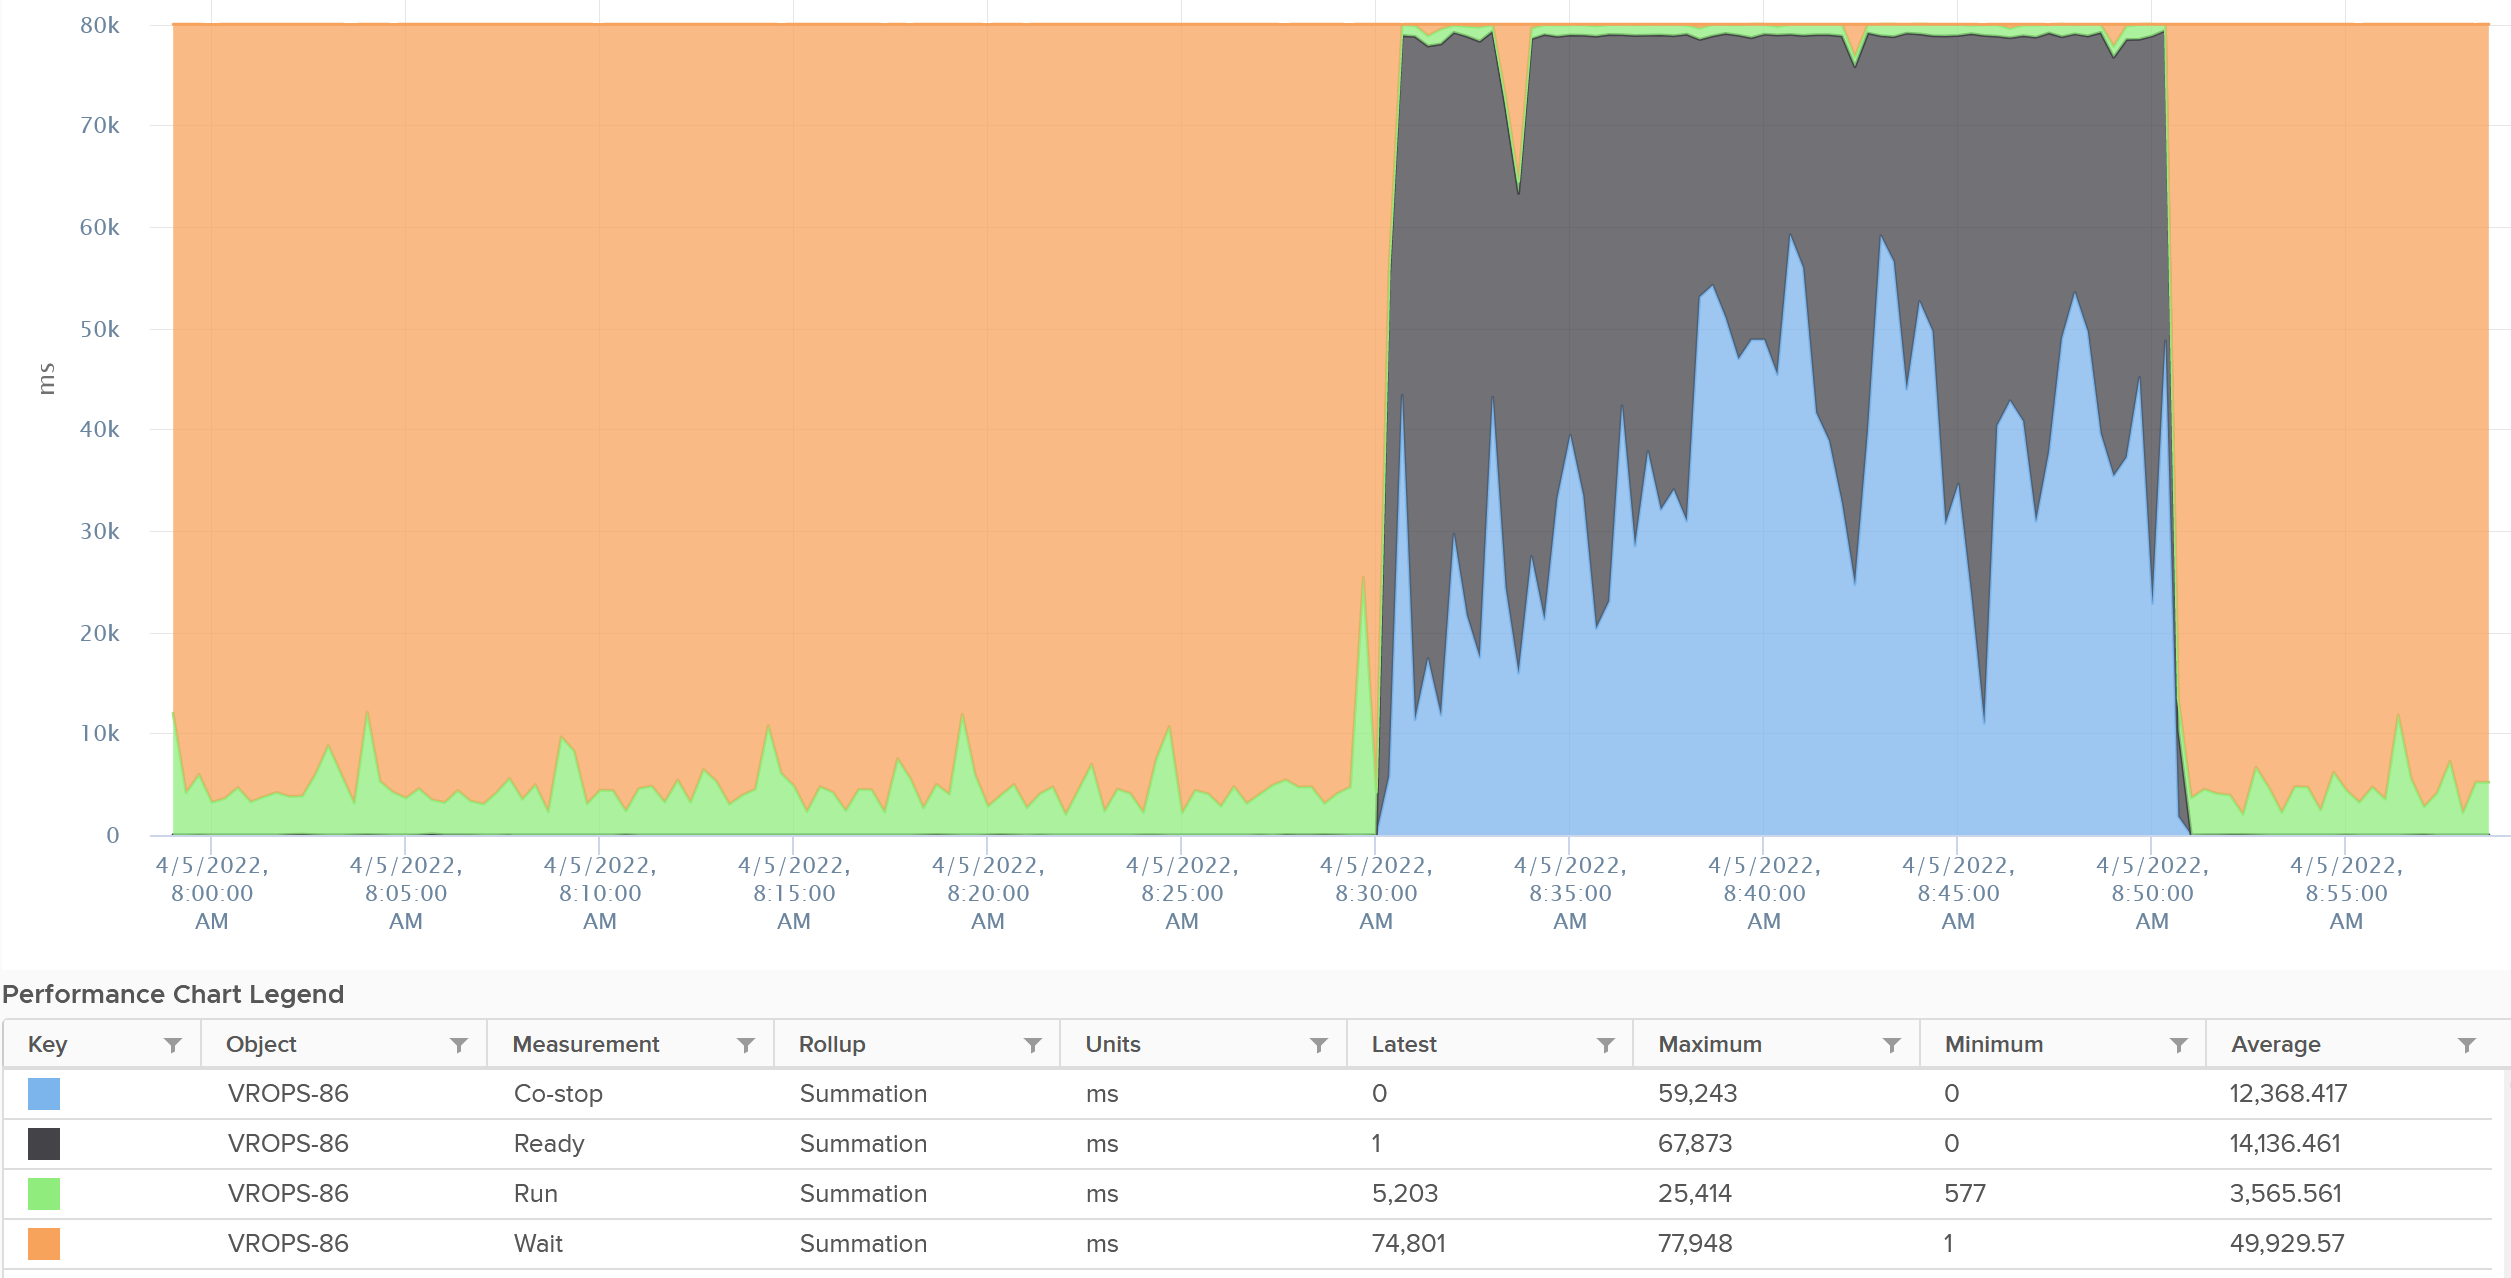
The formula for the millisecond metrics in VCF Operations are also not normalized by the number of vCPU. The following shows the total adds up to 80000 as the VM has 4 vCPU.
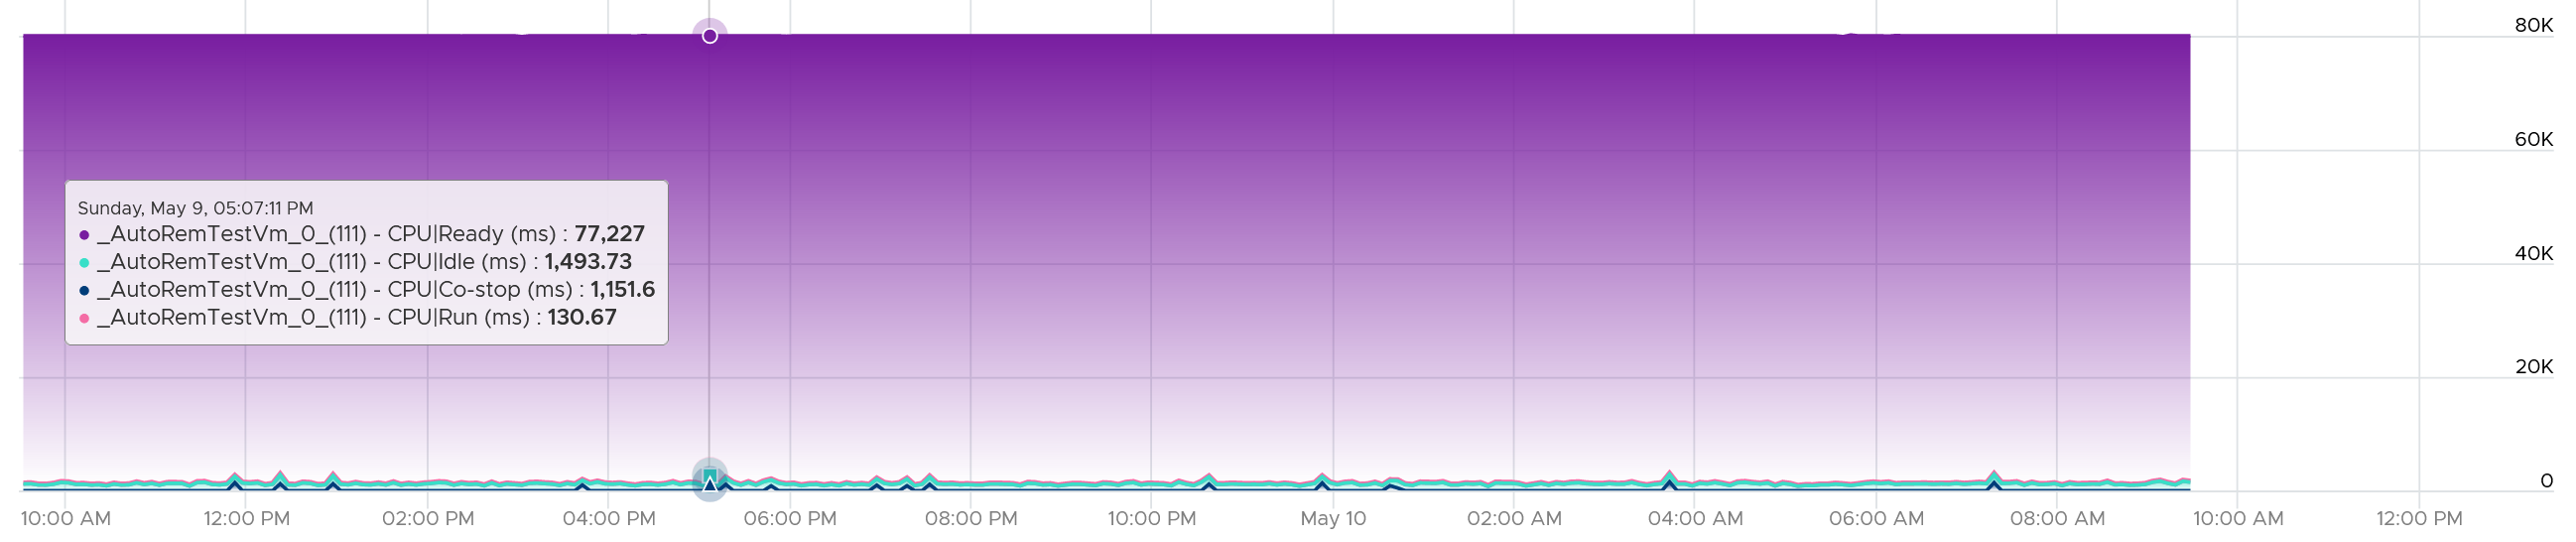
This is why you should avoid using the millisecond counter. Use the % version instead. They have been normalized.
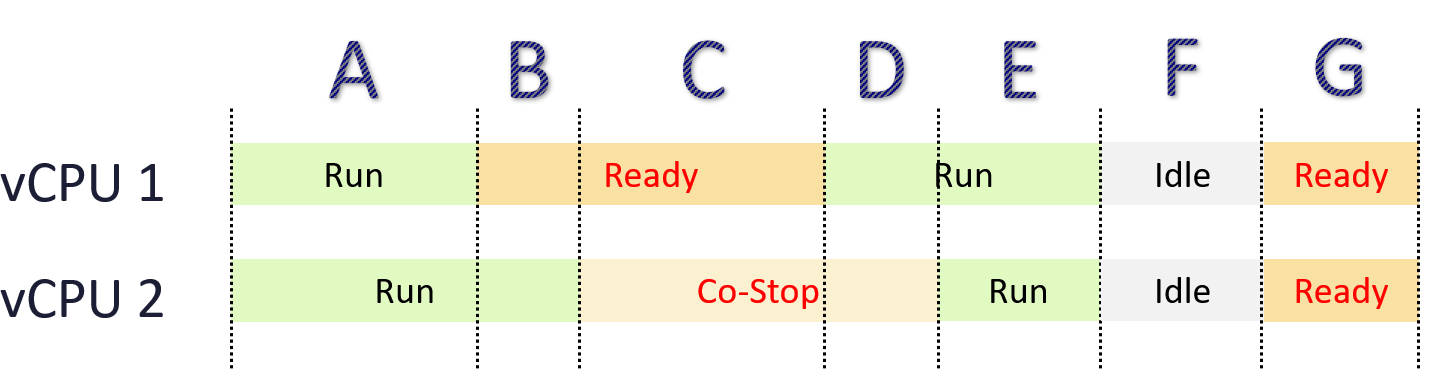
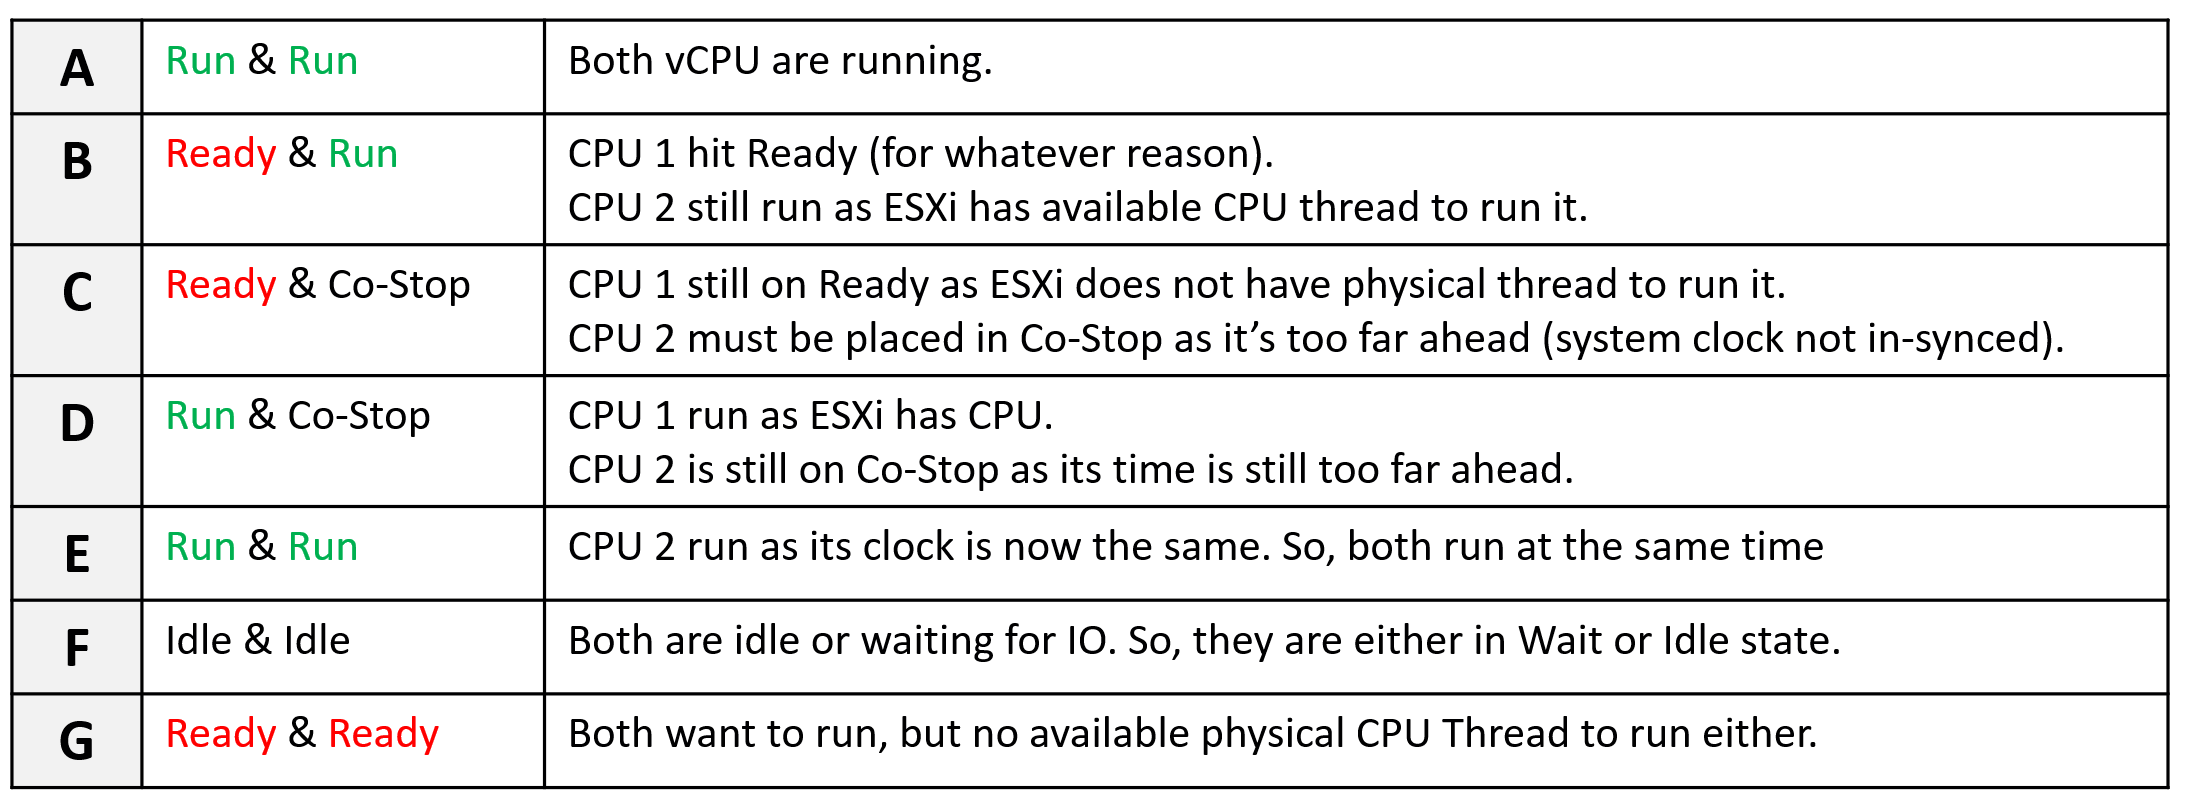
State Across Multiple vCPU
Ready and Co Stop can impact one another.
The following shows a 2 vCPU VM.
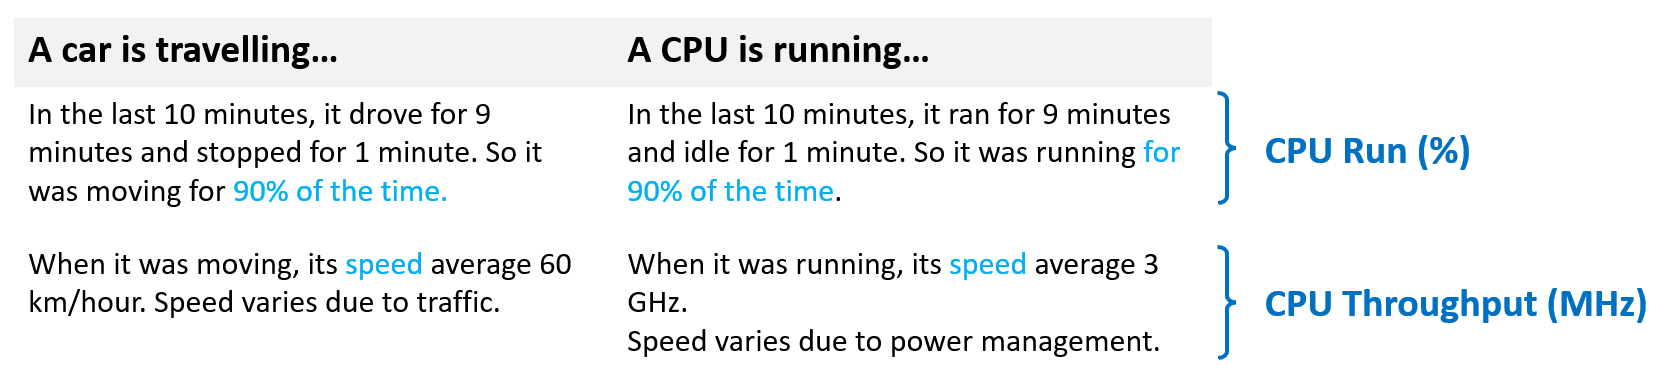
2 Metrics Not 1
When you order a taxi, you expect 2 numbers on your mobile phone.
-
The first number shows time. It tells you how long you have to wait.
-
The second number show distance. It tells you how far the car is.
For example, the application tells you the car will reach in 3:50 minutes and it’s 2.8 kilometres away.
What metric you don’t need, hence it’s not provided?
The progress is 78%. A relative metric like this has no purpose as the 100% is undeterministic. The car may experience traffic jam, diversion, or simply makes a wrong turn.
The same thing in CPU, although it’s not obvious to us.
The following table provides the comparison.
Review the following diagram. What do you observe?
There are 2 metrics:
-
Metric 1 is simple. It’s binary. Counting whether CPU run or not running. It measures duration or time. Use it for capacity.
-
Metric 2 is variable. Yes, the amount of CPU cycles completed varies. It’s only activated when Metric 1 is not 0. It measures intensity of work. This is the equivalent of distance travelled. Use it for performance.
Frequency | Efficiency | Efficacy
There are 3 that get mixed into a single counter that measure the amount of work completed.
| Frequency | impacted by clock speed | All else being equal, a 2 GHz CPU does 2x more cycles than 1 GHz CPU |
|---|---|---|
| Efficiency | impacted by Hyperthreading | All else being equal, a core running 2 threads completes 1.25x more cycles at the expense of each thread gets only 0.625x. Note these numbers are hardcoded for ease of reporting |
| Efficacy | Feature of core architecture | It is not part of the accounting. See below. |
Efficacy is one reason why upgrading to a new generation CPU with lower clock speed result in faster performance.
Unlike memory, storage and network, there is another capability of CPU that makes the same application get more done despite running on the same frequency. Yes, this means that 1 GHz on a brand-new Intel Xeon is probably 30% faster than 1 GHz on a 5-year-old Intel Xeon. Same company, same CPU famiy, same clock speed.
Why your application can get 30% more work done is due to design change. The CPU has both more L2 cache and more L3 cache per core, so even a single thread process gets more work done despite running at the same speed. Other design improvements such as superscalar, better branch prediction, better pipeline, and higher pipes all contribute to it.
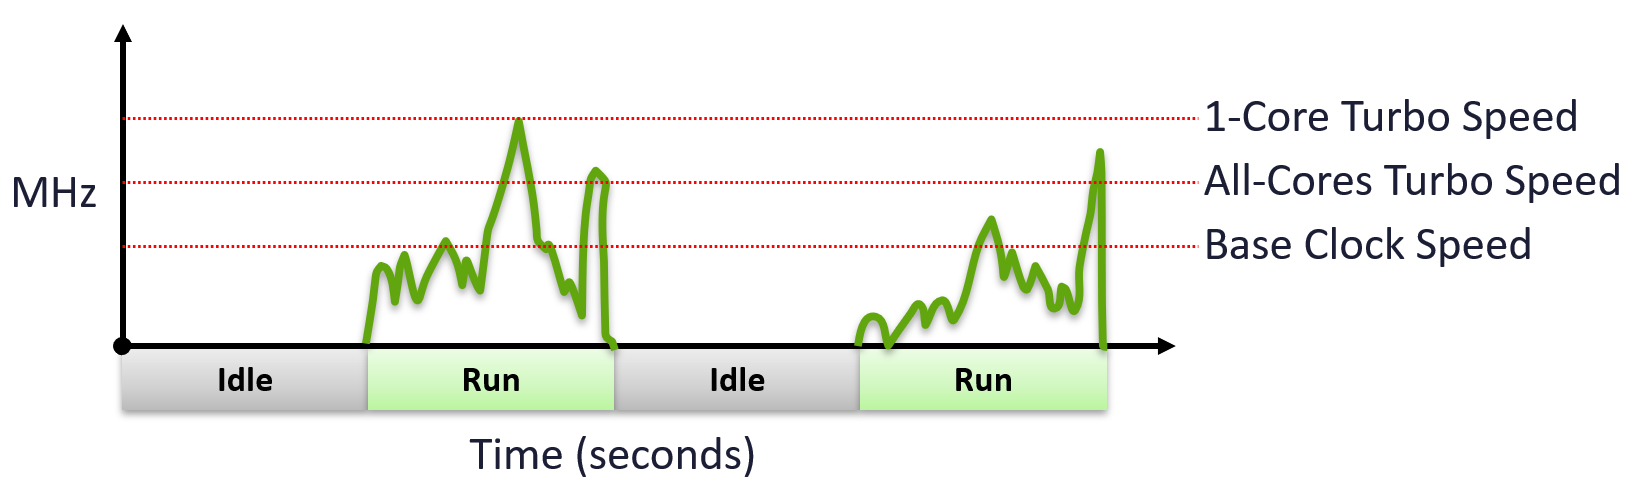
CPU Frequency
What is your CPU Speed?
There are 3 main numbers that defines the speed:
| Base | This is what vSphere uses as the total capacity. It is the nominal frequency and most commonly shown. The CPU rarely runs at this speed. It runs above it, giving you extra performance for free. |
|---|---|
| Single-Core Turbo | This is what marketing will show you. Benchmarking of single thread app is done with this frequency. This is typically much higher. Using AMD EPYC 9000 series family, it ranges from 7% - 64% additional speed gain. Using Intel Xeon Platinum 8593Q, the gain is 77%. |
| All Cores Turbo | This is what you should pay attention to. AMD shares the All Core Boost speed, while Intel no longer does that. Since Intel does not provide the All Core Boost via API, we can’t use it as part of capacity. Using AMD EPYC 9000 series family, the gain ranges from 1% - 48%. |
Intel has a page called What is CPU Clock Speed. Below is an extract, with relevant highlight from me:
Intel Turbo Boost Technology enhances clock speed dynamically to deal with heavy workloads. It works without requiring any installation or configuration by the user. The technology judges the amount of heat the system can tolerate, as well as the number of cores in use, and then boosts clock speed to the maximum safe level.
Base Processor Frequency and Max Turbo Frequency are two core performance metrics that refer to different usage scenarios. For high-intensity gaming, the turbo frequency is the more important metric. Given adequate cooling, this is the speed your CPU will operate at when dealing with heavy gaming workloads such as traveling through a highly detailed environment, or calculating AI behavior on an enemy turn in a strategy game in the most CPU-intensive titles.
Recent features like the Intel Thread Director allow the latest gen Intel processors to intelligently distribute workloads to multiple cores. That’s one reason why newer processors often outperform older ones on benchmark tests even when they have similar clock speeds.
Each core can have its own frequency. This makes rolling up the number to ESXi level more complex. You can’t derive one throughput counter from the other. Each has to be calculated independently at core level.
Total Capacity
The above brings an interesting question: what is your CPU Total Capacity?
The higher the frequency (GHz), the faster the CPU run. Ceteris paribus, a CPU that run at 1 GHz is 50% slower than when it runs at 2 GHz. On the other hand, Turbo Mode can kick in and the CPU clock speed becomes higher than stated frequency. Turbo Boost normally happens together with power saving on the same CPU socket. Some cores are put to sleep mode, and the power saving is used to turbo mode other cores. The overall power envelope within the socket remains the same.
How high is the gap?
The gap between the base clock speed and the highest turbo is around 2x. The gap started to appear in the year 2008, when Intel Nehalem was introduced. The early Turbo versions could turn cores off or on, they generally forced all active cores to run at the same frequency. In 2014, Intel introduced Per-Core P-States (PCPS) with the Haswell-EP (Xeon E5-2600 v3). This allowed each individual core to reside in its own power state and frequency independently. AMD achieved a similar, even more granular level of control with the first Zen (EPYC/Ryzen) processors in 2017, using a network of hundreds of sensors to adjust clock speeds in 25MHz increments per core.
| | 2006 | 2026 |
|----|----|----|
| Examples | Intel Xeon 5160 / AMD Opteron 2220 | Intel Xeon 6 / AMD EPYC 9005 |
| Typical Base Clock | 3.0 GHz | 2.0 – 2.3 GHz |
| Max Turbo Clock | N/A (Locked at Base) | 3.9 – 5.0 GHz |
| Core Count | 2 Cores | 128 – 192 Cores |
| Turbo/Base Ratio | 1.0x (No variance) | ~1.7x to 2.2x |
Power States
There are 2 types of power states as defined by ACPI standard.
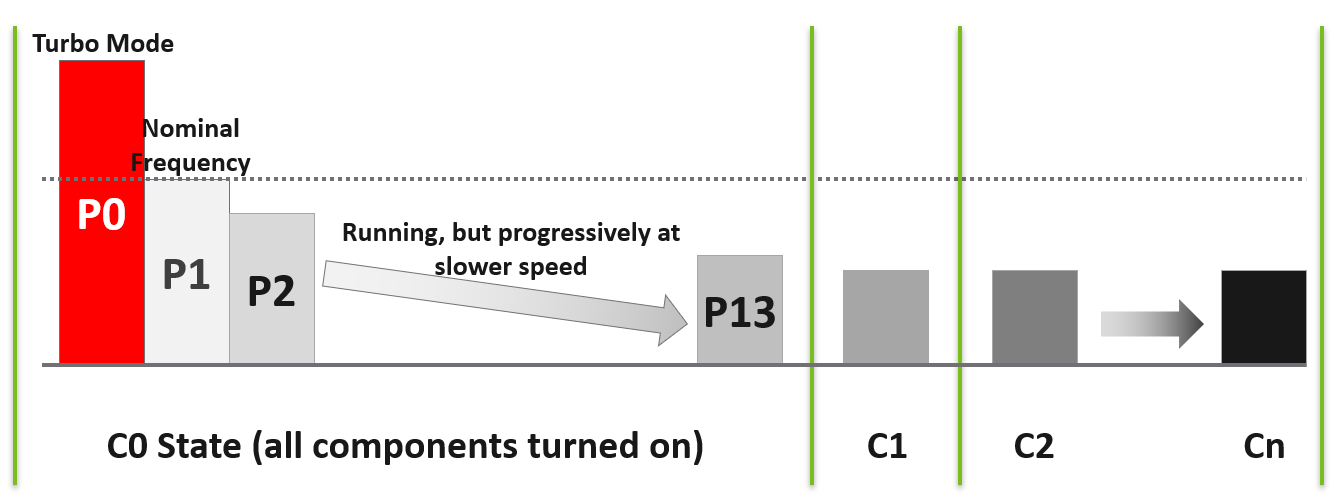
| C-State | C here means CPU. When a core is idle, ESXi applies deep halt states, also known as C-states. The deeper the C-state, the less power the CPU uses, but the longer it takes for the CPU to start running again. ESXi predicts the idle state duration and chooses an appropriate C-state to enter. There are 3 possible sub-states in C-state:
| ||||||||||
|---|---|---|---|---|---|---|---|---|---|---|---|
| P-State | P here means Performance. There are 14 grades of CPU performance, measured by its frequency. You can see all the frequencies in esxtop if your hardware supports it. P0 state where Turbo Boost happens. P1 is where it runs at Nominal Frequency (NF). P13 is the lowest CPU frequency. |
Where is the above implemented?
It’s done in 2 levels. It needs to be enabled in both the BIOS and the OS (ESXi in this case).
BIOS Level
Since it’s the lower layer, it can override the upper layer implementation.
BIOS can also set the power management to BIOS controlled (not OS controlled) in which case ESXi has no say.
To see the setting, use the following vsish command.
/power/> cat /power/platformFeatures
Platform Power Management Features
{
Deep C-states Available:1
Deep P-states Available:1
CPPC Capability Available:1
CPPC Enabled by BIOS:0
Turbo Boost Enabled:1
}
ESXi Level
Just because BIOS passes the control to ESXi, it does not mean that it’s enabled. There are 2 settings
In the vSphere Client UI, go to the ESXi Advanced Settings. You will see these entries:
Use C States = Use deep ACPI C-states (C2 or below) when the processor is idle. Frequency will go lower than base clock speed. Disabling does not mean disabling Turbo. The firmware's thermal management decide on the individual frequency of each core.
Use P States = Use ACPI P-states or CPPC to save power when the processor is busy. When deactivated, the ESX configures to use the highest available frequency.
Collaborative Processor Performance Control (CPCC) is part of the ACPI 5.0+ specification. As the name implies, the OS and the CPU hardware collaborate. Instead of frequencies, the OS hands down a set of abstract performance capabilities and targets to the CPU's on-die microcontroller.
| C State | P State | ESXi CPU Frequency Control |
|---|---|---|
| 1 | 1 | Full Dynamic Range: Cores can drop below Base Nominal to save power, go to 0 Hz (sleep) when idle, and scale up to All Core or Single Core Turbo when heavy workloads demand it. |
| 0 | Rigid Base / Sleep Only: While executing tasks, cores are pinned strictly to Base Nominal (no Turbo expansion, no power-saving down-throttling). Cores only drop power when completely idle via C-state sleep. | |
| 0 | 1 | Throttled Range: Cores can scale down below Base Nominal to save power, but they can never go higher into Turbo because the lack of core sleep states destroys the thermal budget. |
| 0 | Flatline: The CPU runs flat-out at its Base Nominal frequency 24/7 across all cores. No power saving, no sleep, and zero Turbo capabilities. |
For details on P-State and C-State, see Valentin Bondzio and Mark Achtemichuk, VMworld 2017, Extreme Performance Series. Also read this page of VCF official manual.
Turbo
How high can Turbo/Boost go?
It turns out that it is high enough that both performance and capacity need to account for it.
Because speed is the primary attribute for performance, and an important contributor to capacity, the upper limit of CPU performance and capacity become harder to manage.
-
Within a core, it impossible to predict the core frequency. It all depends on the instructions and what other cores are doing. Likely, there is no pattern at all.
-
Within a socket, it’s impossible to predict which cores will run faster at the expense of others. A socket with 20 cores will run at >1 frequency in real world.
The following diagram is taken from page 12 of “Host Power Management in VMware vSphere 7.0**”** whitepaper by Ranjan Hebbar and Praveen Yedlapalli. It shows that Intel Xeon Platinum 8260 can increase its speed by 1.29x (from 2.4 GHz to 3.1 GHz). If it only needs to increase 1 core, that single core can go up by 1.62x. This will be noticeable by application that is CPU intensive. Consider this benefit before you decide to disable power management. The high performance is static, it runs at the same frequency throughout.
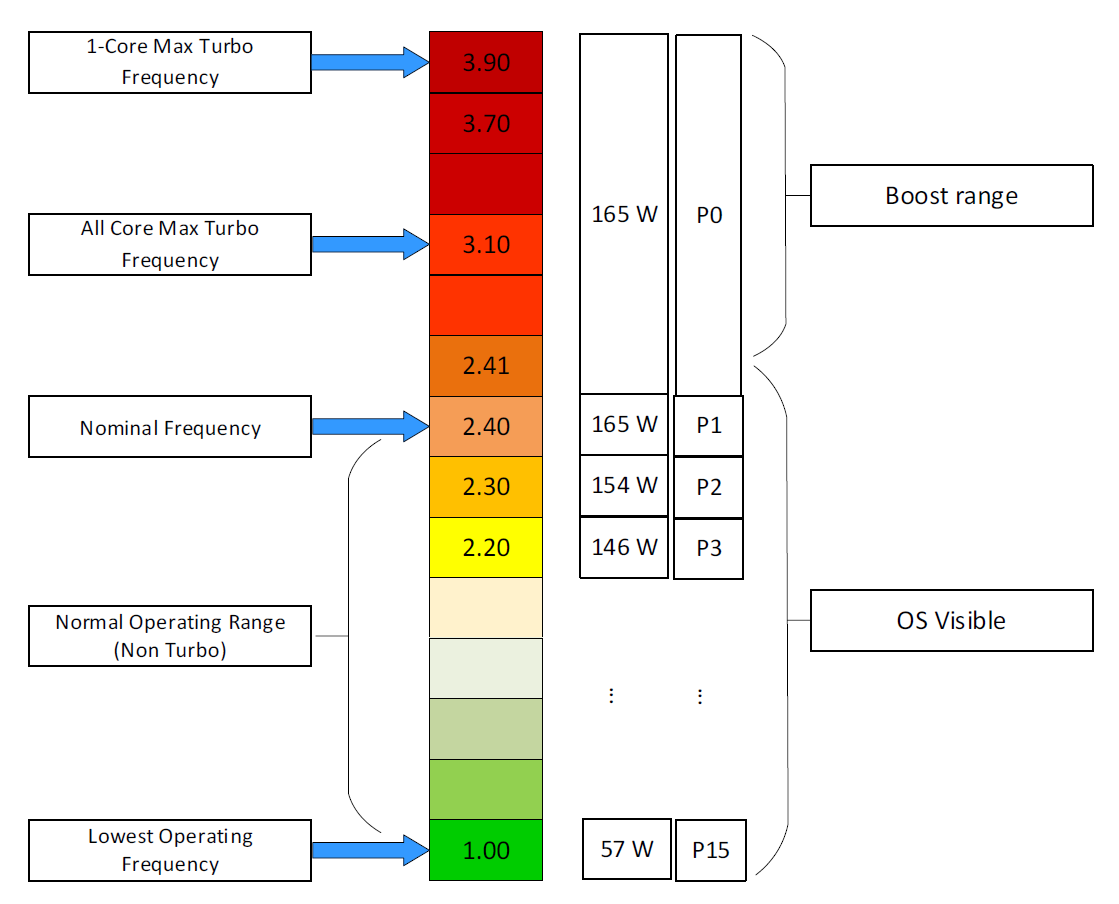
At 2.4 GHz (Base): The CPU uses less than 165W for standard math, but might hit 165W for heavy math.
At 3.1 GHz (All-Core Turbo): The CPU uses its full 165W power budget to maintain that higher speed across all cores. If the workload becomes too intense (like AVX-512), the CPU cannot maintain 3.1 GHz within 165W, so it will automatically drop the frequency to stay under the limit.
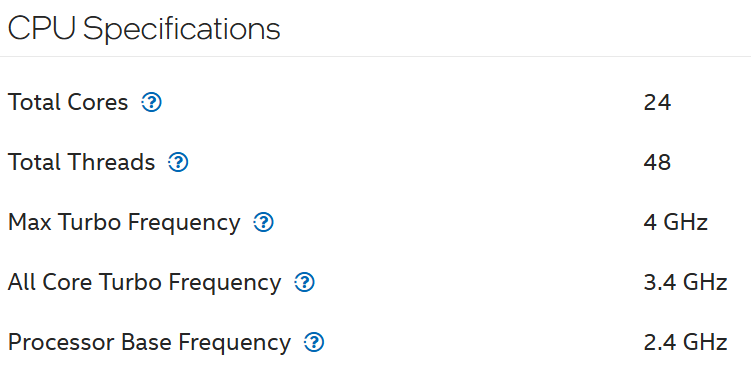
Let’s take a more recent example. The following is Intel Xeon 6520P. It can run at 3.4 GHz, which is 42% higher than the base speed.
BTW, there is no setting in ESXi to disable or enable Turbo Boost directly. Yes, I’m aware Windows has it. In the case of ESXi, it’s enabled by default and all you have to do is set the power management.
Thanks to Sushil Kavi, I learned Turbo can still kick in despite the BIOS setting to static high power management. We verified that the value of %A/MPERF in esxtop showing all cores running at 129%.
All Cores Turbo
Review this article by IOFLOOD.
Done?
Good. I’ve highlighted in green a key point stating your CPU is actually operating at a higher speed.
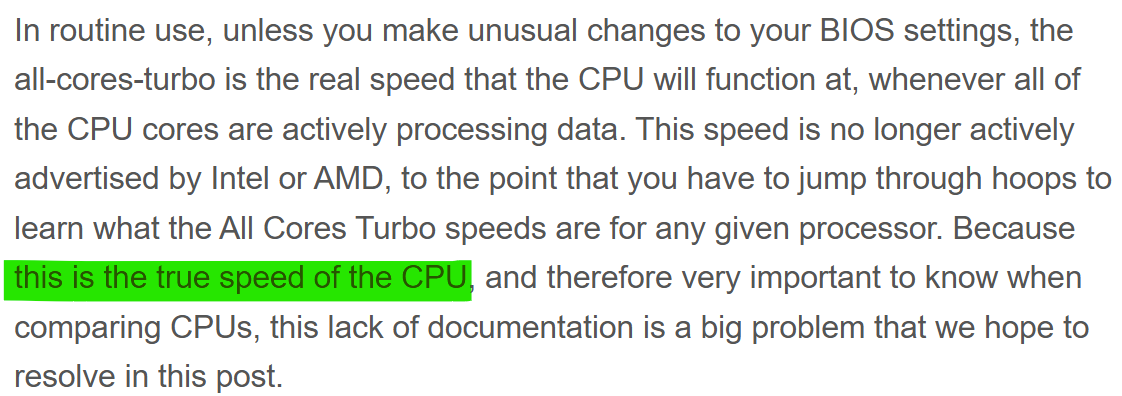
While it’s a good news that you have more capacity, the issue is this number is not always exposed via the CPU API.
Impacts on ESXi
The following table shows the difference in value if All Core Turbo is 20%.
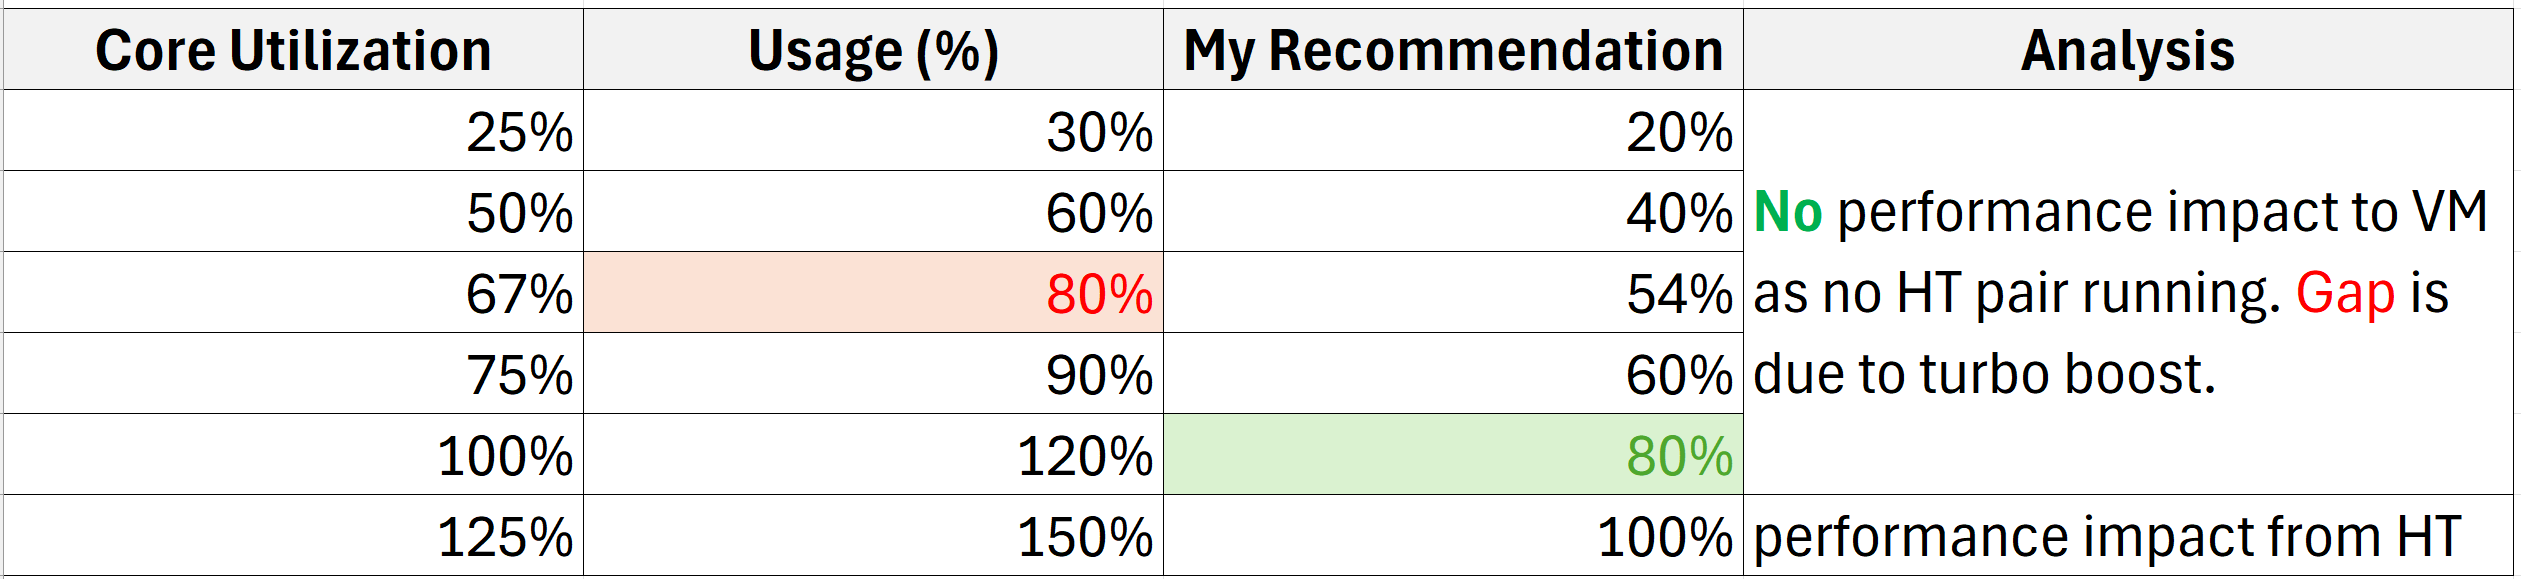
Usage (%) is what vSphere Client UI shows.
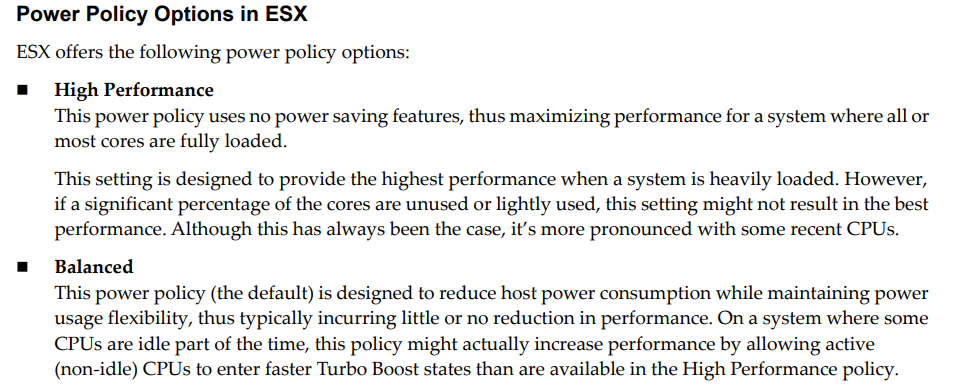
High Performance vs Balance
Should you always set power management to maximum?
No. ESXi uses power management to save power without impacting performance. A VM running on lower clock speed does not mean it gets less done. You only set it to high performance on latency sensitive applications, where sub-seconds performance matters. VDI, VoIP, video calling, Telco NFV are some examples that are best experienced with low latency.
Review the vSphere 9 performance best practices paper. I’ve copied the part you need to focus below:
In mission critical cluster, the overcommit ratio is lower and the VMs tend to be over-provisioned. Or you have 2 hosts for HA as you worry about availability. The end result is your ESXi actual core utilization is not high.
Impact on Oversized VM
One downside of an oversized VM is higher risk of some vCPU becoming idle. When the VM becomes idle, the power enters C1 State, but does not go deeper to C2. This enables the VM to quickly spike, which is evident on the spikes at the end.
The following diagram is taken from page 24 of “Host Power Management in VMware vSphere 7.0**”** whitepaper by Ranjan Hebbar and Praveen Yedlapalli.
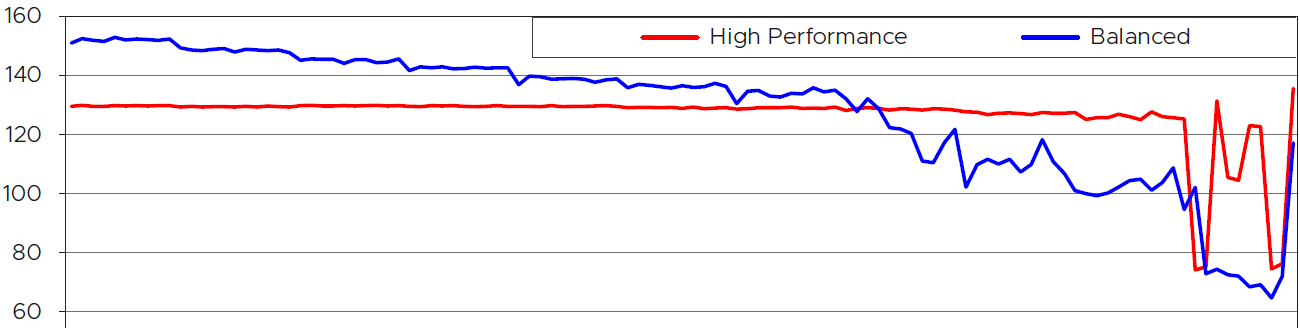
I cut out the chart so we can explain how balanced power management delivers higher performance than high performance setting.
The vertical axis is the CPU Frequency, where the 100 is the nominal frequency. Yes, at the start the CPU was running well above the nominal frequency. Balanced was running higher than High Performance.
The red line is the VM CPU frequency when ESXi power management was set to High Performance. The blue line is Balanced.
The horizontal axis is not time. It’s how busy the core is. It starts with 100% busy and steadily goes down to 0, meaning the VM was idle. The VM was not powered off at the end.
The red line is fairly constant until the VM becomes idle. This makes sense as the entire CPU socket is kept on high, so all the cores are equal. As the result, the CPU boost only goes to 130% mark.
The blue line starts at much higher throughput. This makes sense as the CPU has flexibility. It can boost the running cores to 151% as other cores are idle. This is why balanced performance can deliver higher performance on low to medium load ESXi.
As the core gets less busy, the CPU reduces its clock speed. Notice it is still higher than 100 until it became idle. When the VM is idle, the CPU entered the deep C2 State. Notice there was no spike and the frequency dropped deeper.
CPU Efficiency
CPU SMT (Hyper Threading as Intel calls it) impacts CPU accounting as it delivers higher overall throughput. It increases the overall CPU cycles completed of the core, but at the expense of individual thread throughput. The increase varies depending on the load.
Accounting wise, it is expensive to measure as the core speed is not affected. It is still running at the same frequency. ESXi records this overall boost at 1.25x regardless of the actual increase, which may be less or more than 1.25x. Your application may experience 2.x or 1.x, the counter will simply report 1.25x.
If both threads are running at the same time, the core records 1.25x overall throughput but each thread only gets 62.5% of the shared physical core. This is a significant drop from the perspective of each VM. From the perspective of each VM, it is better that the second thread is not being used, because the VM could then get 100% performance instead of 62.5%. Because the drop could be significant, enabling the latency sensitivity setting will result in a full core reservation. The CPU scheduler will not run any task on the second HT.
The following diagram shows 2 VMs sharing a single physical core. Each run on a thread of the shared core. There are 4 possible combinations of Run and Idle that can happen:
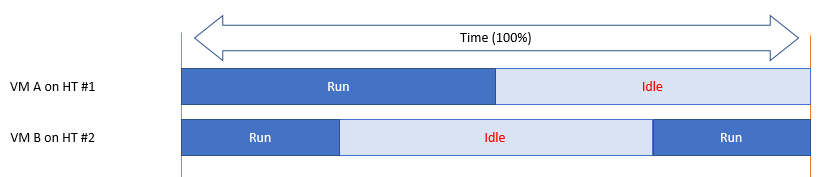
Each VM runs for half the time. The CPU Run counter = 50%, because it’s not aware of HT. But is that really what each VM gets, since they have to fight for the same core?
The answer is obviously no. Hence the need for another counter that accounts for this. The diagram below shows what VM A actually gets. The allocation is fixed.
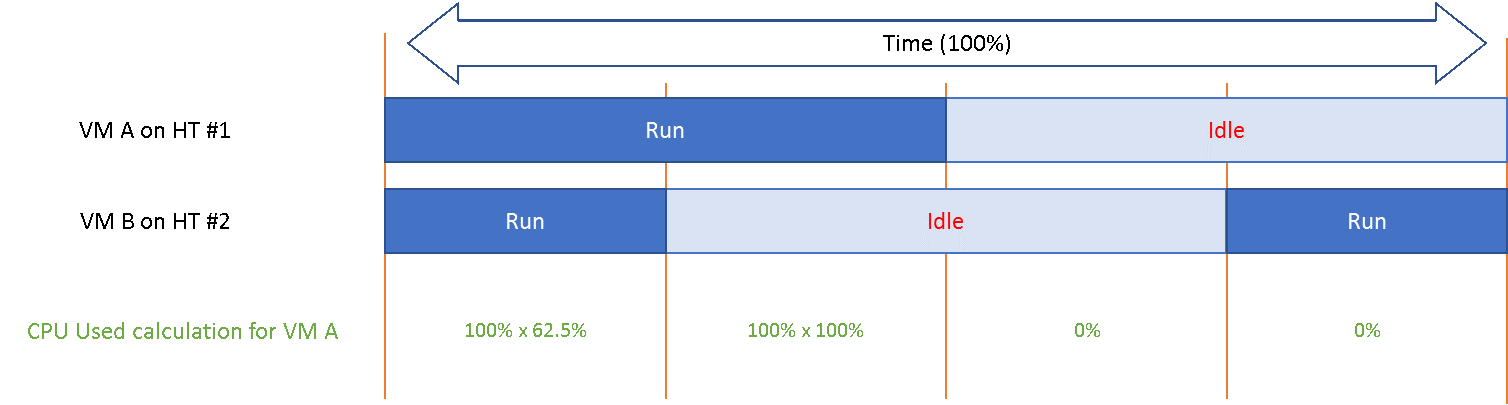
The CPU Used counter takes this into account. In the first part, VM A only gets 62.5% as VM B is also running. In the second part, VM A gets the full 100%. The total for the entire duration is 40.625%. CPU Used will report this number, while CPU Run will report 50%.
If both threads are running all the time, guest what CPU Used and CPU Run will report?
62.5% and 100% respectively.
CPU Throughput
The CPU efficiency and frequency have the same final effect. Both impacts the number of CPU productive cycles processed attributed to a particular thread of vCPU. This is why I prefer to call the metric CPU Throughput instead of CPU Usage and CPU Used. The word usage and used are confusing as it’s a general English word.
A CPU is always running. A CPU could be running many cycles while waiting for data from memory or a disk, and those cycles are effectively "wasted" from the perspective of completing the task. I hope the English word throughput conveys that it refers to the useful cycles, and not idle loop.
Impacts on VM
Let’s take an example to quantify the impact of both CPU frequency and CPU efficiency on a VM vCPU.
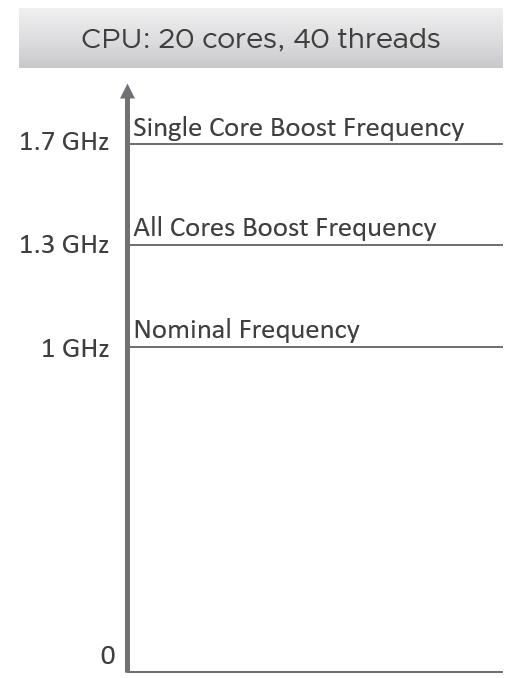 | The CPU can run all its 20 cores at 30% higher speed. When only a single core is used, it runs up to 70% faster. An example of CPU capable of such performance boost is AMD EPYC 9634. For ease of calculation, this sample CPU has a nominal clock speed of 1 GHz. This is what you see in vSphere Client UI, and what you consider as 100%. The number is shown in red as using this number as total capacity leaves money on the table. |
|---|
Now let’s look at what the experience that Windows or Linux receive as a result.
You will see that a VM can run 100% flat out for hours yet the amount of work completed varies wildly by the second. This is why VM performance feels unpredictable.
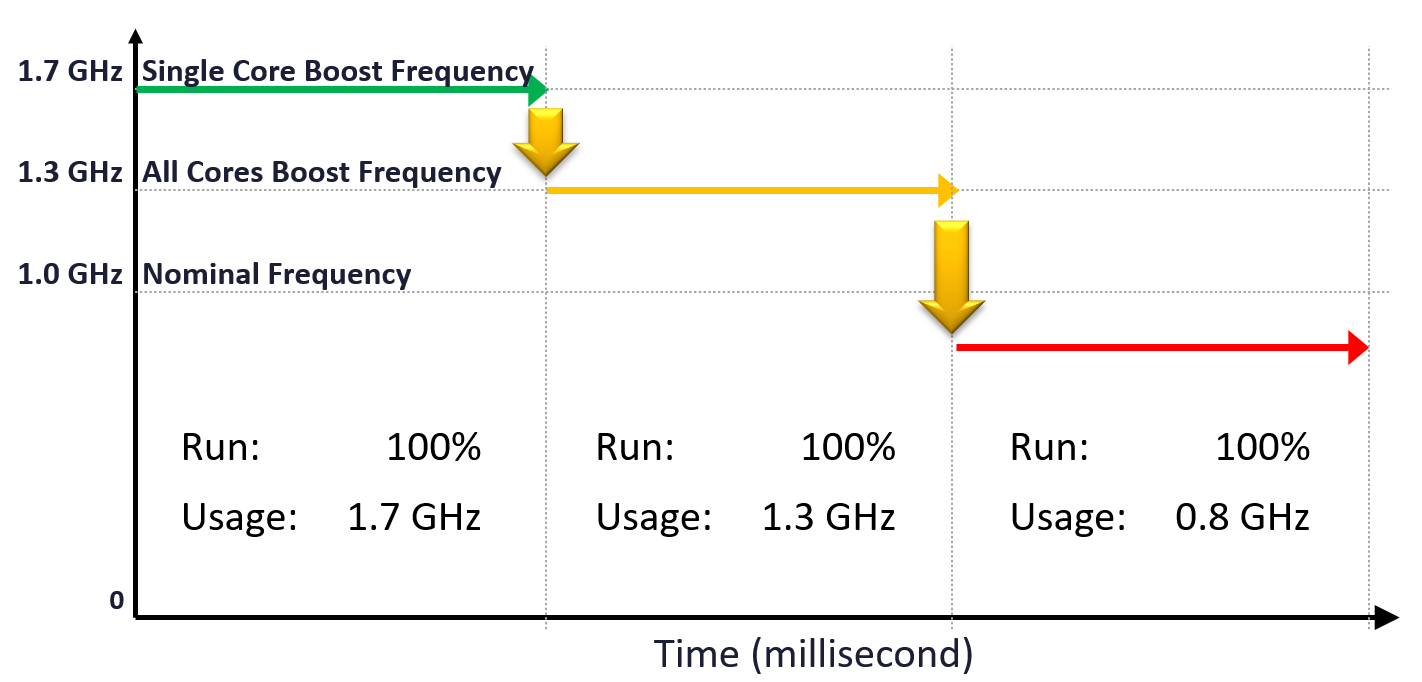
We consider 2 extreme scenarios. In typical data center, you’re fluctuating between these 2 edges.
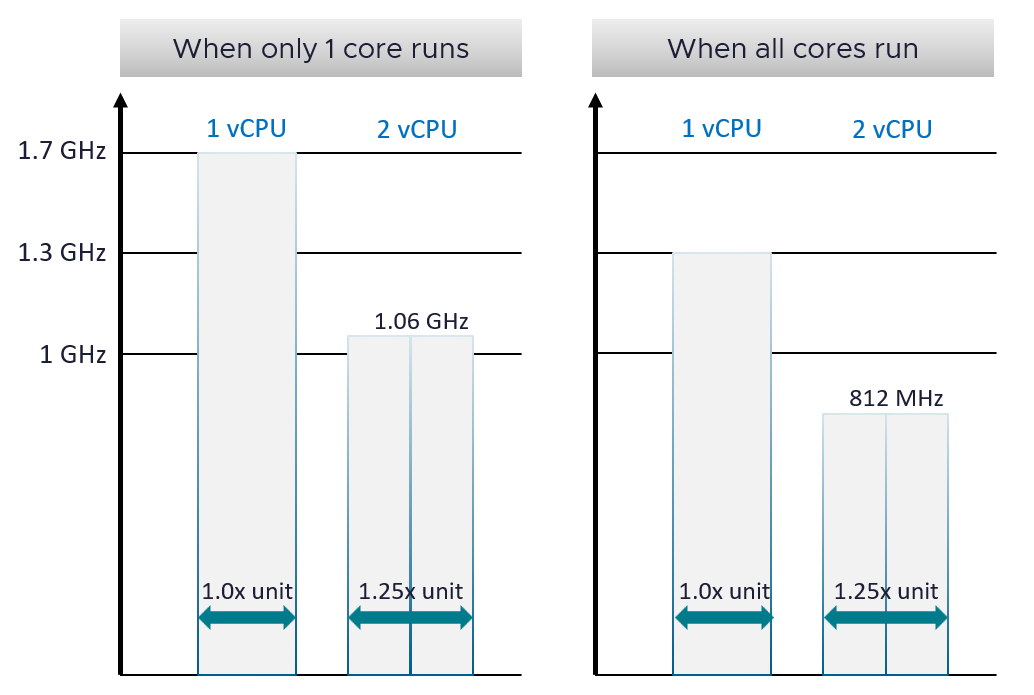
One 1 extreme, the entire CPU only runs 1 core out of 20 cores. If a vCPU runs at 100% and has 0% contention, it will get 1.7 GHz cycles. This is 70% higher than the nominal speed. VM CPU counter such as Demand will report 170%. If you’re not careful, you will think you need more vCPU. In this case, adding more vCPU will make the situation worse.
Let’s say you add a second vCPU. For simplicity, let’s assume they run on the same core. What happens is hyperthreading penalty kicks in. Each only gets 62.5%. So now both vCPU gets 1.06 GHz. So instead of getting 3.4 GHz total, you get 2.12 GHz.
Now let’s look at the other extreme. All the cores are running at the same time. A VM with 1 vCPU will run at 1.3 GHz. Again, since VM CPU Demand is based on 1 GHz, it will report 130%. You then add another vCPU. Now, since all the cores are busy, there is a real chance that the VM 2 vCPU will end up on the same core. In this case, each will run at 812 GHz. You will now be confused, as both runs at 81% yet it seems to have maxed out.
The flow over time in the preceding example is 1.7 GHz 🡪 1.3 GHz 🡪 1.06 GHz 🡪 0.81 GHz, as ESXi CPU scheduler will maximize throughput. The problem is CPU Usage (%) metric mask out this degradation. Couple with the fact that it happens over time as VMs get added into the clusters, it becomes complex to figure out.
VM
Take note that some metrics are for the kernel internal consumption, and not for vSphere administrators. Just because they are available in the UI and have names that sound useful do not mean it’s for your operations. Their name is written from CPU scheduler viewpoint.
I will use the vSphere Client as the source of metrics in the following screenshots.
vSphere provides 6 metrics to track contention.

You get 9 metrics for consumption.
I group Wait metrics separately as it mixes both contention and consumption.
Contention Metrics
Let’s dive into each counter. As usual, we start with contention type of metrics, then utilization.
Contention has to be judged within the context of consumption. A 2% CPU Ready relative to a 10% CPU Run is “not good”, while 2% Ready on 98% Run is “good”. What I meant is the application may not feel the later, as 98% Run means the application gets a lot of work done. On the other hand, if you have an oversized VM, and it only needs 10% CPU power because business is bad, a 2% CPU Ready means 20% of that business transactions were delayed.
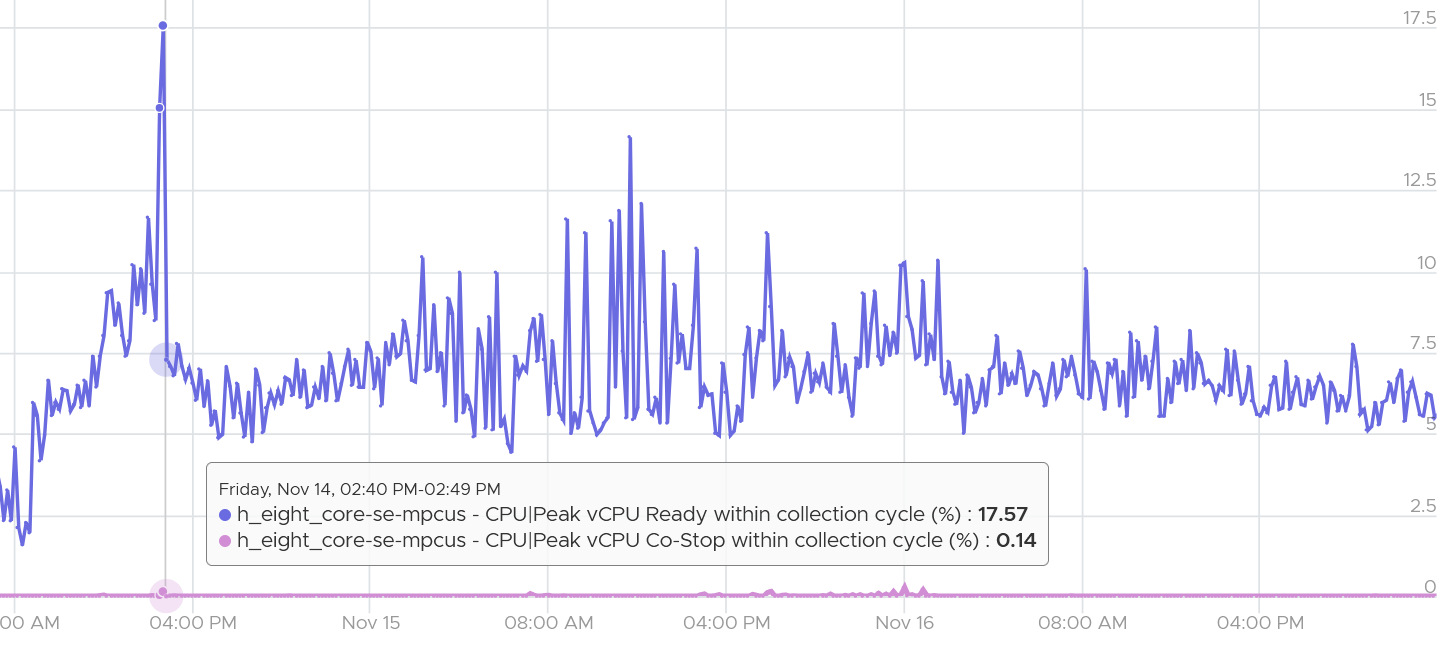
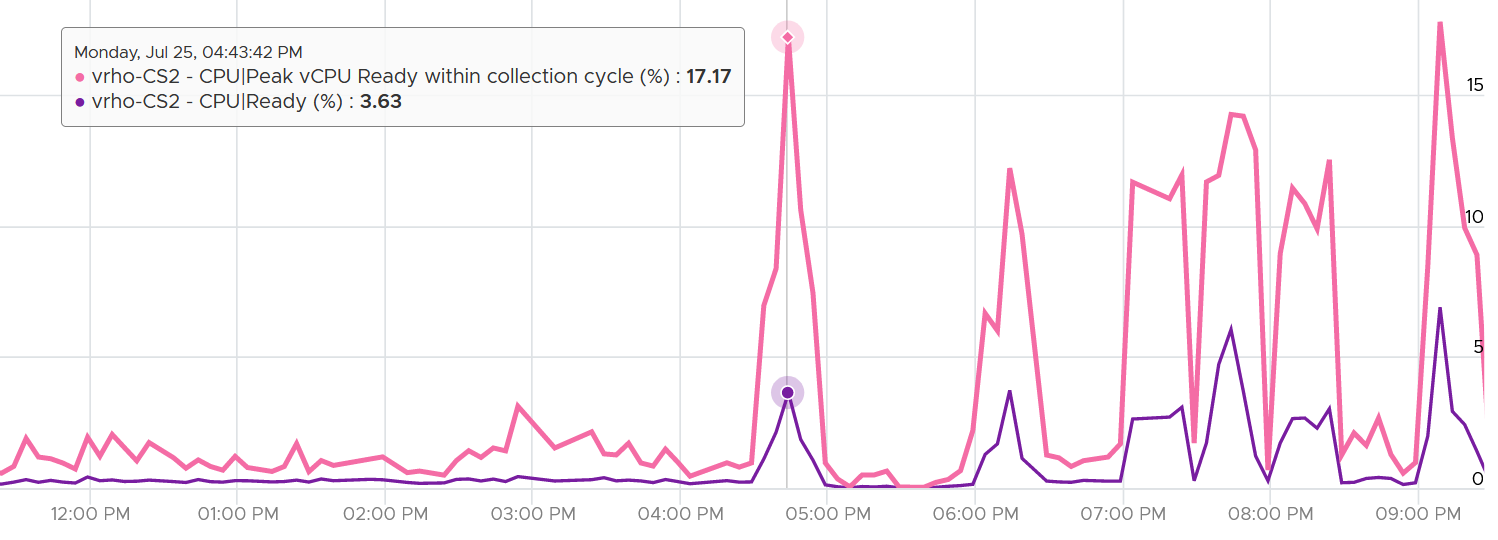
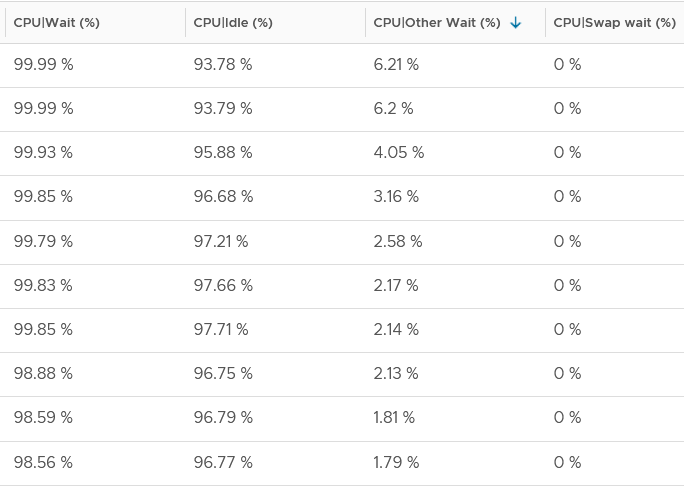
The main 2 counters are Ready and Co-stop. The other 2 counters (Overlap and Other Wait) tend to show much lower value, hence less important operationally. The following shows a typical observation, where both are very high, yet CPU Overlap is near 0.
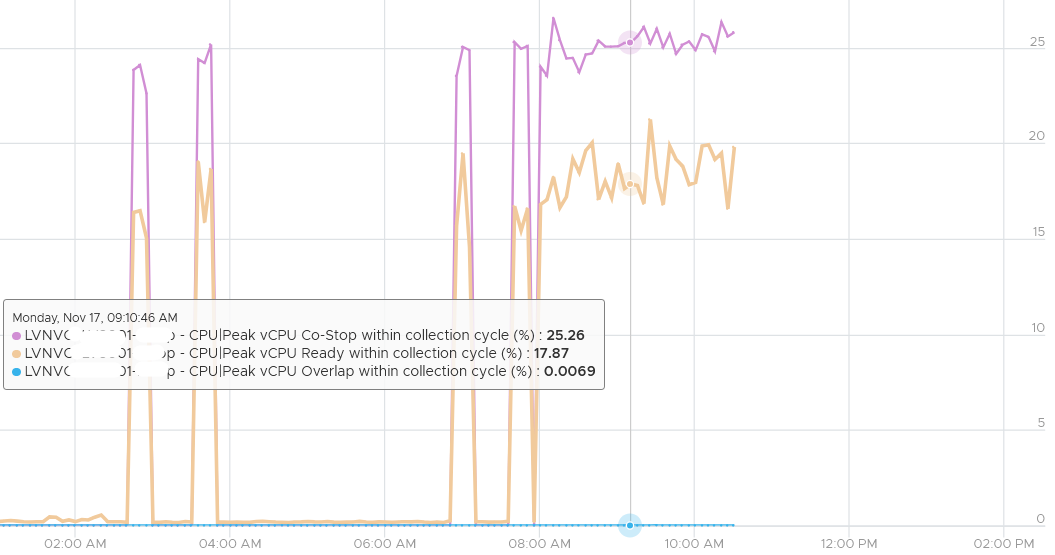
The preceding showed the 20-second peak metric, taken at vCPU level. Taking at the VM level (it has 8 vCPU) shows a similar pattern.
Guest OS is not aware of both Co-stop and Ready. The vCPU freezes. “What happens to you when time is frozen?”[^6] is a great way to put it. As far as the Guest OS is concerned, time is frozen when it is not scheduled. Time jumps when it’s scheduled again.
The time it spends under Co-stop or Ready should be included in the Guest OS CPU sizing formula as the vCPU wants to run actually.
If VM utilization is not high, reduce its vCPU while following NUMA best practice.
High CPU Ready can happen at low CPU Co-stop. This means everytime the VM vCPU wants to run, there is enough physical CPU threads to run all the vCPU at the same time. So it’s an all or nothing situation.
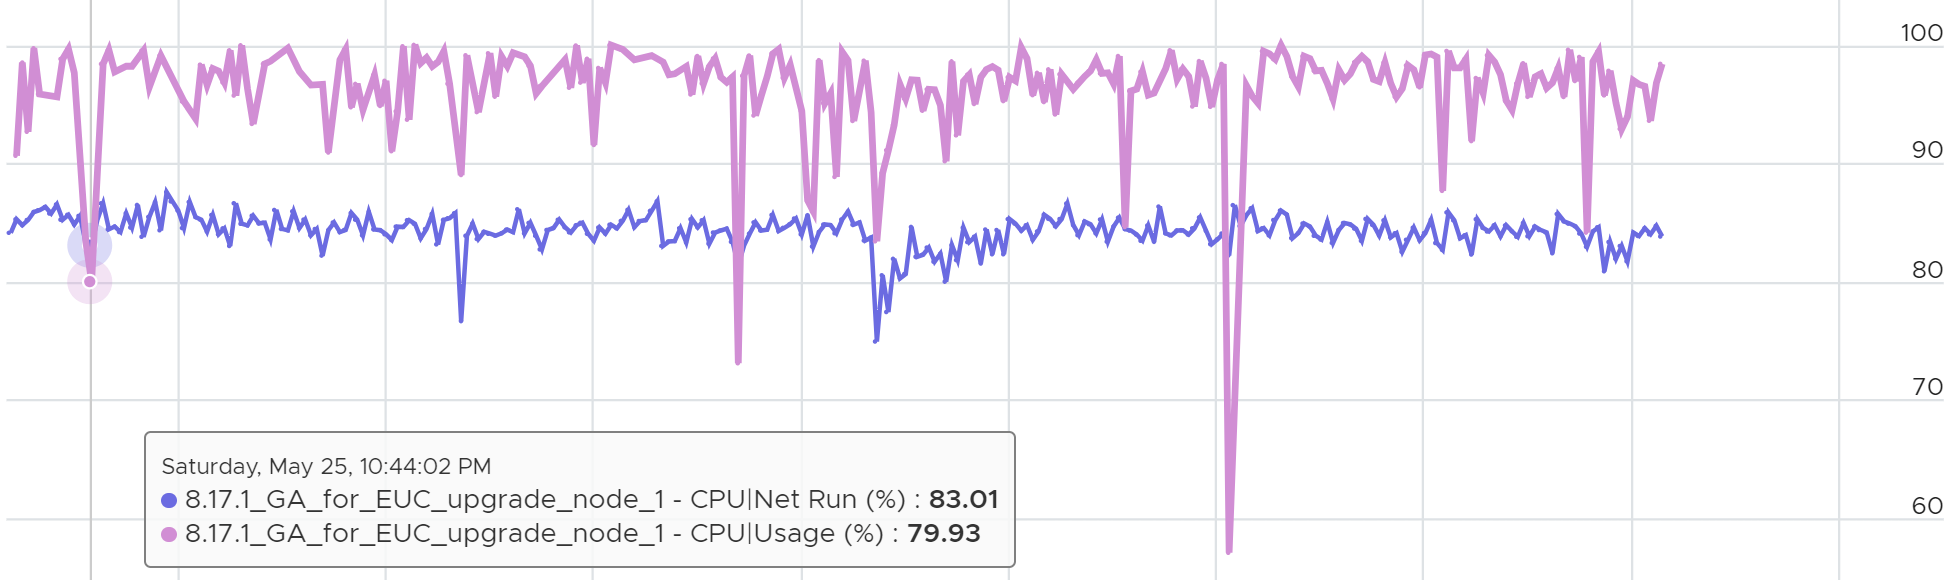
The following shows an 8 vCPU VM with ready hit 7.5% multiple times, while Co-stop remains near 0% for days.
Ready
Ready tracks the time when a VM vCPU wants to run, but ESXi does not have a physical thread (not core) to run it. This could be due to the VM itself (e.g. it has insufficient shares relative to other VMs, it was vMotion) or the ESXi (e.g. it is highly utilized. A sign of ESXi struggling is other VMs are affected too).
When the above happens, ESXi CPU Scheduler places the VM vCPU into Ready state.
Ready also accounts when Limit is applied, as the impact to the vCPU is the same (albeit for a different reason altogether). When a VM is unable to run due to Limit, it accumulates limbo time when sitting in the limbo queue. Be careful when using a Resource Pool, as it can unintentionally cause limits.
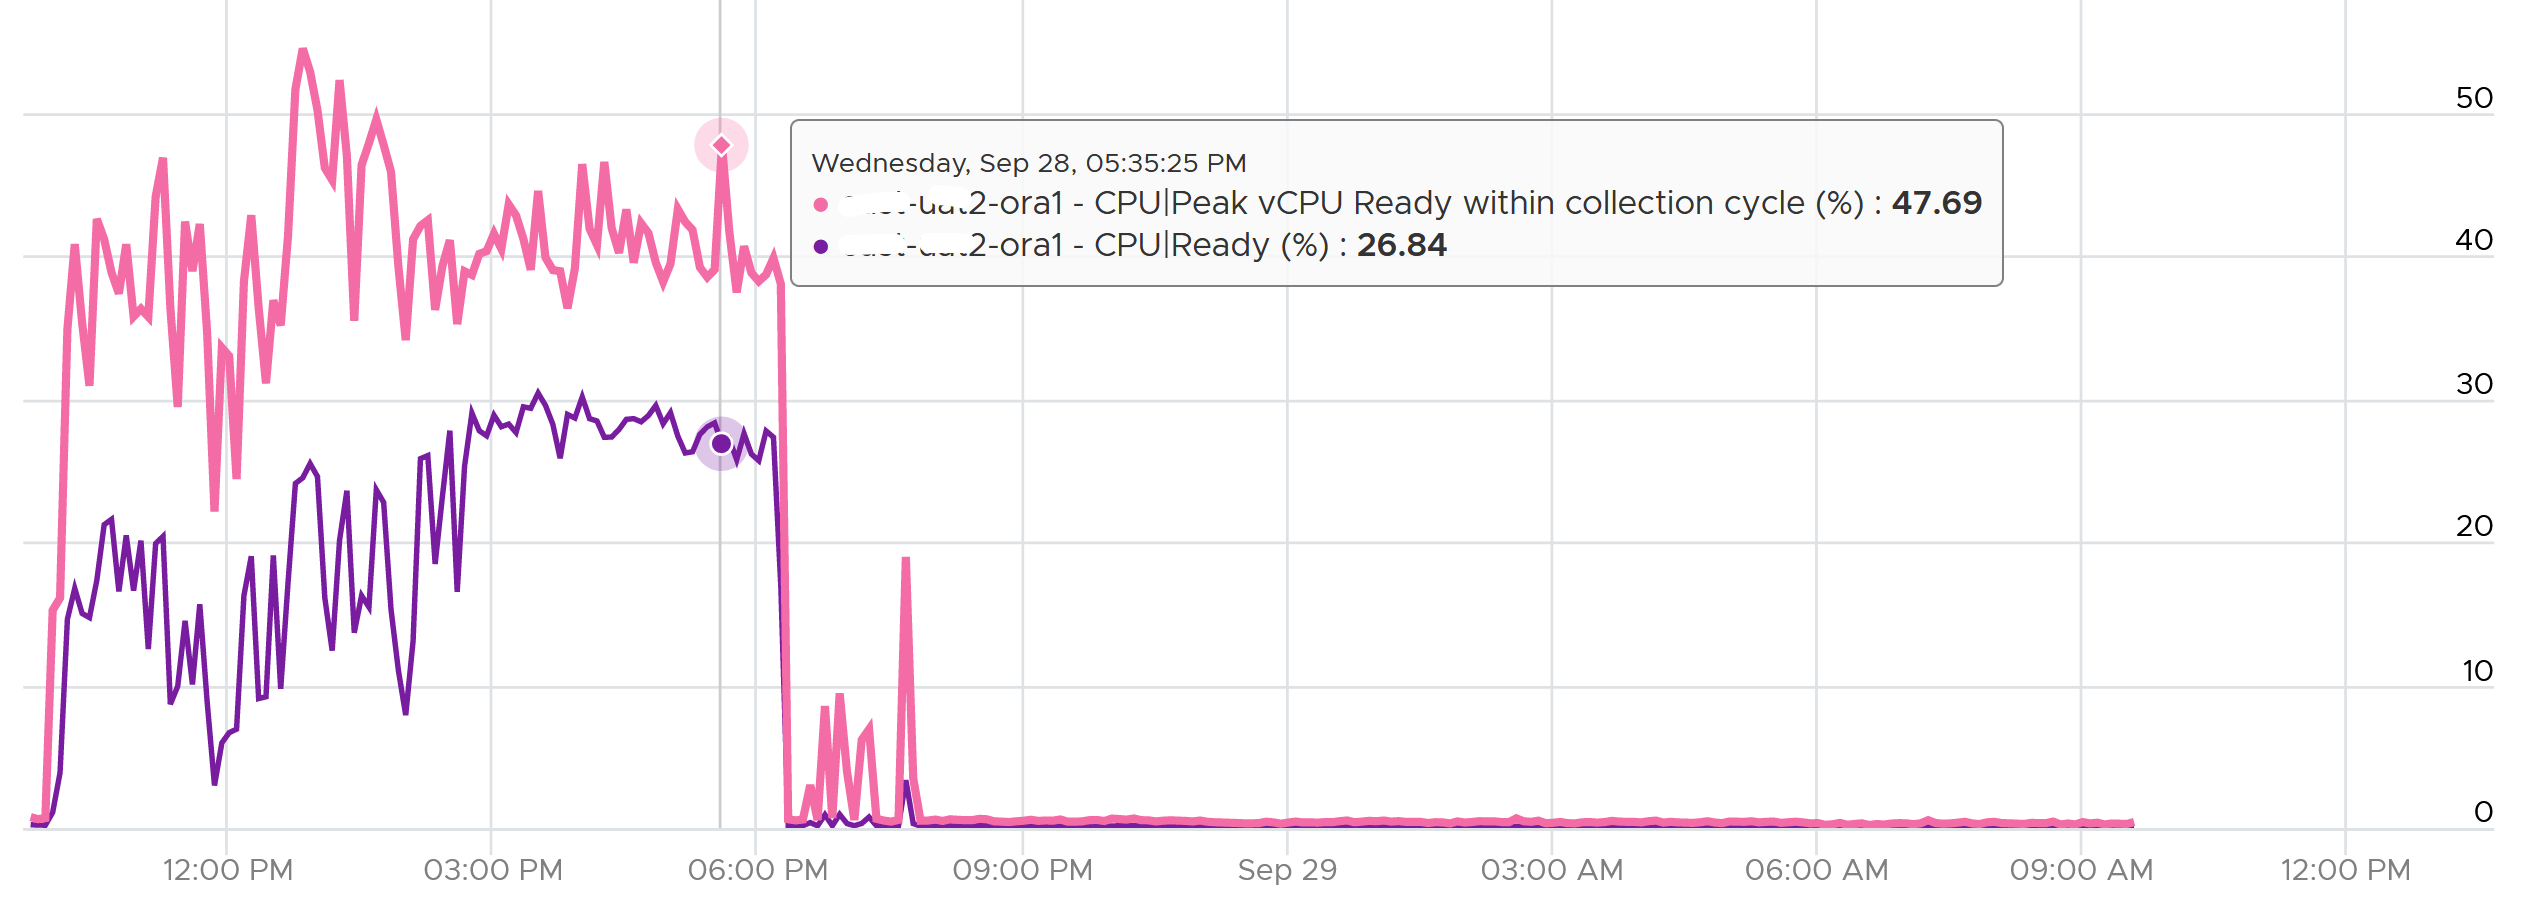
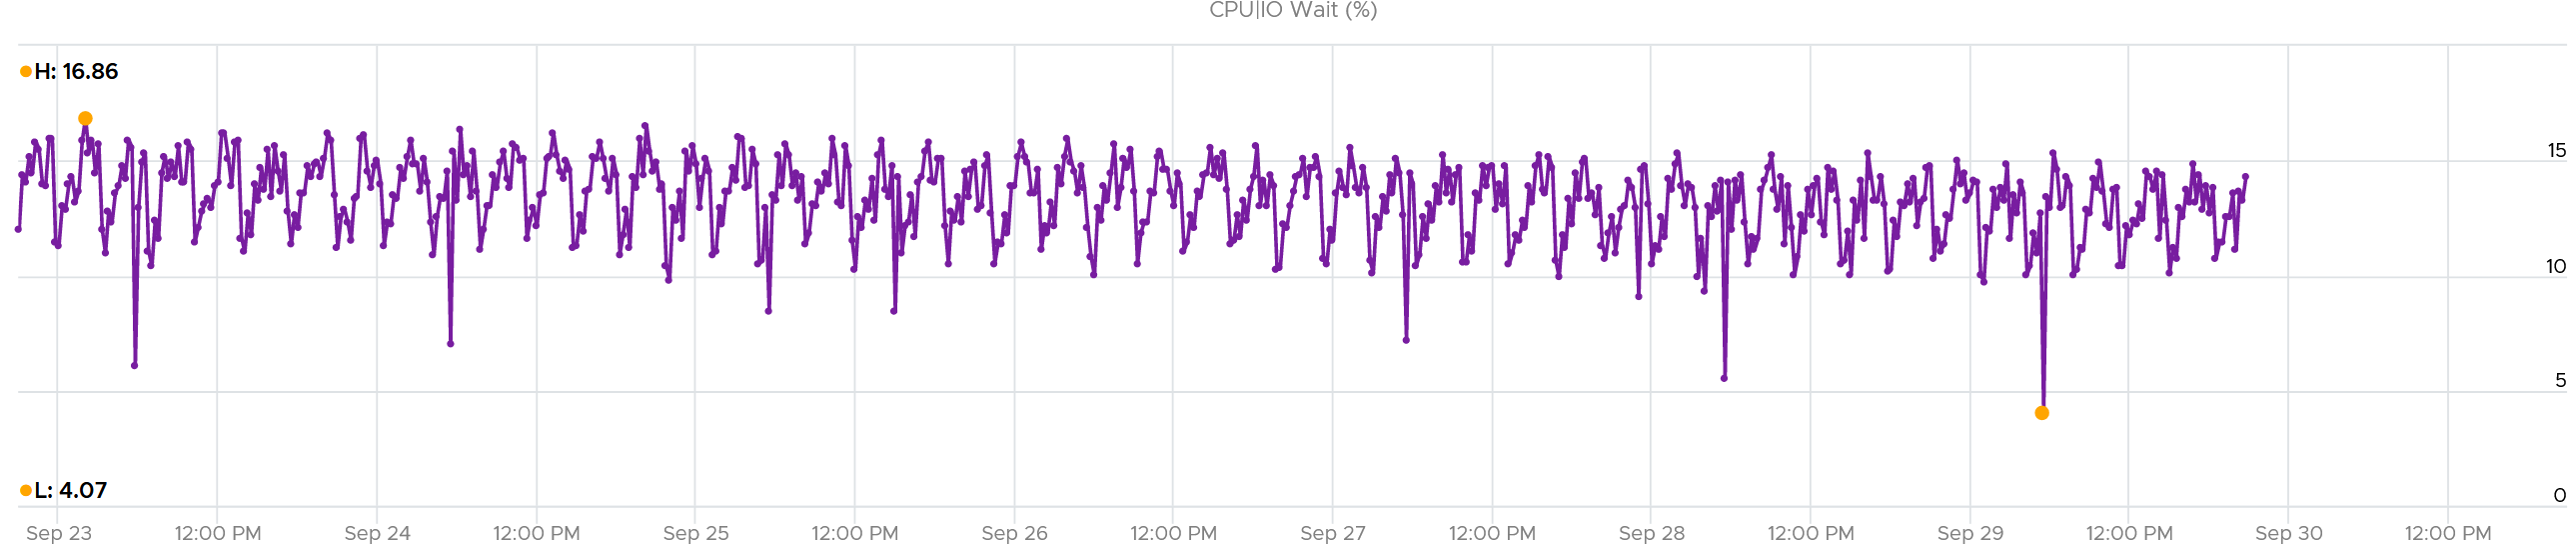
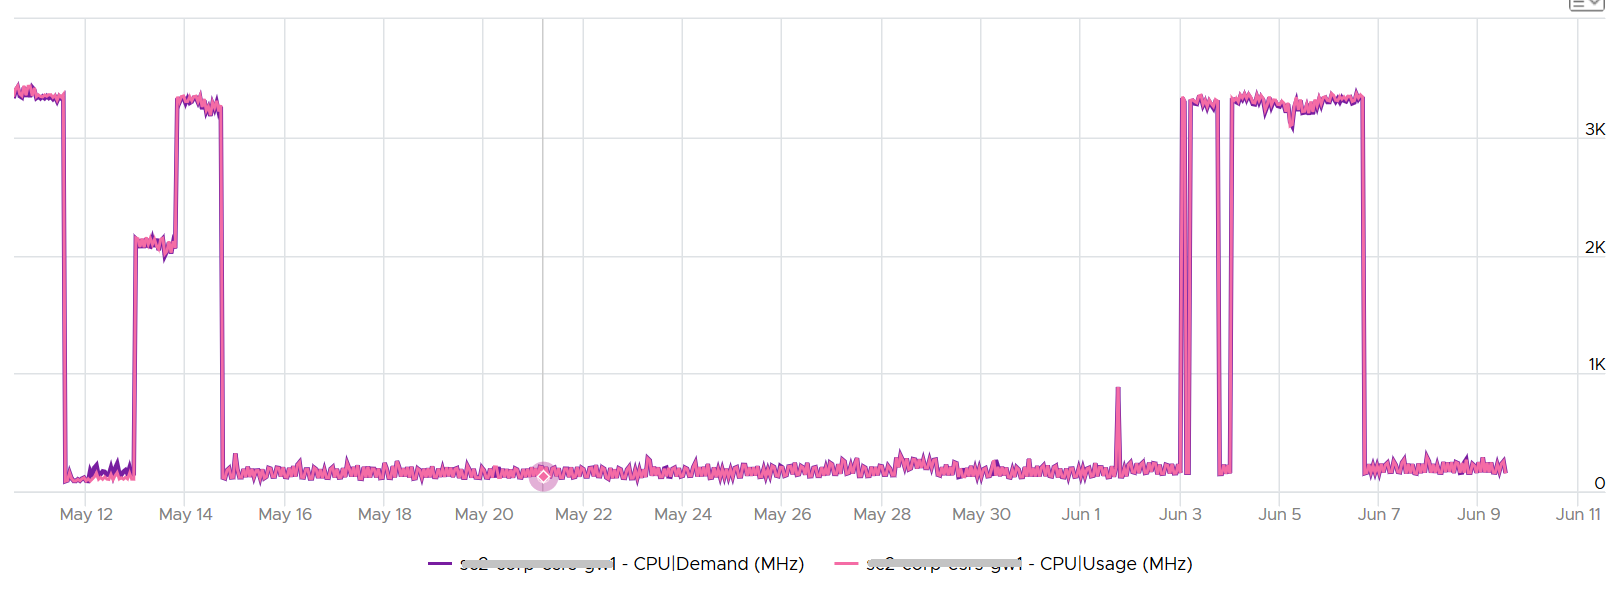
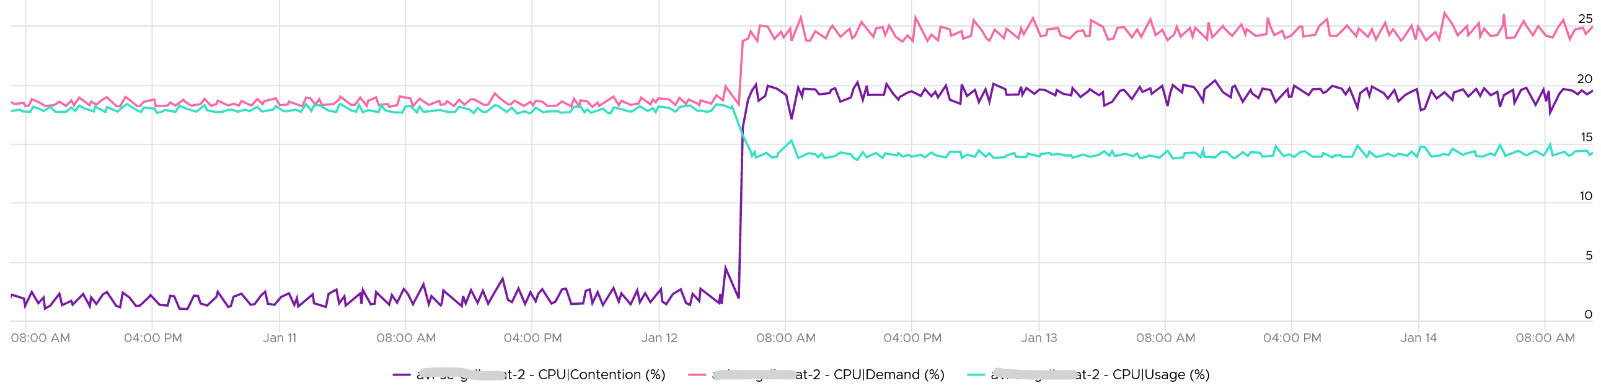
Take a look at the high spikes on CPU Ready value. It hits 40%!
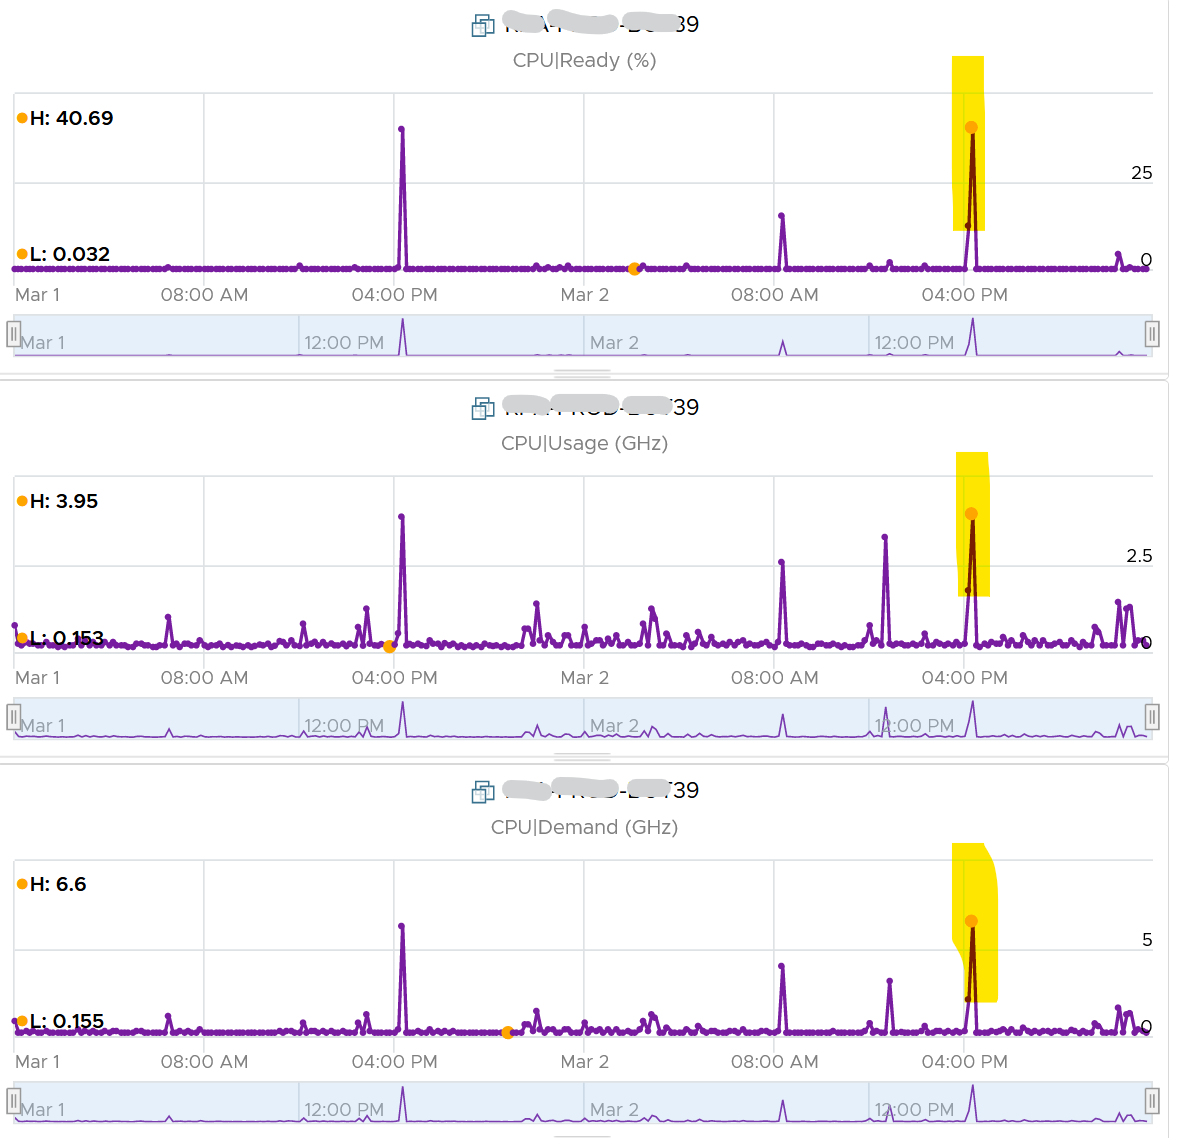
Notice the overall pattern of the line chart correlates very well with CPU Usage and CPU Demand. The CPU Usage hit 3.95 GHz but the Demand shot to 6.6 GHz. This is a 4 vCPU VM running on a 2.7 GHz CPU, so its total capacity is 10.77 GHz. Why did Usage stop at 3.95 GHz?
What’s causing it?
If your guess is Limit you are right. This VM had a limit set at 4 GHz.
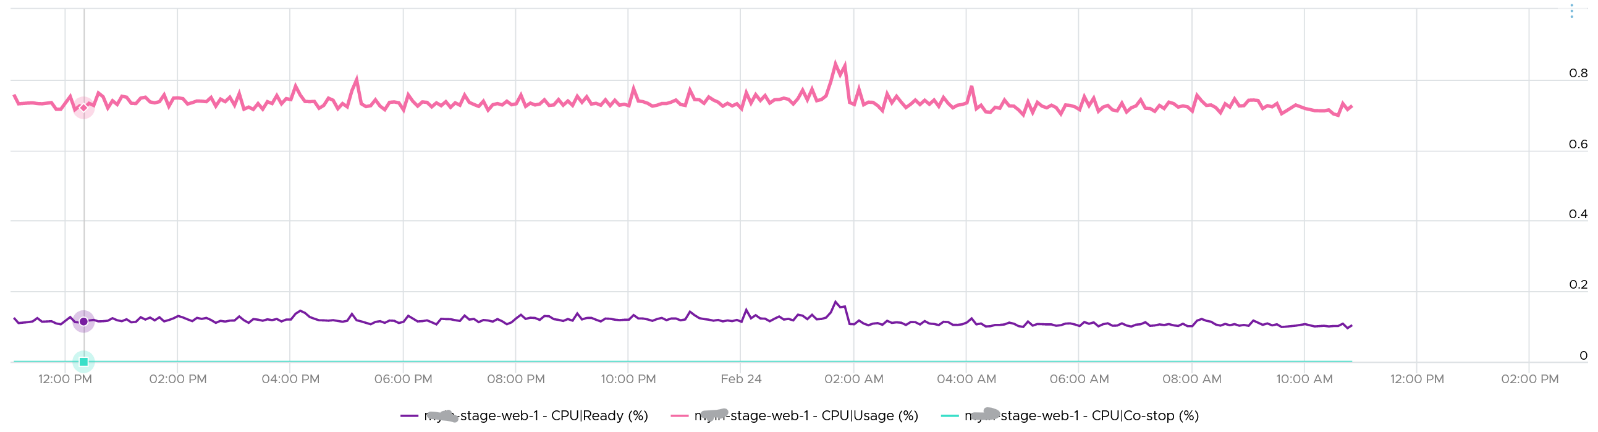
Ready also includes the CPU scheduling cost (normally completed in microseconds), hence the value is not a flat 0 on idle VM. You will notice a very small number. Ready goes down when Guest OS is continually busy, versus when a process keeps waking up and going to sleep, causing the total scheduling overhead to be higher. The following shows Ready is below 0.2% on an idle VM (running at only 0.8%). Notice Co-stop is basically flat 0.
CPU Ready tends to be higher, ceteris paribus, in larger VMs. The reason is the chance of running more vCPU at the same time is lower in a busy ESXi host.
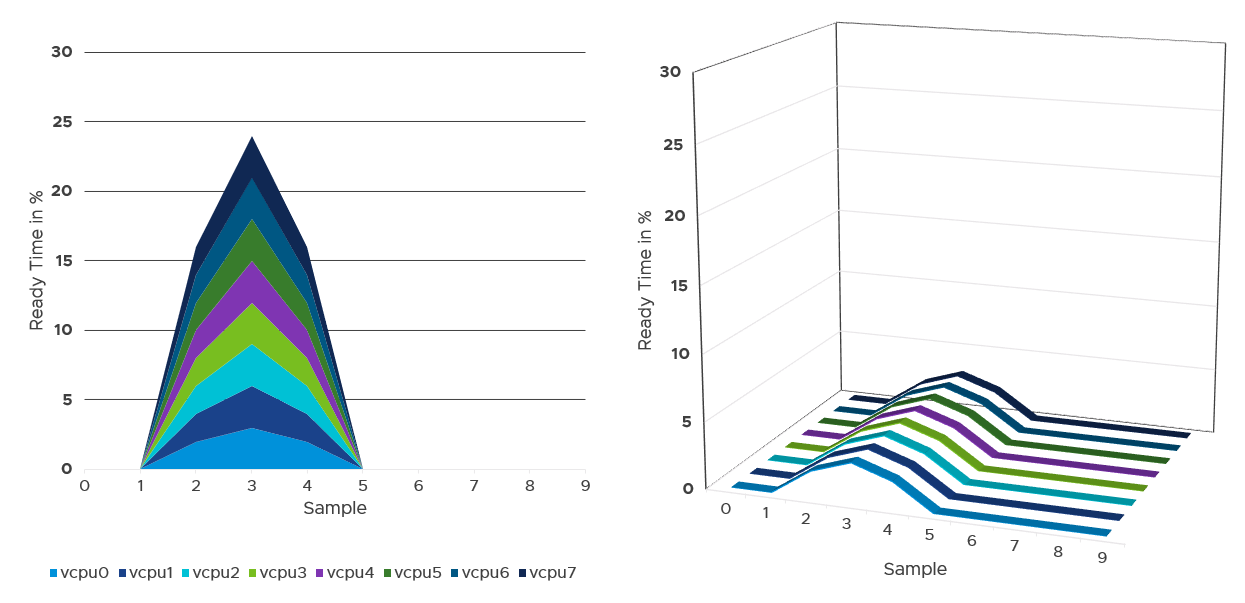
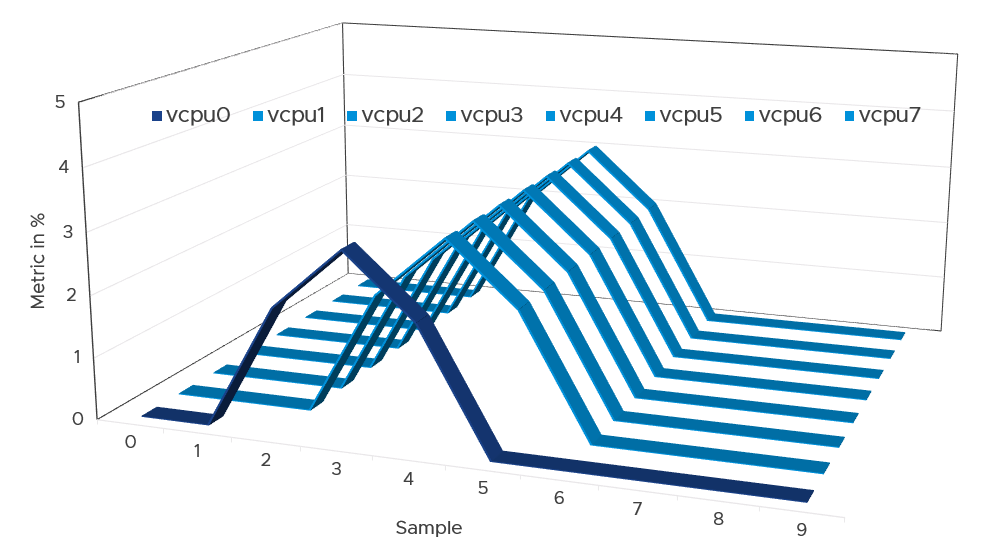
Instead of thinking of CPU ready in 2D (as shown in the first chart below), think in 3D where each vCPU moves across time. Each needs to be scheduled, and ideally they run together. The 2nd chart below shows how the 8 vCPUs move across time better[^7].
Best Practice
I sample 3937 VMs from production environment. For each of them, I took the 20-second peak and not the 5-minute peak.
Why do I take the 20-second?
Unless the performance issue is chronic, CPU Ready tends to last in seconds instead of minutes. The following is one such example.
The following shows a different behaviour. Notice initially both metrics are bad, indicating severe CPU ready. However, the gap is not even 2x. I think partly because the value is already very high. Going beyond 50% CPU Ready when CPU Usage is high will result in poor performance. This VM has 16 vCPU.
Subsequently, the performance improved, and both values became very similar and remained in a healthy range.
I collected 4 months’ worth of data, so it’s around 35K metrics per VM.
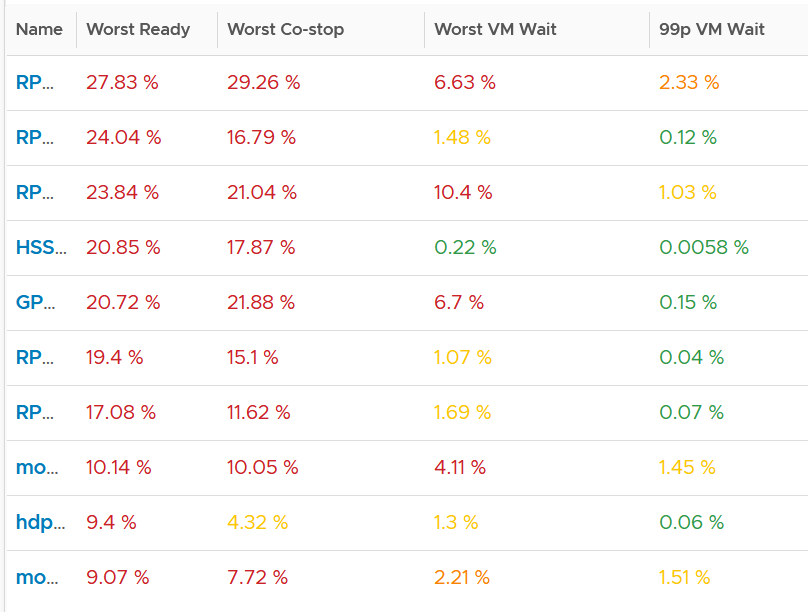
The following screenshot was my result. What do you expect to get in your environment?
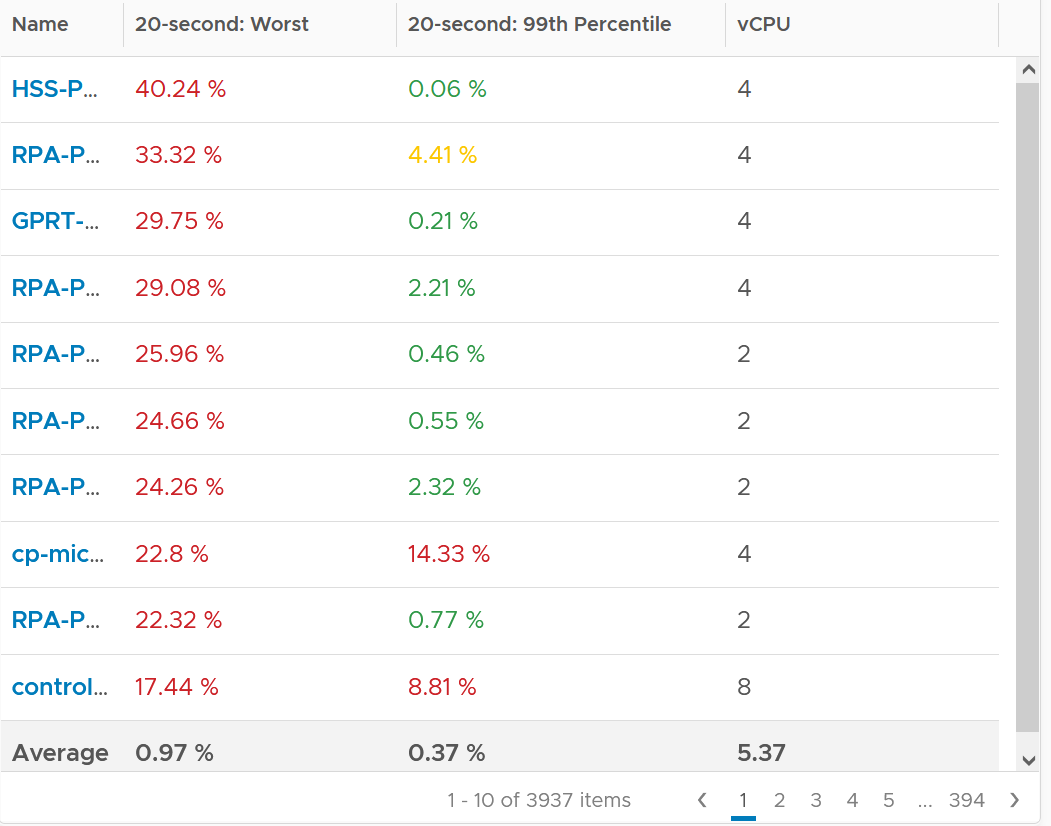
The first column takes the highest value from ~35K data points. The table is sorted by this column, so you can see the absolute worst from 35040 x 3937 = 137 million data points. Unsurprisingly, the number is bad. Going down the table, it’s also not surprising as the worst 10 are bad.
But notice the average of these “worst metrics”. It’s just 0.97%, which is a great number.
The 2nd column complements the first one. I eliminate the worst 1% of the data, then took the highest. So I took out 350 datapoints. Since VCF Operations collects every 5 minutes, that eliminates the worst 29 hours in 4 months. As you can expect, for most VMs the values improve dramatically. The 2nd column is mostly green.
Ready | Readiness
There are 2 metrics provided: Ready (ms) and Readiness (%).
I plotted both of them. They show identical pattern. This is a 4 vCPU VM, hence the total is 80000 ms.
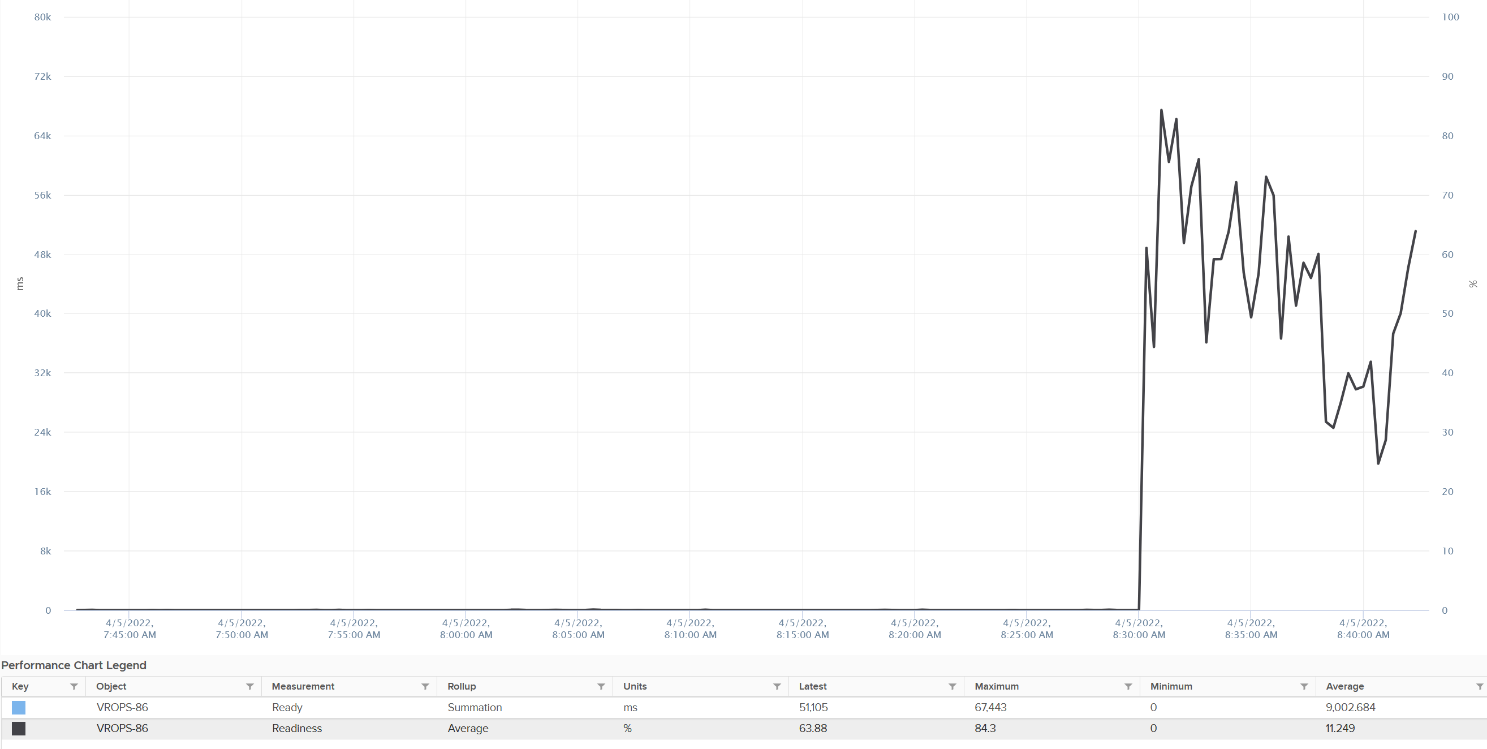
The Readiness (%) has been normalized, taking into account the number of vCPU. Notice 80000 ms matches with 100%. If it is not normalized, you will see 80000 as 400%.
Co-stop
Co-stop is a different state than Ready because the cause is different. The effect to the VM is the same. A pause is a pause. The Guest OS is unaware of the cause and experience the same contention.
Co-stop only happens on Simultaneous Multi Processor (SMP) VMs. SMP means that the OS kernel executes parallel threads. This means Co-stop does not apply to 1 vCPU VMs, as there is only 1 active process at any given time. It is always 0 on single vCPU VM.
In a VM with multiple vCPUs, ESXi kernel is intelligent enough to run some of the VM vCPUs when it does not have all physical threads to satisfy all the vCPU. At some point, it needs to stop the running vCPU, as it’s too far ahead of its sibling vCPU (which it cannot serve, meaning they were in ready state). This prevents the Guest OS from crashing. The Co-stop metrics track the time when the vCPU is paused due to this reason. This explains why Co-stop tends to be higher on a VM with more vCPUs.
Say one vCPU is in ready state. The remaining vCPU will eventually be co-stopped, until all the vCPUs are co-started. The following diagram show vCPU 0 hit a ready state first. Subsequently, the remaining 7 vCPU hit a co-stop, even though there were actually physical thread to run them.
One reason for Co-stop is snapshot. Refer to this KB article for details.
Best Practice
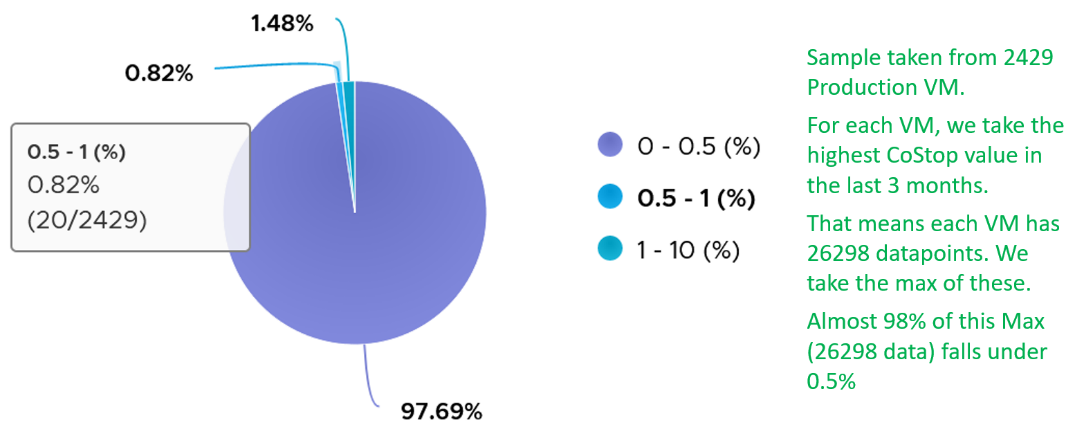
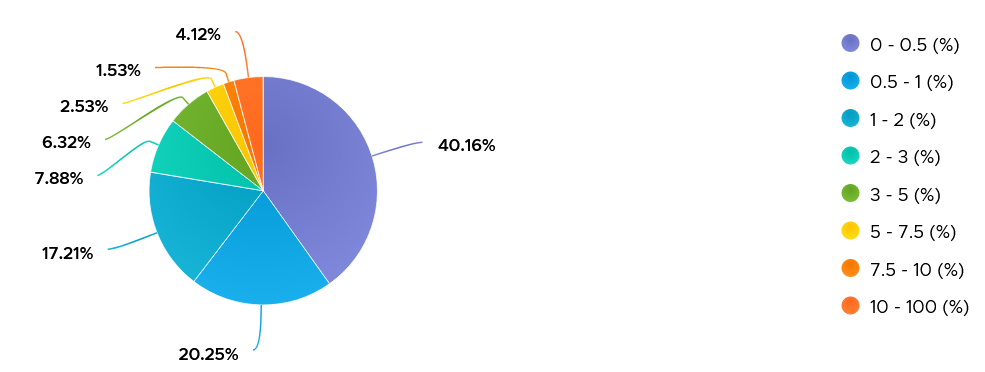
The value of Co-stop should be <1% in high performing environment. This is based on 64 million datapoints, as shown on the following pie chart.
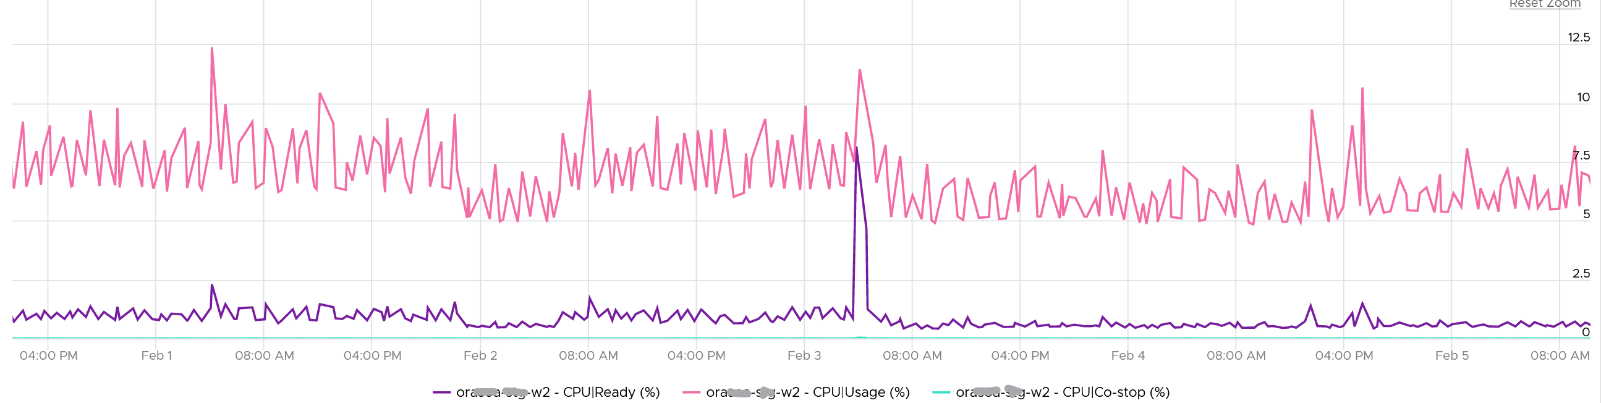
The value of Co-stop tends to be smaller than Ready, as shown below. Ready and Co-stop may or may not corelate with Usage. In the following chart you can see both the correlation and lack of correlation.
Overlap
When ESXi is running a VM, this activity might get interrupted with IO processing (e.g. incoming network packets). If there is no other available cores in ESXi, the kernel has to schedule the work on a busy core. If that core happens to be running VM, the work on that VM is interrupted. The counter Overlap accounts for this, hence it’s useful metric just like Ready and Co-stop counter.
The interrupt is to run a system service, and it could be on behalf of the interrupted VM itself or other VM.
Notice the word system services, a process that is part of the kernel. This means it is not for non-system services, such as vCPU world. That’s why the value in general is lower than CPU Ready or even Co-Stop. The value is generally affected by disk or network IO.
Some documentation in VMware may refer to Overlap as Stolen. Linux Guest OS tracks this as Stolen time.
When a vCPU in a VM was interrupted, the vCPU Run counter is unaware of this and continues tracking. To the Guest OS, it experiences freeze. Time stops for this vCPU, as everything is paused. The clock on motherboard does not tick for this vCPU. Used and Demand do account for this interruption, making them useful in accounting the actual demand on the hypervisor. When the VM runs again, the Guest OS experiences a time jump.
Review the following charts. It shows CPU Usage, CPU Overlap and CPU Run. See the green highlights and yellow highlights. What do you notice?
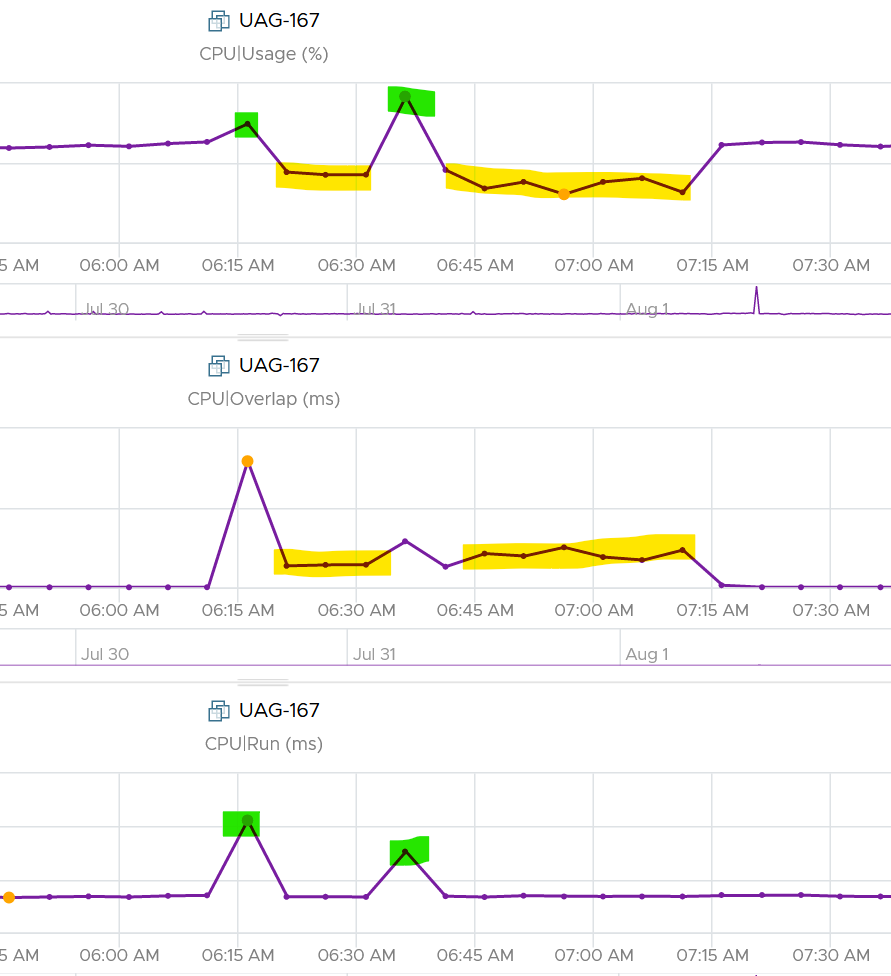
The above prove that Run is not aware of overlap. Notice when overlap went up, Run did not go lower. CPU Usage however, did go down as it’s aware of overlap.
The correlation is not perfect as Usage is also aware of hyperthreading and CPU frequency.
The Overlap counter is useful to troubleshoot performance problem, complementing Ready, Co-stop, Other Wait and Swap Wait. Ready does not include Overlap as the VM remains on the Run State (see the CPU State Diagram).
The unit is millisecond, and it’s the summation of the entire 20 seconds. VCF Operations averages over 300 seconds. So the amount at 300 seconds is max 20000 (this is 100%), and must be multiplied by 15 if we want to see the actual average in the 300 second period.
The amount is the sum of all vCPU, so you need to divide by the number of running vCPU if you are converting into a percentage. Divide over 20000 ms x 100%. When I did that, and plot the highest 5 among ~3K production VMs, I get this.
| Overlap (ms) | vCPU | Overlap (%) |
|--------------|------|-------------|
| 6,169 | 30 | 1.03% |
| 284 | 2 | 0.71% |
| 509 | 4 | 0.64% |
| 484 | 4 | 0.61% |
| 237 | 2 | 0.59% |
The above indicates the VMs only experienced minimal interruption by the kernel.
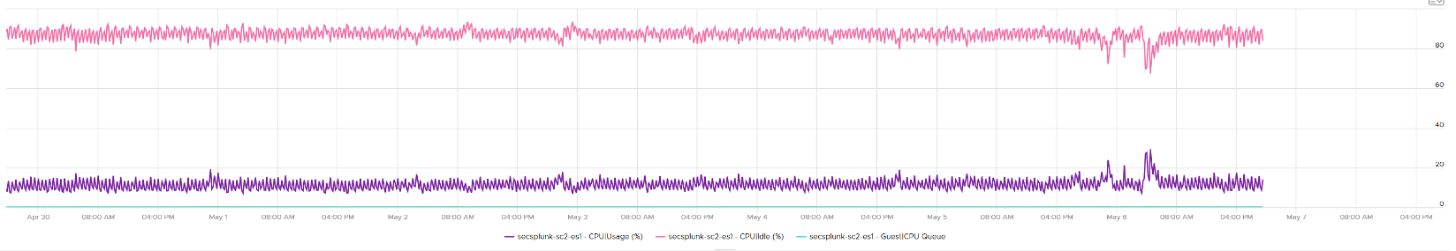
Let’s dive into a single VM. The following is a 68 vCPU VM running Splunk. In the last 7 days, it experienced a low but sizeable CPU overlap. 10K is relatively low for a 68 vCPU VM, but it still represents half a vCPU worth of interruption.
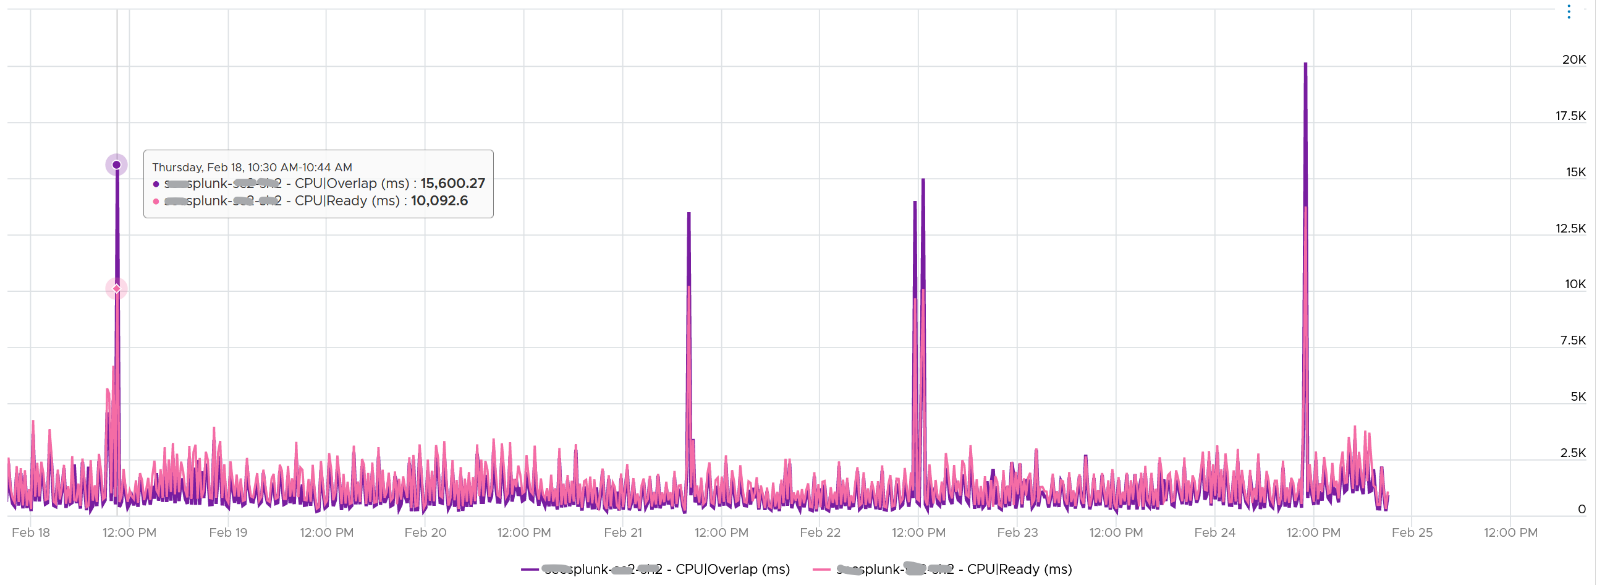
Overlap should be included in Guest OS sizing as the Guest OS wants to run actually. The effect is the same with an unmet Demand.
A high overlap indicates the ESXi host is doing heavy IO (Storage or Network). Look at your NSX Edge clusters, and you will see the host has relatively higher Overlap value versus non IO-intensive VM.
Contention
This is a value add by Aria Operations in July 2024. Before that, it’s mapped to the CPU Latency metric.
The formula is.
Contention (%) = Overlap + CoStop + Ready + Other Wait (if less than 1%)
Contention means the vCPU is not getting the CPU time. Using this logic, the CPU frequency is not even applicable as the vCPU is not even running.
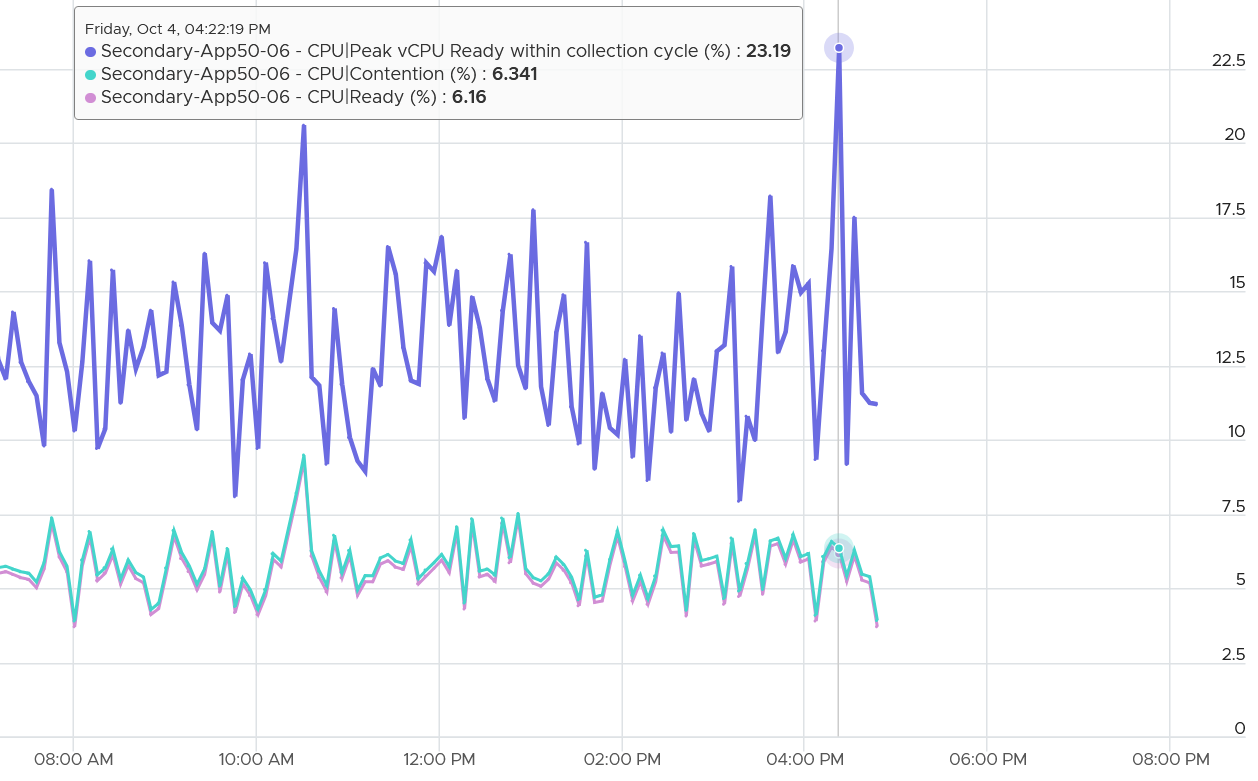
In most situations, the value will be mostly coming from CPU Ready. The following screenshot shows the CPU Contention is basically identical to CPU Ready
Why does the counter include Ready by Limit?
Because we need to separate the what and the why. The fact is the VM faces contention. Whether that is because of VM Limit, insufficient VM Shares, or high ESXi utilization is a different issue.
What is the limitation for including Ready by Limit?
You cannot use the counter to define ESXi or cluster performance. The limit has nothing to do with the cluster.
Latency
CPU Latency tracks the “stolen time”, which measures the CPU cycle that could have been given to the VM in ideal scenario. It maps to %LAT_C counter in esxtop.
The diagram[^8] shows what it includes. Latency excludes Max Limited in Ready, but it includes Co-stop even if the Co-stop was the result of Limit. It also excludes Other Wait.
Notice that HT and CPU Frequency are effect and not metrics. You can see the impact of CPU Frequency in esxtop %A/MPERF counter.
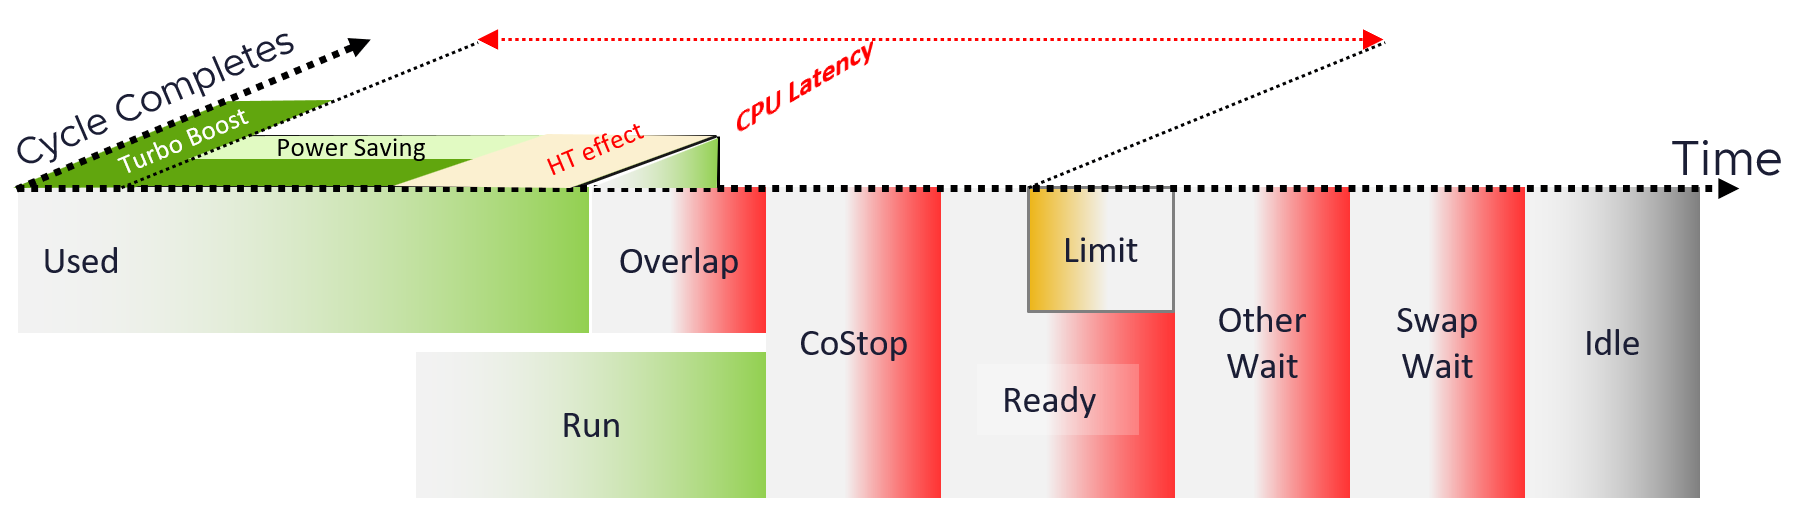
Latency also includes 37.5% impact from Hyper Threading. In ESXi CPU accounting, Hyper Threading is recorded as giving 1.25x throughput, regardless of actual outcome. That means when both threads are running, each thread is recorded as only getting 62.5%. This will increase the CPU Latency value to 37.5%. All else being equal, VM CPU Contention will be 37.5% when the other HT is running. This is done so Used + Latency = 100%, as Used will report 62.5% when the vCPU has a competing thread running.
In the above scenario, what’s the value of CPU Ready?
Yup, it’s 0%.
CPU Latency also accounts for power management. When the clock speed falls below nominal frequency, CPU Latency goes up accordingly.
Because of these 2 factors, its value is more volatile, making it less suitable as a formal Performance SLA. Use CPU Ready for Performance SLA, and CPU Contention for performance troubleshooting.
The following table only shows 5 VM out of 2500 that I analyzed. These 2 metrics do not have good correlation, as they are created for different purpose.
In many cases, the impact of both threads running is not felt by the application running on each thread. If you use CPU Latency as formal SLA, you may be spending time troubleshooting when the business does not even notice the performance degradation.
The following screenshot shows CPU Latency went down when both Ready and Co-stop went up.
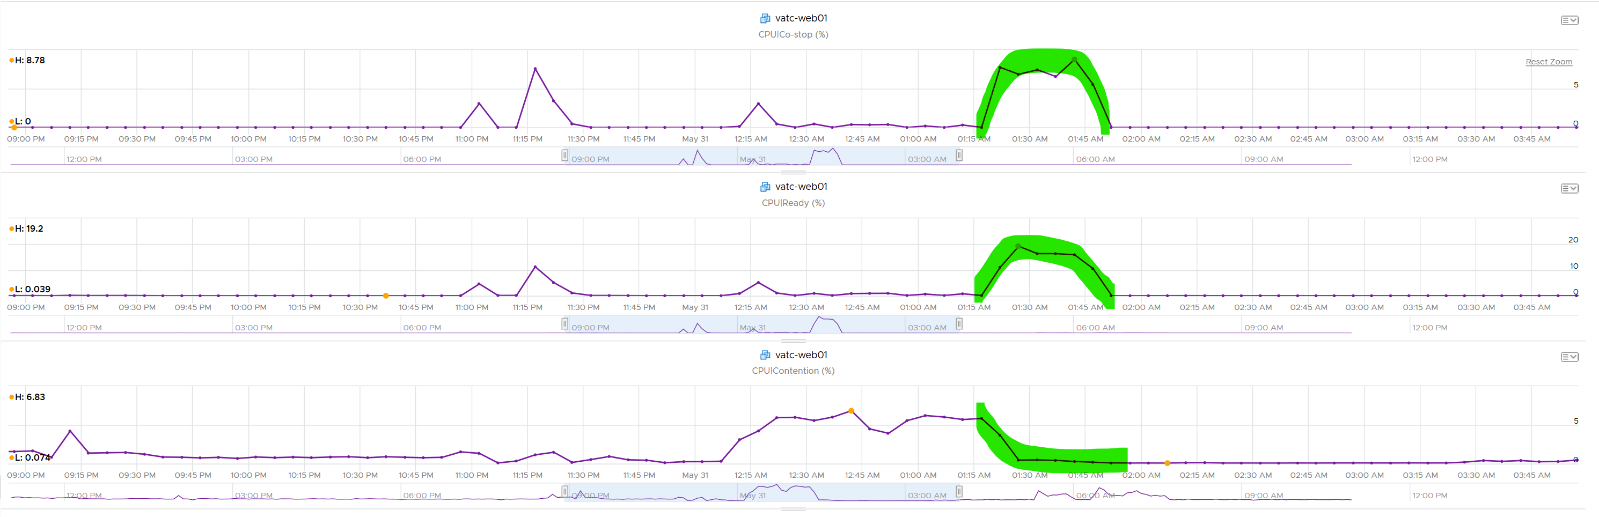
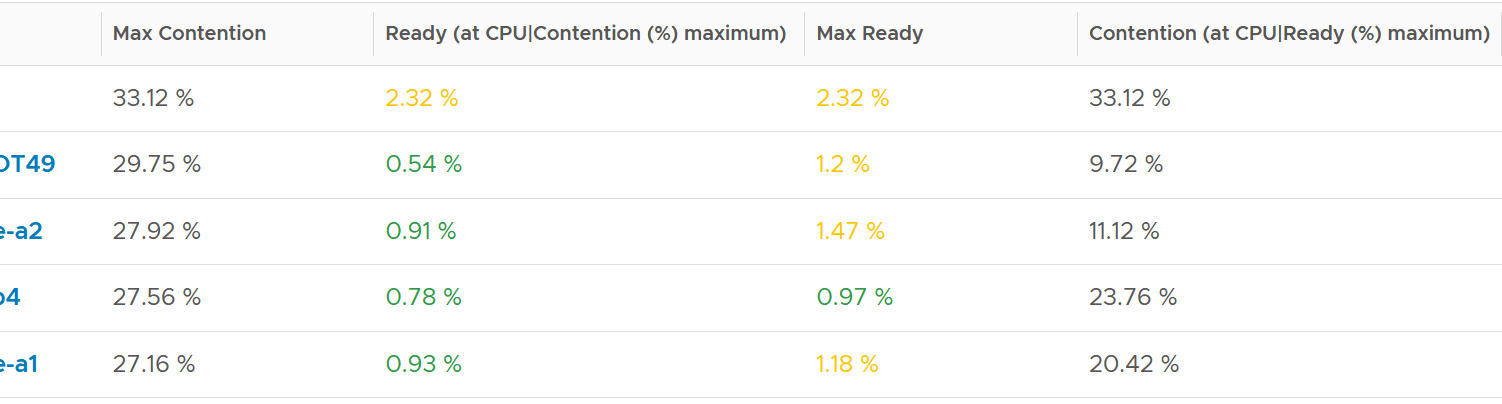
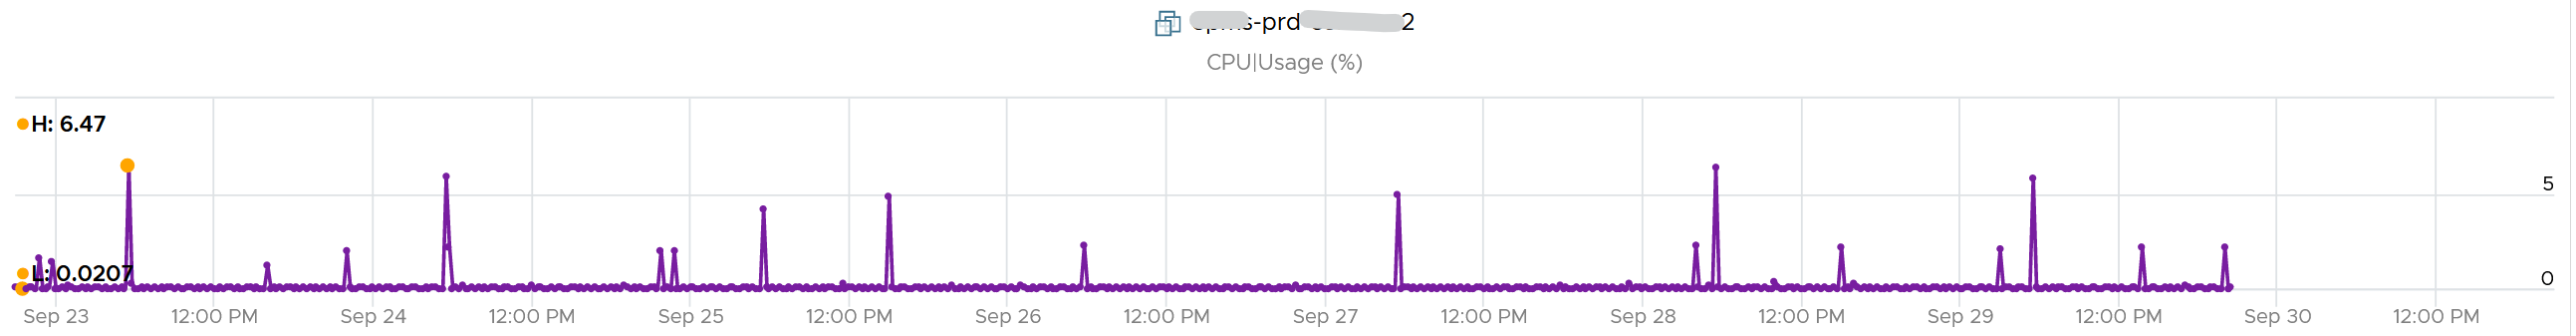
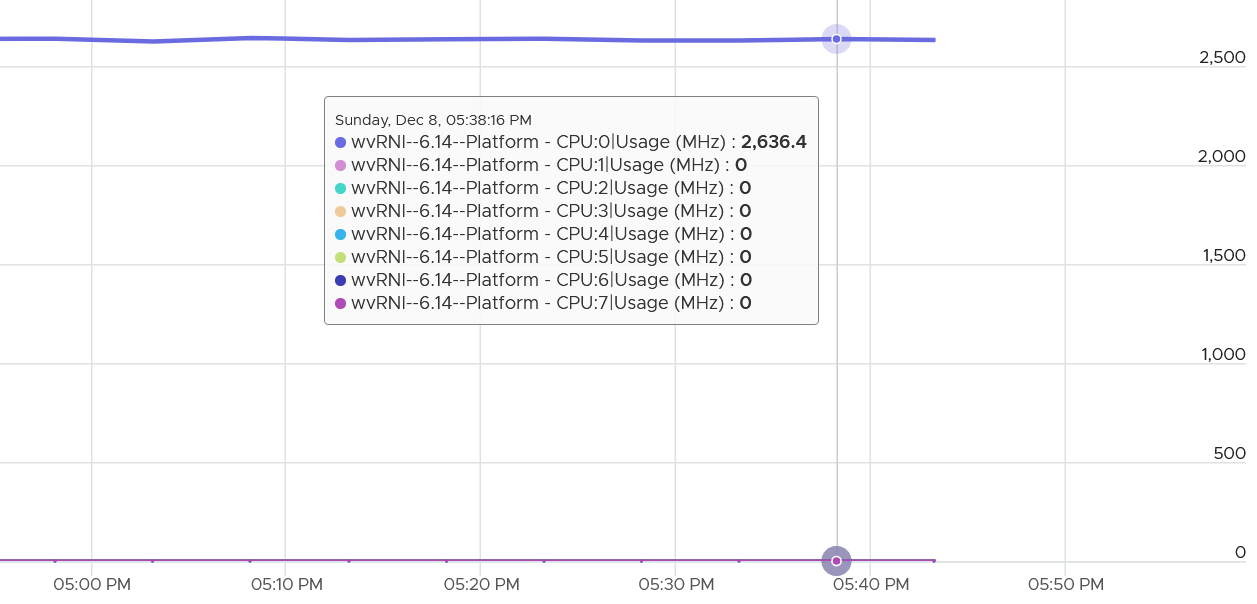
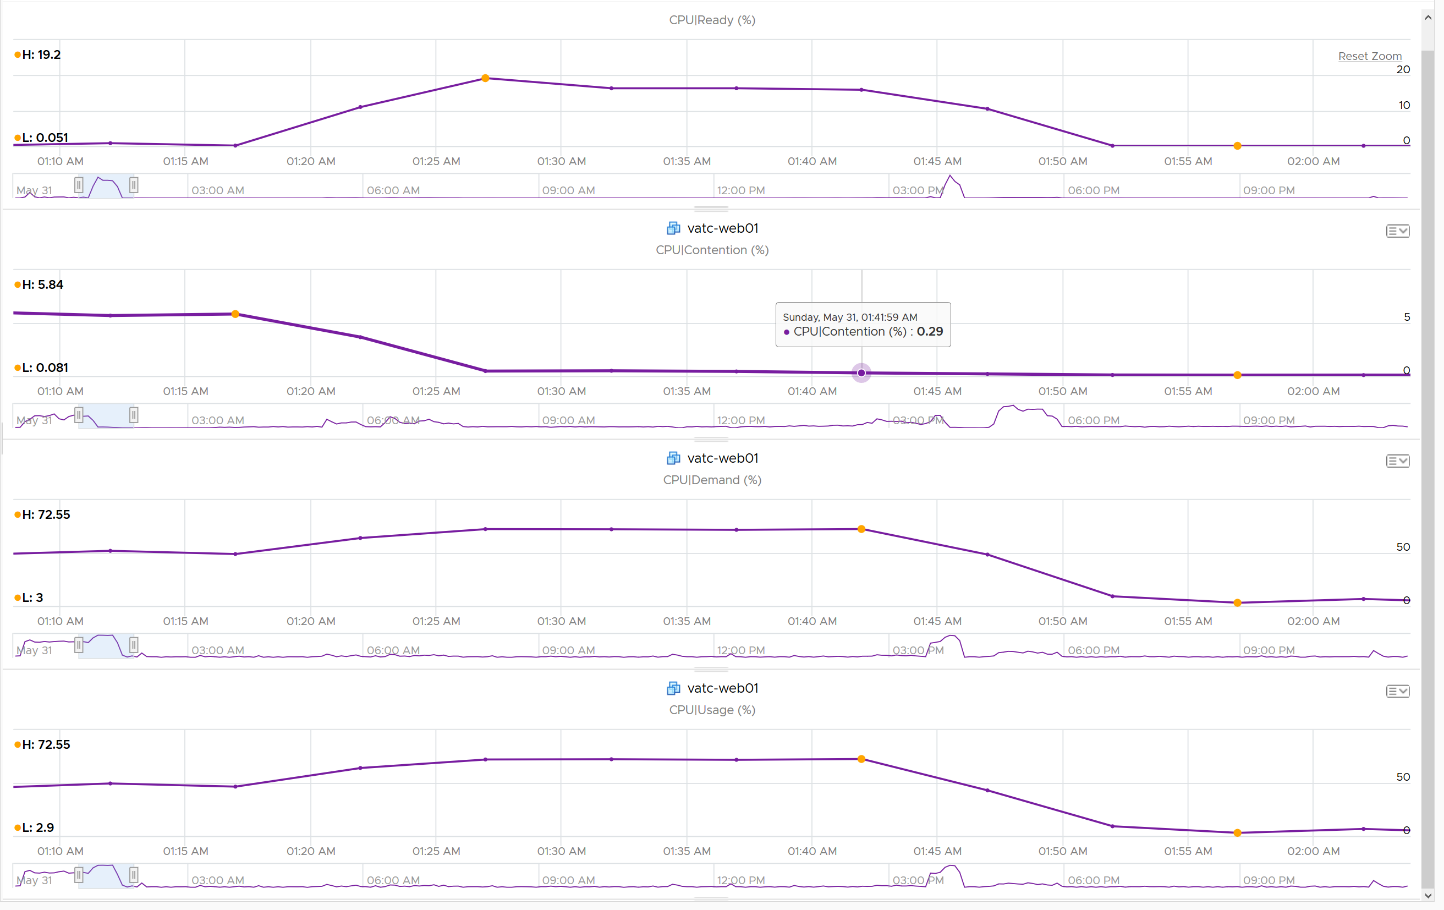
How about another scenario, where Latency is near 0% but Ready is very high? Take a look at this web server. Both CPU Demand and CPU Usage are similar identical. At around 1:40 am mark, both Demand and Usage showed 72.55%, Contention at 0.29%, but Ready at above 15%. What’s causing it?
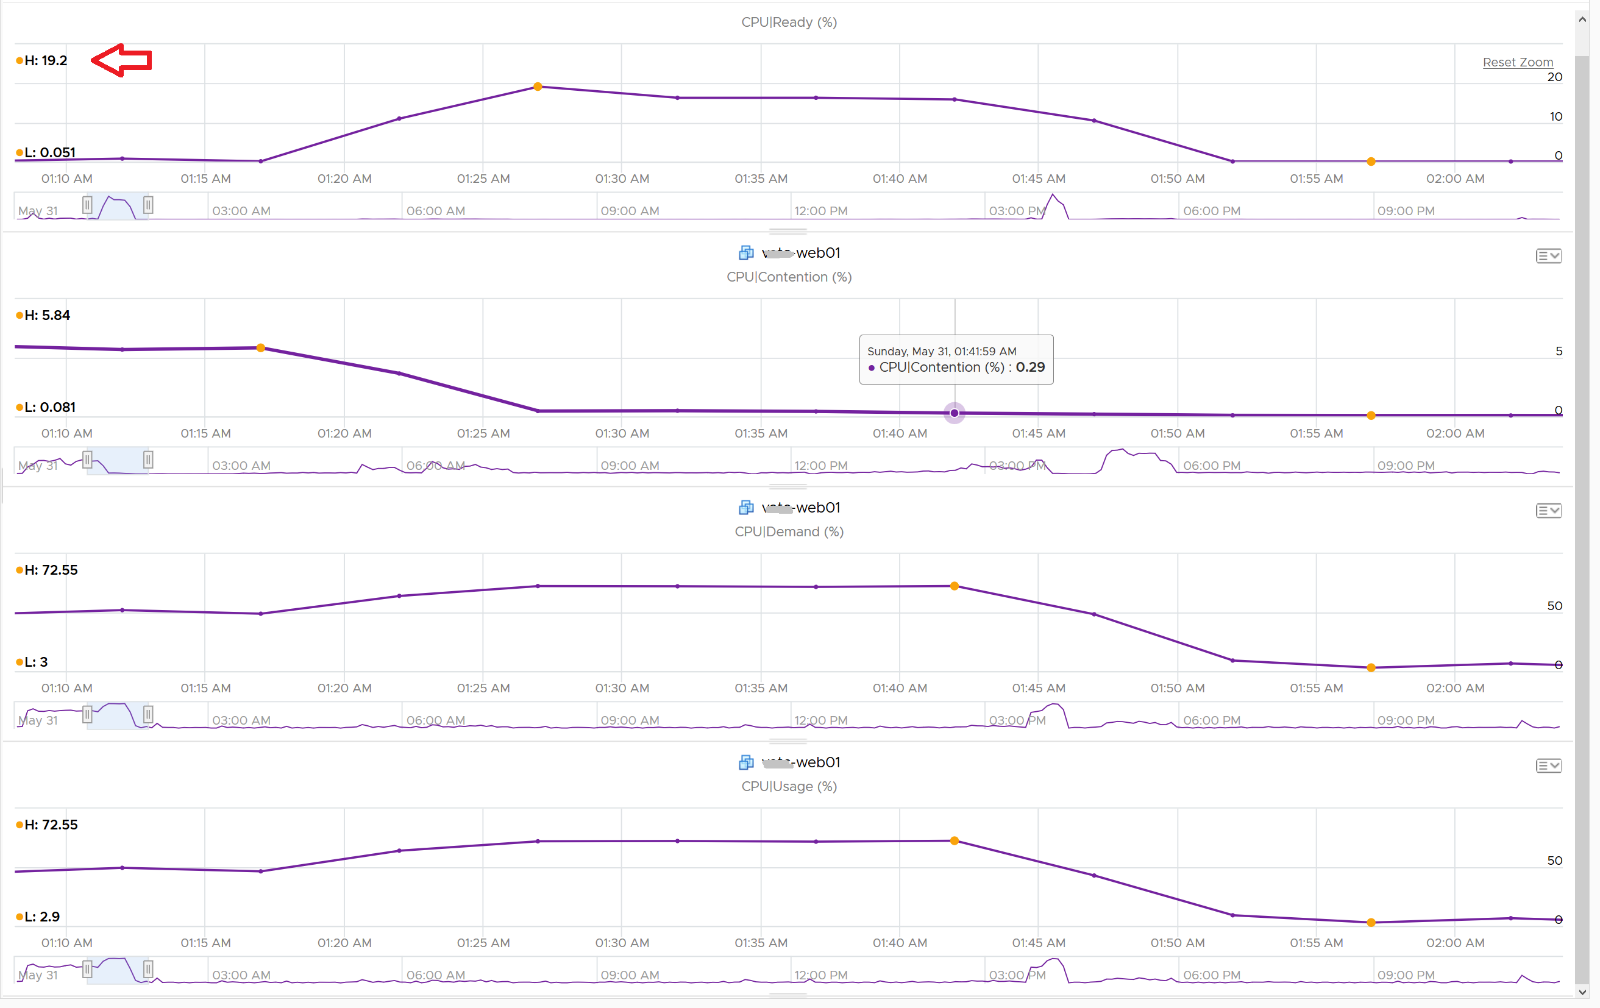
The answer is Limit. Unlike CPU Ready, it does not account for Limit (Max Limited) because that’s an intentional constraint placed upon the VM. The VM is not contending with other VMs. VMware Cloud Director sets limit on VM so this counter will not be appropriate if you aim to track VM performance using Contention (%) metric.
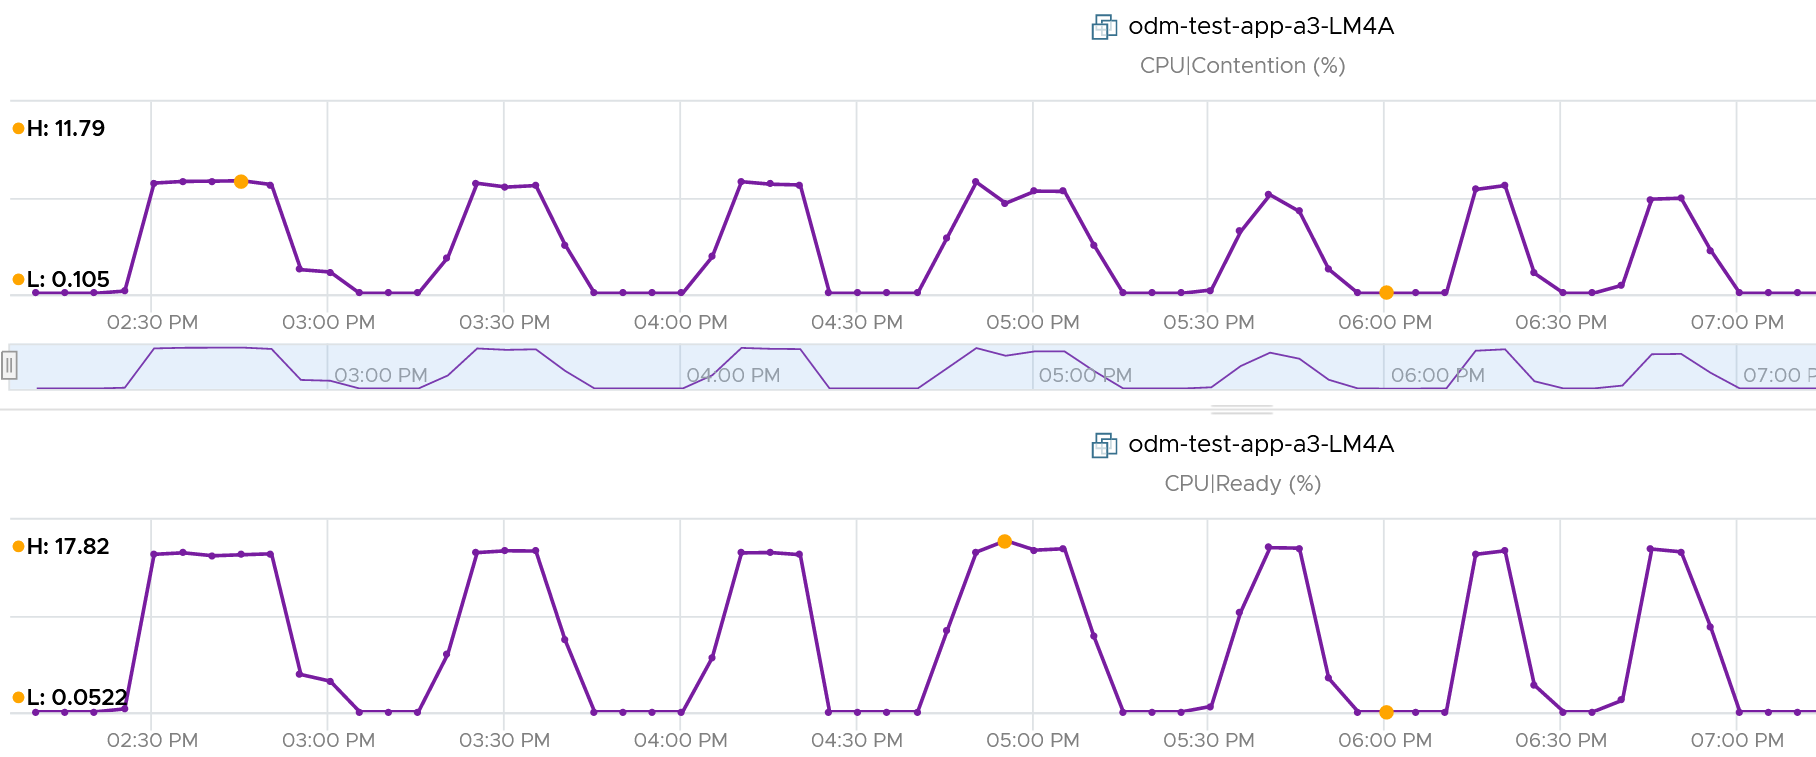
Here is a clearer example showing latency consistently lower than Ready due to limit.
A better and more stable metric to track the contention that a VM experience is Ready + Co-stop + Overlap + VM Wait + Swap Wait. Note that the raw metric for all these are millisecond, not GHz.
Where do you use CPU Contention then?
Performance troubleshooting for CPU-sensitive VM.
If the value is low, then you don’t need to check CPU Ready, Co-stop, Power Management and CPU overcommit. The reason is they are all accounted for in CPU Contention.
If the value is high ( > 37.5%), then follow these steps:
-
Check CPU Run Queue, CPU Context Switch, “Guest OS CPU Usage“, CPU Ready and CPU Co-stop. Ensure all the CPU metrics are good. If they are all low, then it’s Frequency Scaling and HT. If they are not low, check VM CPU Limit and CPU Share.
-
Check ESXi power management. If they are set to Maximum correctly, then Frequency Scaling is out (you are left with HT as the factor), else HT could be at play. A simple solution for applications who are sensitive to frequency scaling is to set power management to max.
-
Check CPU Overcommit at the time of issue. If there is more vCPU than pCore on that ESXi, then HT could be impacting, else HT not impacting. IMHO, it is rare that an application does not tolerate HT as it’s transparent to it. Simplistically speaking, while HT reduces the CPU time by 37.5%, a CPU that is 37.5% faster will logically make up for it.
There is a corner case accounting issue in %LAT_C that was resolved in ESXi 6.7[^9]. VMs with Latency Sensitive = High on ESXi 6.5 or older, will show any “guest idle” time of vCPUs as LAT_C, for those VMs the counter should not be relied on. This is a corner case because majority of VM should not be set with this, as it impacts performance of other VMs.
Wait Metrics
I put the wait metrics separately as it includes both the contention and consumption type of metrics.
CPU is the fastest component among infrastructure resources, so there are times it must wait for data. The data comes from memory, disk or network.
There are also times when there is nothing to do, so the CPU is idle. The hypervisor did schedule the VM vCPU to run, but there was nothing to run. Whether the upper layer (Guest OS vCPU) is truly idle or blocked by pending IO, the kernel does not have the visibility. It can only see that Windows or Linux is not doing any work.
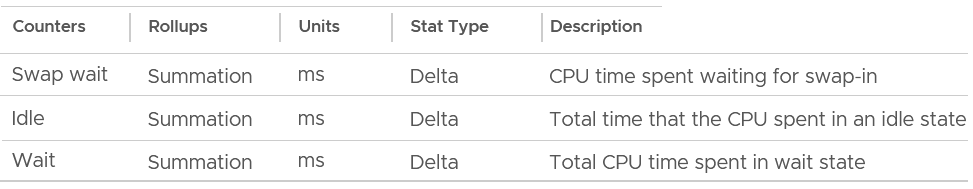
There are 3 sub-metrics that make up Wait.
-
Idle. Waiting for work.
-
Swap Wait. Waiting for memory.
-
Other Wait. Waiting for other things.
Guest OS isn’t aware of both Other Wait and Swap Wait. Just like other type of contention, it experiences freeze. The time it spends under Other Wait and Swap Wait should be included in the Guest OS CPU sizing formula as the VM wants to run actually.
| Idle | It tracks when VM is not running. Regardless of the reason in the upper-layer, VM Idle should not be included in both VM sizing, and definitely not in Guest OS sizing. The reason is the vCPU is not running and you can’t predict what the usage would be. You should address the IO and memory bottleneck in Guest OS level, using Windows and Linus metrics. |
|----|----|
| Swap Wait | It tracks the time CPU is waiting for Memory page to come in from ESXi swap. Adding more RAM or faster RAM may result in lower CPU Wait, hence higher CPU Run. This metric was superseded by Memory Contention metric. |
Other Wait
It tracks the time CPU is being blocked by things other than memory. This can be disk IO, network IO, or vMotion. For example, the VMM layer is trying to do something and it’s blocked. The number of reasons vary and it’s hard to pinpoint exactly which one, as you need low level debug logs such as stats vmx, schedtraces, and custom vprobes. You’re better off removing the common reasons. Snapshot is a common reason here[^10], that it was mistakenly named as IO Wait.
The formula is:
Other Wait = Wait – Idle – Swap Wait
The above is a formula at VCF Operations.
Actions you can do to reduce Other Wait:
-
vMotion the VM.
-
Remove Snapshot
-
Update to the latest build of ESXi (incl. physical device drivers), virtual HW and VMware Tools (virtual device drivers).
If this happens to multiple VMs, find commonality. If the above is not helping in your case, file a Support Request with VMware GSS and tag me. Please mention that you get it from here, so I have a context.
I plotted Other Wait for 4000 production VMs. Surprisingly, the value is not low.
I was curious if the value corelates with CPU Ready or Co-stop. From around 4000 production VM in the last 1 month, the answer is a no.
Since snapshot is another potential culprit, let’s compare with disk latency and outstanding IO.
What do you expect?
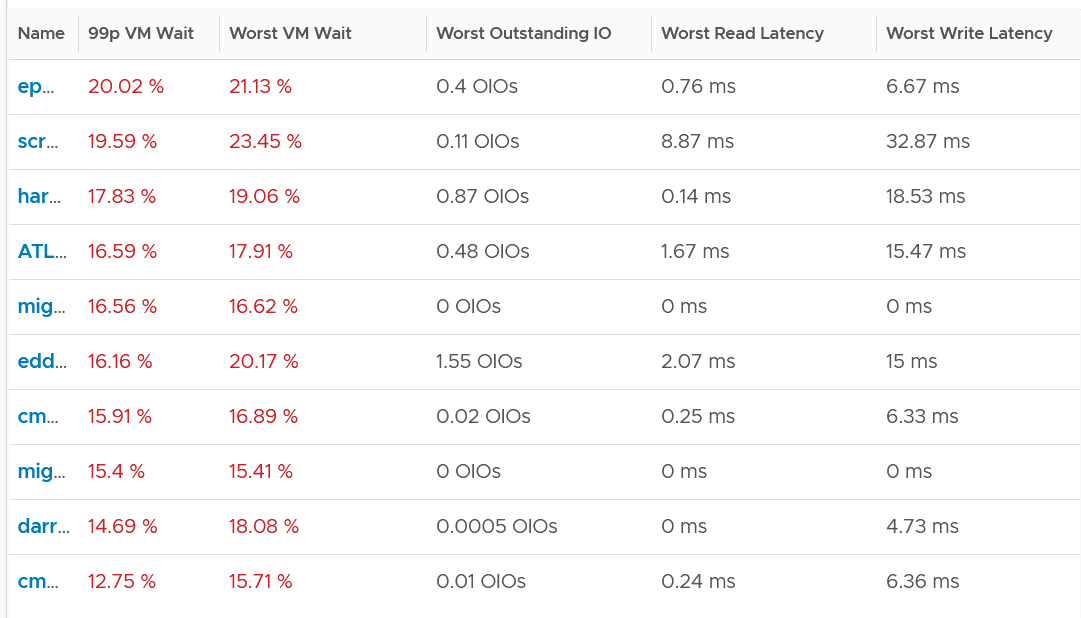
Again, negative corelation. None of the VMs with high VM Wait is experiencing latency. Notice I put a 99th percentile, as I wanted to rule out a one-time outlier. I’m plotting the first VM as the value at 99th is very near to the max, indicating sustained problem.
It turned out to be true. It has sustained VM Wait value around 15% (above is zoomed into 1 week so you can see the pattern).
I’m curious why it’s so high. First thing is to plot utilization. I checked Run, Usage and Demand. They are all low.
Using VCF Operations correlation feature, I checked if it correlates with any other metric. The only metric it founds is Idle, which is logical they basically add up to 100% when Run is low.
Take note of a [known accounting issue](https://knowledge.broadcom.com/external/article?legacyId=85393) that wrongly inflates the value of Other Wait and esxtop %VMWait.
Consumption Metrics
Consumption metric covers only utilization. Reservation and Allocation are properties, not metrics.
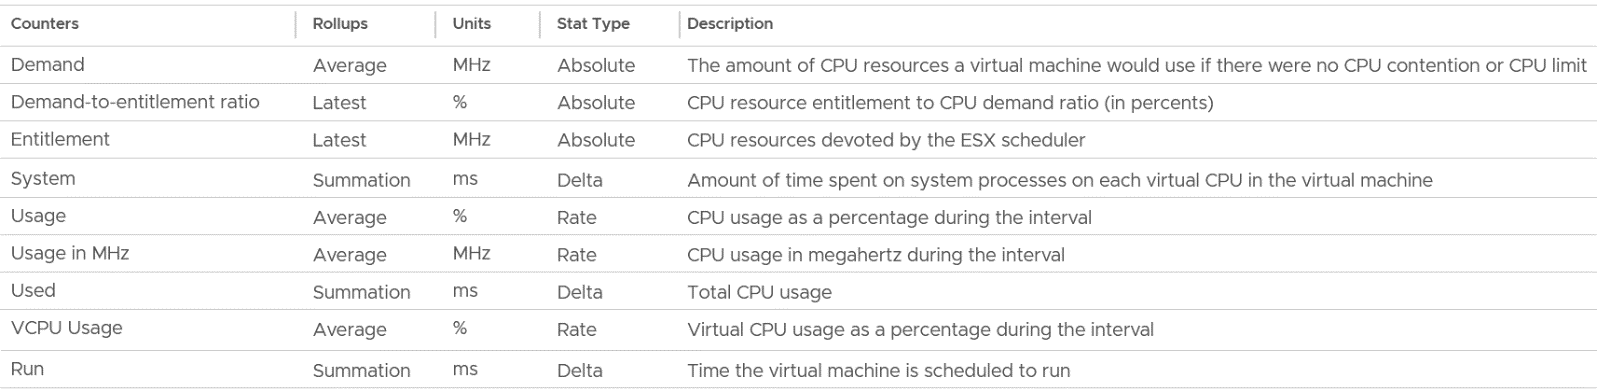
The following table shows the 5 VM utilization metrics.
| Counter | Unit | Source | Observability |
| Run | Millisecond | ESXi | vCPU level |
| Used | Millisecond | ESXi | vCPU level VM level |
| Usage | MHz | vCenter | vCPU level VM level |
| Usage | % | vCenter | VM level |
| Demand | MHz | ESXi | VM level |
Note: CPU Used and Usage at the VM level includes the system time and other charges that is not associated with a particular vCPU. If you sum up the vCPU amounts, you will notice a small gap to the amount at VM level. You can verify by comparing the values show on the vCenter performance chart legend.
Run | Net Run
Run is when the Guest OS gets to run and process instruction. It is the most basic counter among the CPU consumption metrics. It’s the only counter not affected by CPU frequency scaling and hyper threading. It does not check how fast it runs (frequency) or how efficient it runs (SMT).
Run at VM level = Sum of Run at vCPU levels
Since the unit is millisecond, this means the value of CPU Run at VM level can exceed 20000 ms in vCenter.
The following screenshot shows CPU Run higher than CPU Used. We can’t tell if the difference is caused by power management or hyperthreading, or mix of both.
CPU Run does not account for the following:
-
Interrupt
-
System time. IO performed by hypervisor has to be charged back to the VM.
-
Power Management or CPU Frequency Scaling
-
Simultaneous Multithreading (Hyper Threading as Intel calls it)
Because CPU Run does not take into account this external work, and not aware of CPU speed and HT, it is suitable as input to size the Guest OS and not the VM. The portion that needs to be removed is Overlap. VCF Operations added a new counter in July 2024 called Net Run.
The formula is:
Net Run = Run – Overlap
As you can guess, Net Run cannot hit 100%.
Used | Usage
The scope of CPU Run metric means it can’t answer 2 important questions. When a vCPU is running,
| How fast is the “run”? | All else being equal, a 5 GHz CPU is 5x faster than a 1 GHz CPU. The faster it can complete a task, the shorter it has to work. That’s why you see some metrics in MHz, because they account for this speed. |
|---|---|
| How efficient is the “run”? | If there is competing thread running in the same core, the 2 threads have to share the core resource. Both threads do not drop their CPU frequency, but the cycles that each thread receives is 37.5% less. This is where it’s better to think in terms of cycles and not frequency |
This is where ESXi introduces the CPU Used (ms) counter.
vCenter then adds Usage (MHz) metrics, so you can see the total footprint of the VM in terms of CPU cycles.
BTW, if the English word usage confuses you, think of CPU Cycles Completed or CPU Throughput instead.
By covering the above 3, CPU Used covers uses cases that CPU Run does not.
-
Amount of work done.
-
VM Migration. Moving VM to another ESXi requires that you know the actual footprint of the VM, because that’s what the destination ESXi needs to deal with.
-
VM Chargeback. You should charge the full cost of the VM, and not just what’s consumed inside the VM. In fairness, you should also charge the actual utilization, and not rated clock speed.
Used
Here is how Used differs to Run:
Based on the above, you can work out the formula for VM level Used, which is:
VM level Used = Run - Overlap +/- E + System + VMX + MKS + Helper
VM vCPU level Used = Run - Overlap +/- E
Where E is the combination of
-
efficiency gained from CPU Turbo Boost. This is significant, could be 50% more when other physical cores in the socket are idle.
-
efficiency loss from power savings. This is also significant. If the frequency is dropped to 40% of the nominal frequency, we consider 60% of the CPU time was stolen.
-
37.5% efficiency loss from CPU SMT. ESXi accounting records HT as 1.25x overall gain, hence each thread drops to 62.5% only. This is a significant drop that should be accounted.
MKS is typically negligible. This thread is dedicated strictly to processing the video frame buffer, mouse coordination, and console graphic rendering. It accounts for CPU cycles spent while you’re consoling to the VM, where you use mouse and keyboard on the virtual screen.
VMX handles VM power states, configuration alterations, and high-level virtual hardware emulation outside the execution engine. In esxtop, System time is charged to the VM VMX world.
Helper covers the asynchronous I/of O helper worlds, virtual storage controllers, and background kernel threads specific to that VM instance. This metric is negligible.
Because Used accounts for the actual frequency, you may expect it to be measured in GHz and not millisecond. The “conversion” from GHz to millisecond was based on static frequency. I know it requires a bit of mental mathematics 😊
Quiz:
-
Why does the formula state VM level, and not individual vCPU level. What’s the reason?\
Answer: CPU Used has a different formula at VM level and vCPU level. At vCPU level, it does not include System Time. At VM level, it includes the work done by the kernel that is charged at VM level, such as System and other worlds.
-
How will Used compare with Run in general? Do you expect it to be higher or lower? If it’s higher, what can cause it?
For example, a physical chip comes with 2 GHz as its standard speed. ESXi may increase or decrease this speed dynamically, resulting in turbo boost or power saving. If ESXi increases the clock speed to 3 GHz, Used counter will be 50% higher than the Run counter. Older Guest OS (e.g. Windows or Linux) version was not aware of this performance boost. It reported a value based on the standard clock speed, just like Run does. On the other hand, if ESXi decreases the clock speed to 1.5 GHz, then Used will report a value that is 25% lower than what Run reports.
Usage
Usage is Used + work done by kernel on behalf of the VM. This is why you see a gap on VM that processes a lot of network packets or storage commands.
There are two metrics:
-
Usage (MHz)
-
Usage (%)
Usage (%) is only available at VM level. Usage (MHz) is available at both vCPU and VM level.
Usage (%) = ( Usage MHz for each vCPU + VM level load ) / VM Static CPU Speed
These 2 metrics do not exist in ESXi, meaning they only exist in vCenter.
The reason is Usage (%) is not available on a per vCPU basis, while Usage MHz is. The 2 charts are also very similar but not 100% identical. Notice in the following screenshot there is time where they are 100% identical, and there is time they are not. My guess is Usage (%) contains VMX load as it’s not available on a per vCPU basis.
Usage (MHz)
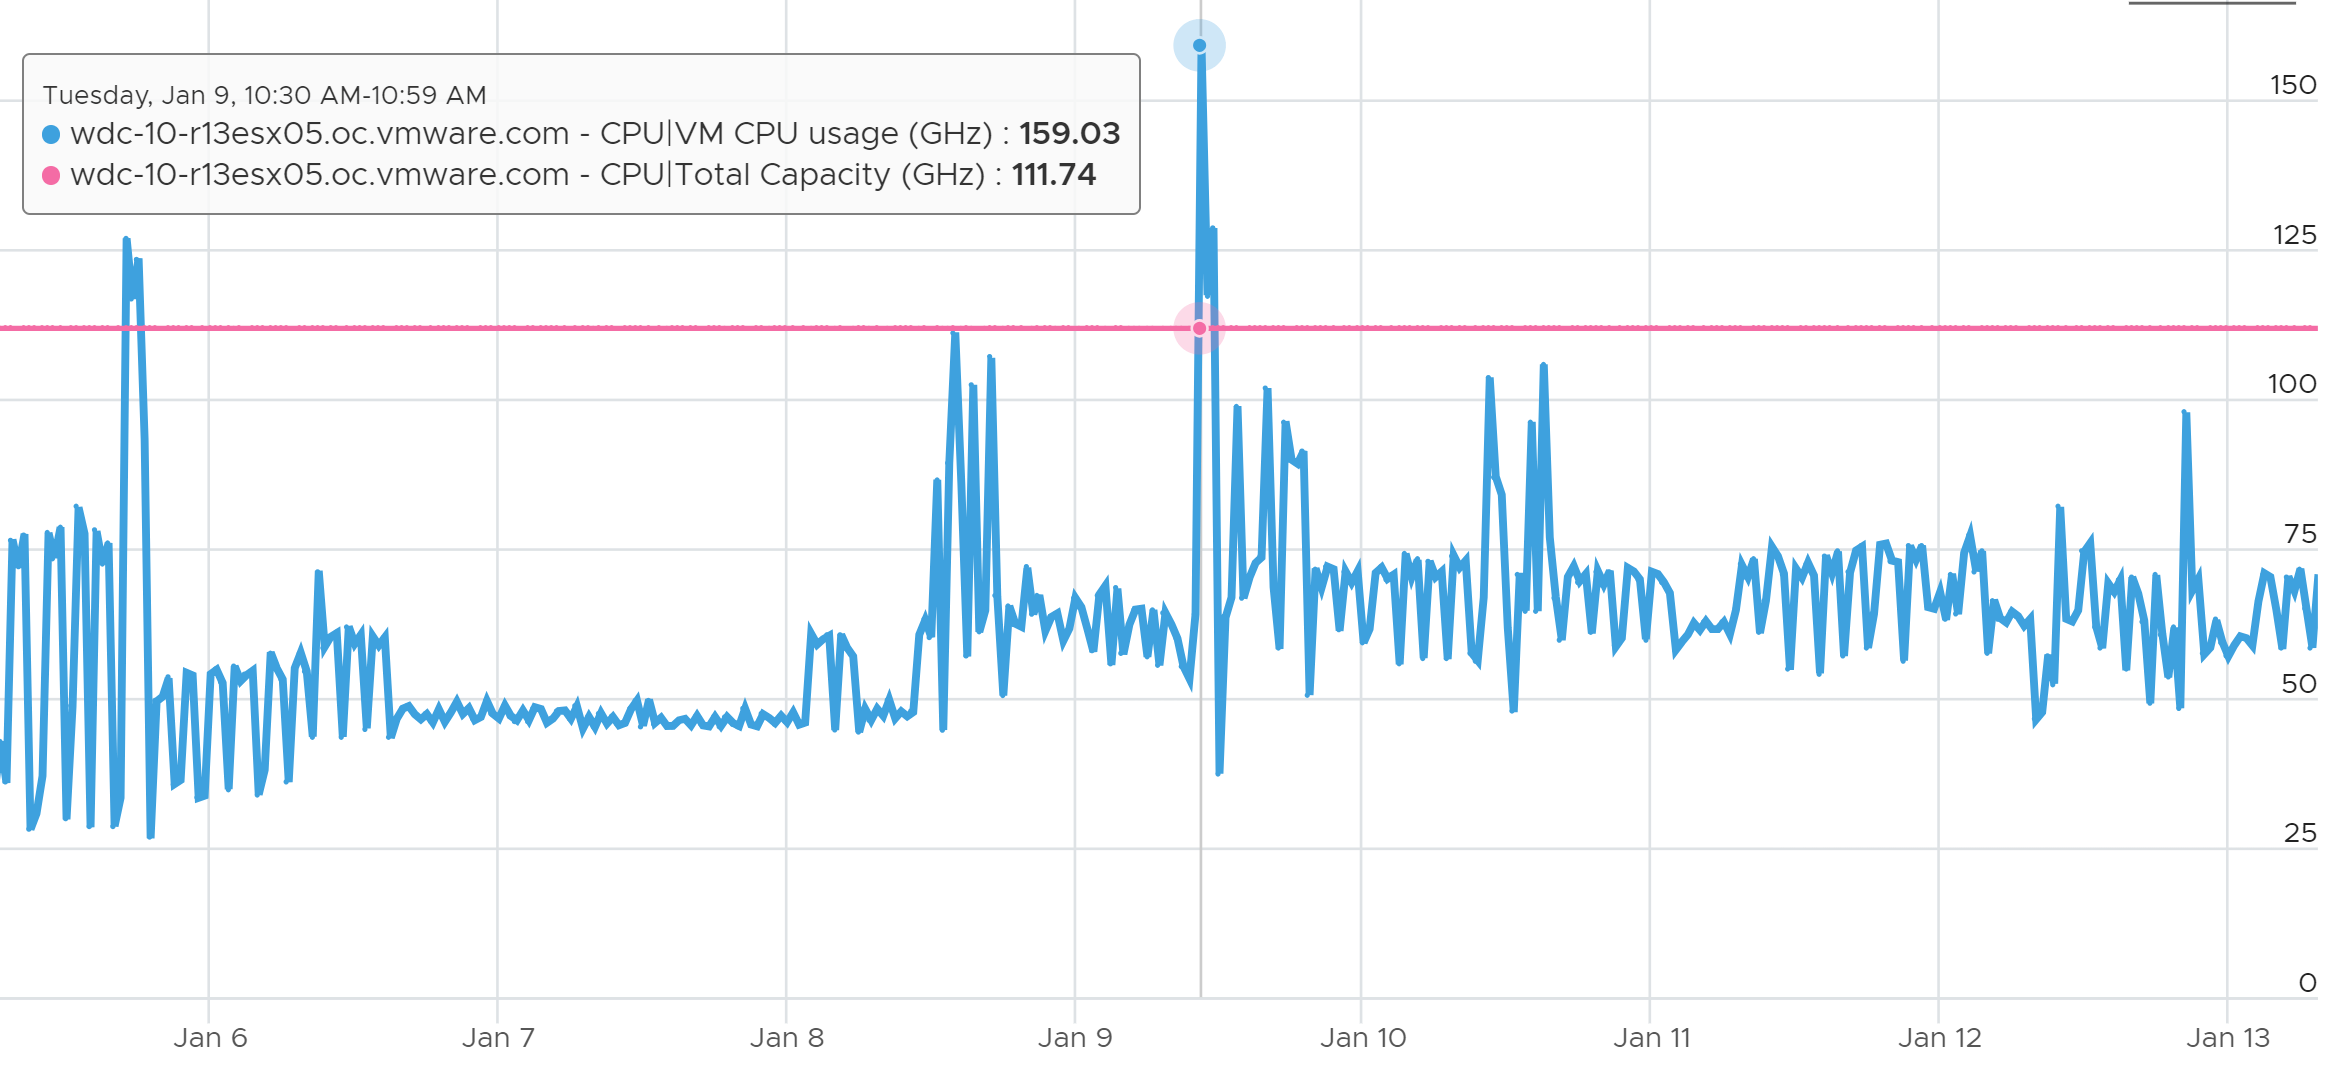
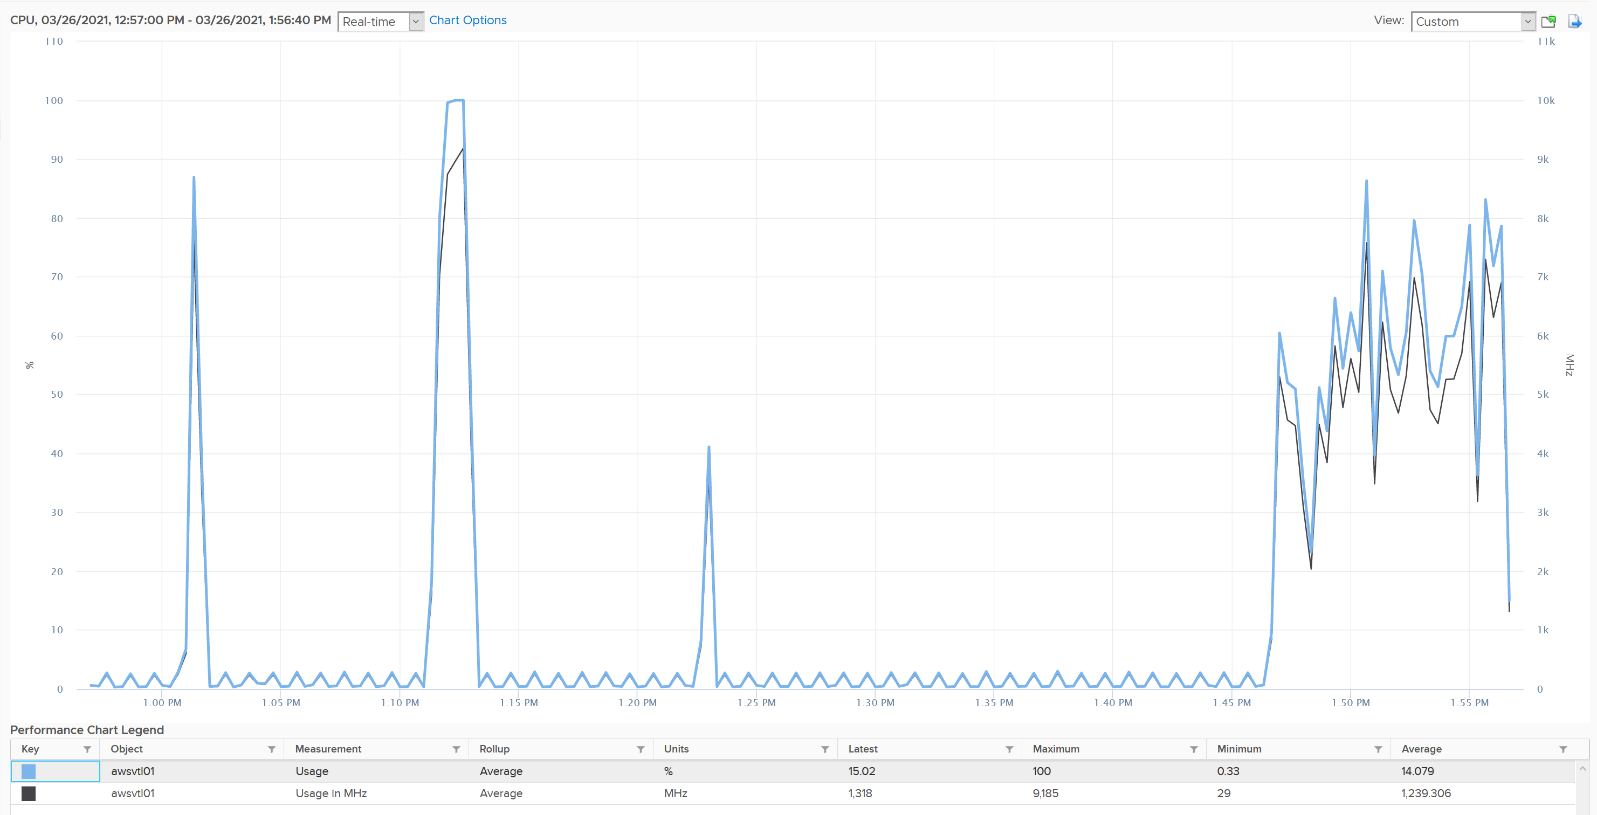
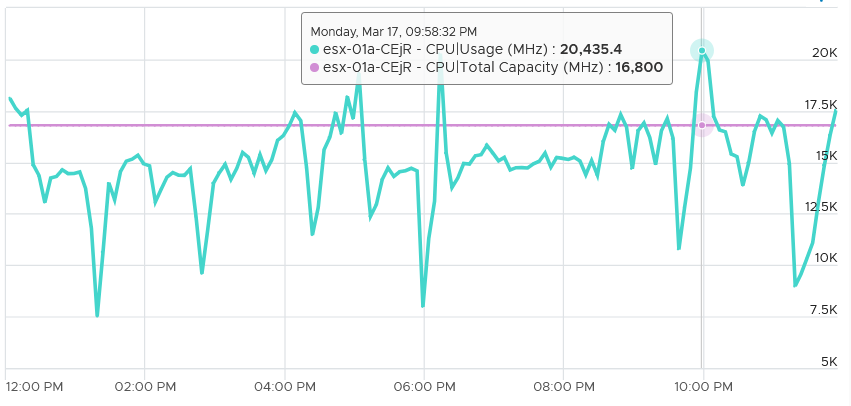
Turbo Boost’s impact on Usage is real. In the following, you can see the value exceeds the total capacity by a sizable amount.
Let’s do a calculation so you can quantify the impact of power management.
Review the following example. This is a single VM occupying an entire ESXi.
The ESXi has 12 cores with nominal frequency of 2.4 GHz. The number of sockets does not matter in this case.
Since HT is enabled, the biggest VM you can run is a 24 vCPU. The 24 vCPU will certainly have to share 12 cores, but that’s not what we’re interested here.
What do you expect the VM CPU Usage (GHz) when you run the VM at basically 100%?
Well, that depends on the all-core turbo boost of the CPU.
The result above is slightly less than 39 GHz.
If there is no turbo boost, the answer will be 36 GHz.
Why not 57.6 GHz, because it’s 24 vCPU x 2.4 GHz?
Because HT does not yield 2x. It yields 1.25x only. At the end of the day, the one that does the computation is the core not the thread.
12 cores x 2.4 GHz 1.25 HT = 36 GHz total capacity with hyperthreading enabled.
In the preceding example, power management was enabled. Naturally Turbo Boost kicked in, albeit not so dramatic as all the physical cores were turbo at the same time.
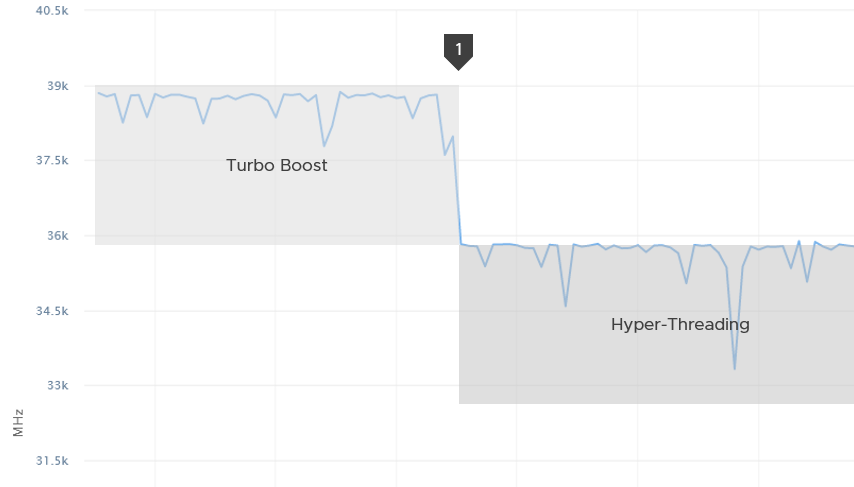
You got around 39 GHz, a small increase over 36 GHz. Formula is 2.4 GHz x 12 cores x 1.25 HT x 1.08x Turbo Boost.
What happens when we disable turbo boost? That’s what we did at point 1 in the diagram above.
CPU Usage drops to slightly below 36 GHz.
Usage (%)
The following is a single vCPU production Windows Server. Both CPU Usage (MHz) and Demand jump to over 100%. Their values are identical for almost 30 days. The VM had near 0% Contention (not shown in chart), hence the 2 values are identical.
Around 12 May, the VM experienced some contention. That’s why Demand was higher than Usage.
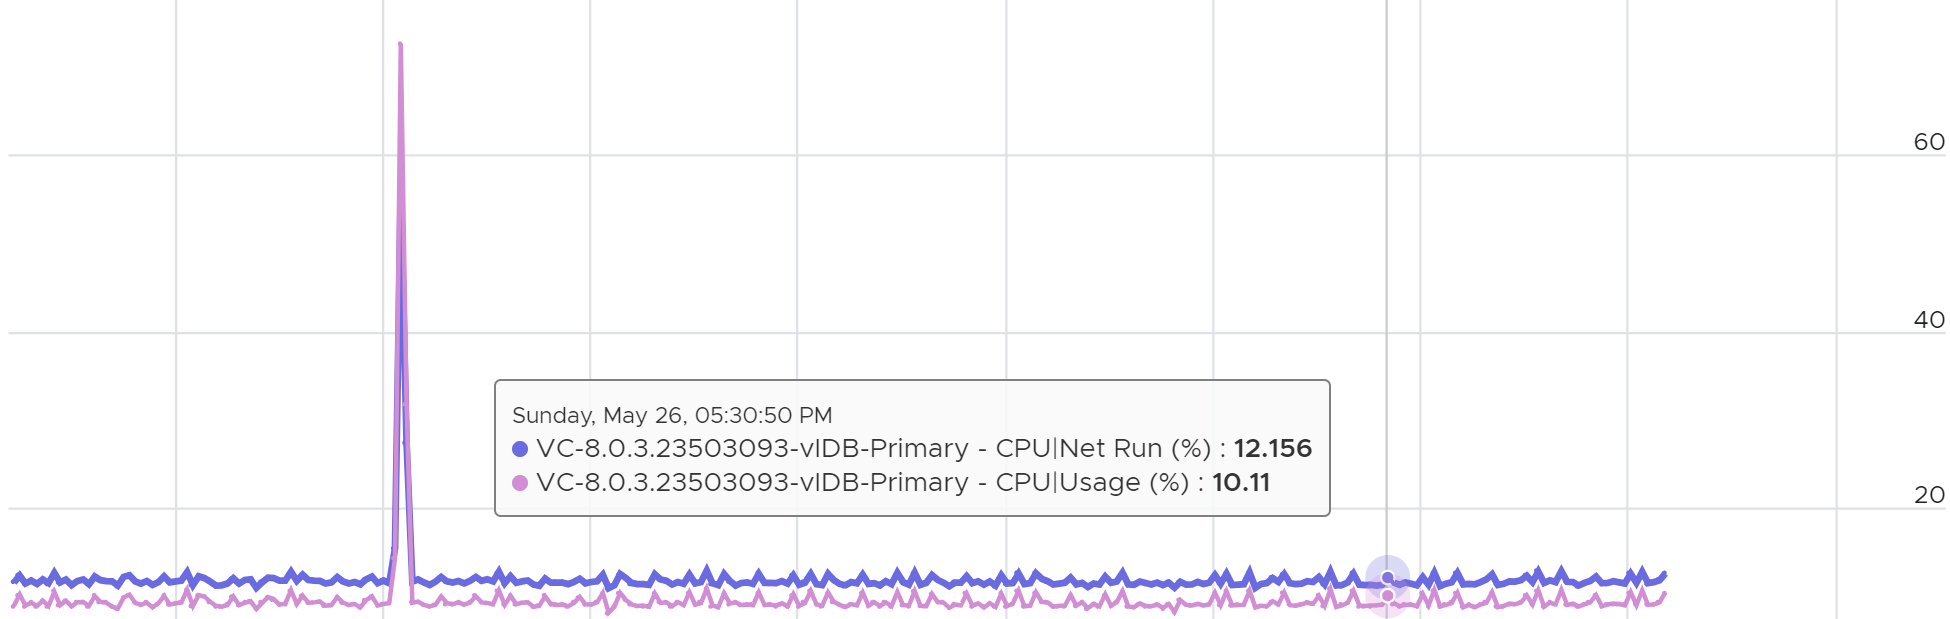
Usage vs Net Run
What do you notice on the following chat?
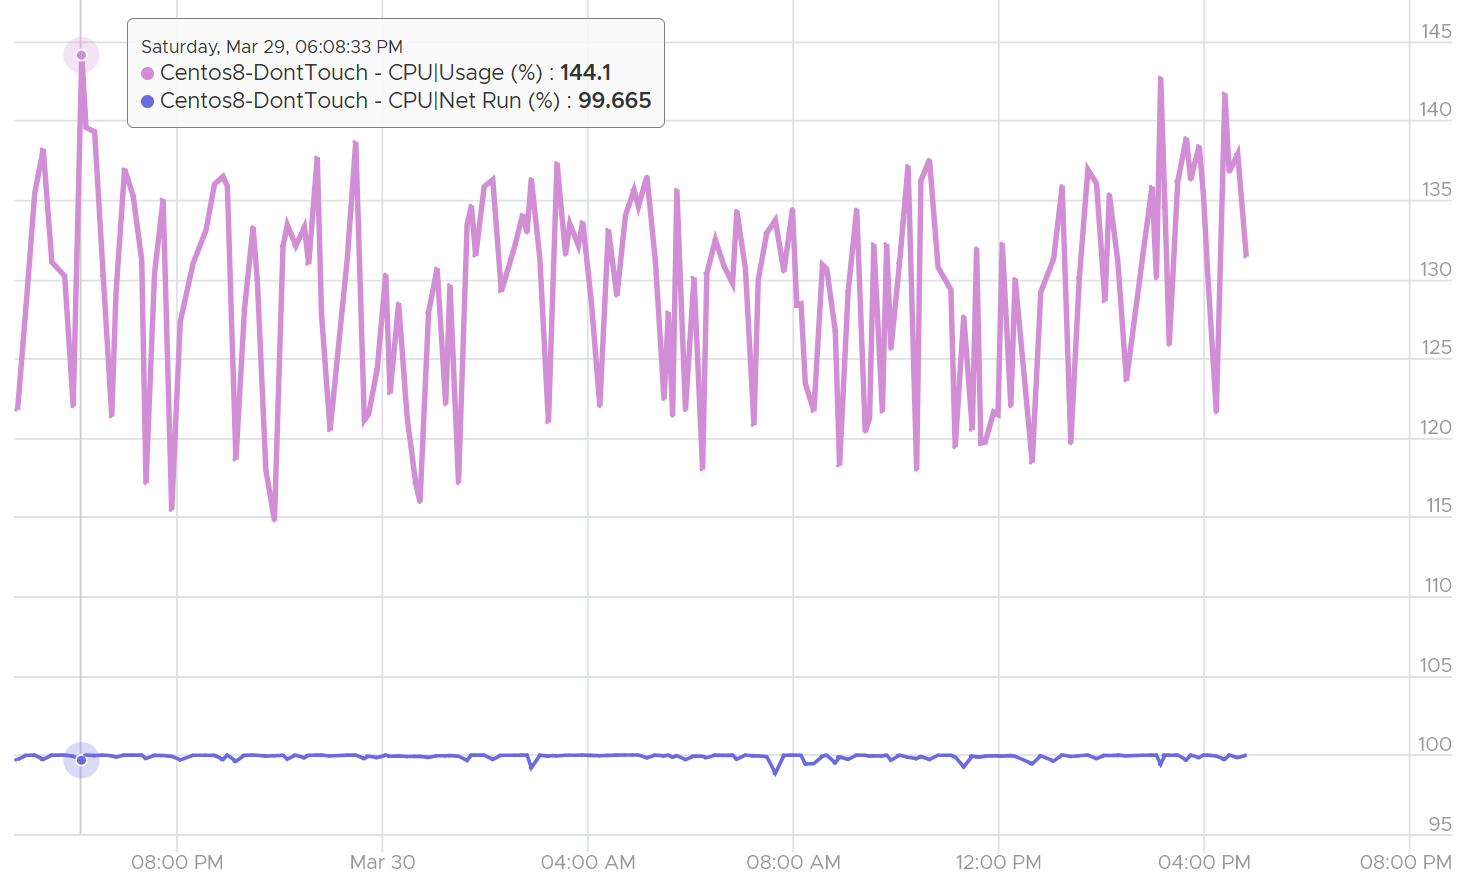
Yes, Net Run was basically flat out at 100% for 24 hours. The value did not exceed 100%. Usage on the other hand, was wildly fluctuating. By now you should know why 😊
What do you notice on the following chart?
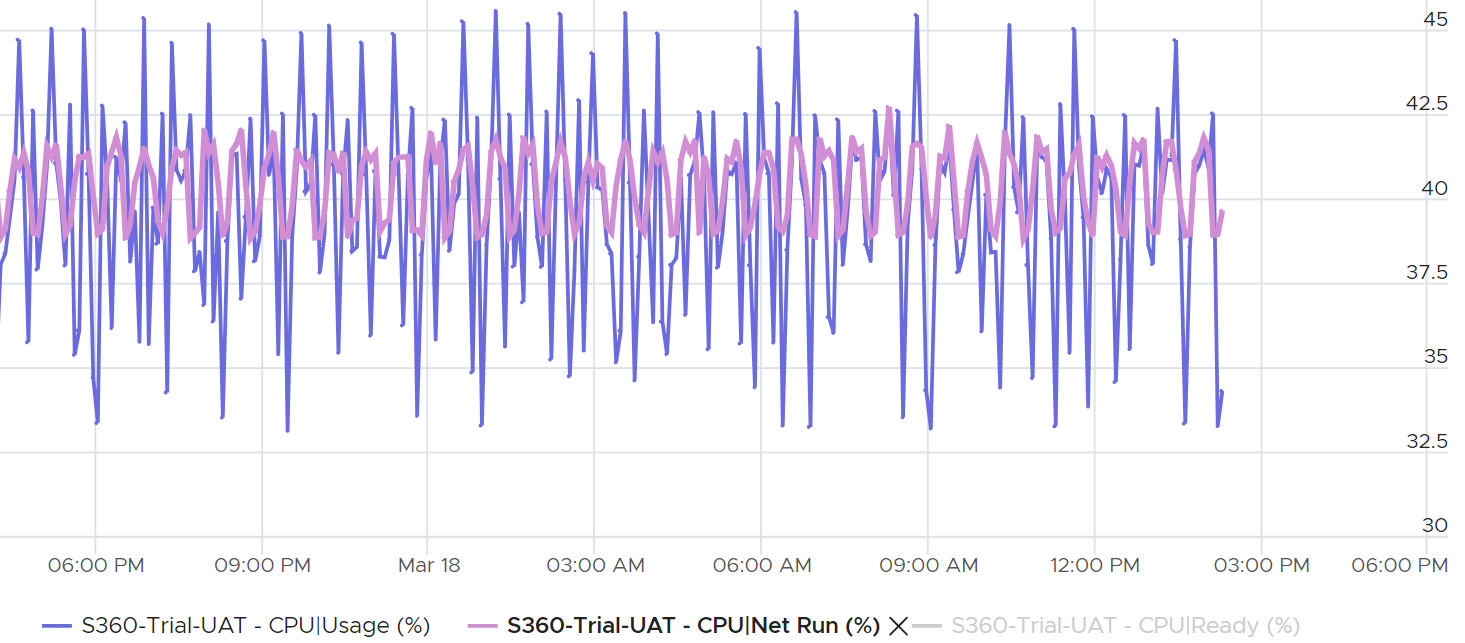
CPU Usage is both higher and lower than CPU Net Run. Why is that so?
Usage is greatly affected by CPU speed and power management. As a result, it’s more volatile than CPU Run.
Generally speaking, during high utilization, Usage (%) will over-report due to CPU turbo boost.
During low utilization, Usage (%) will under report due to power savings
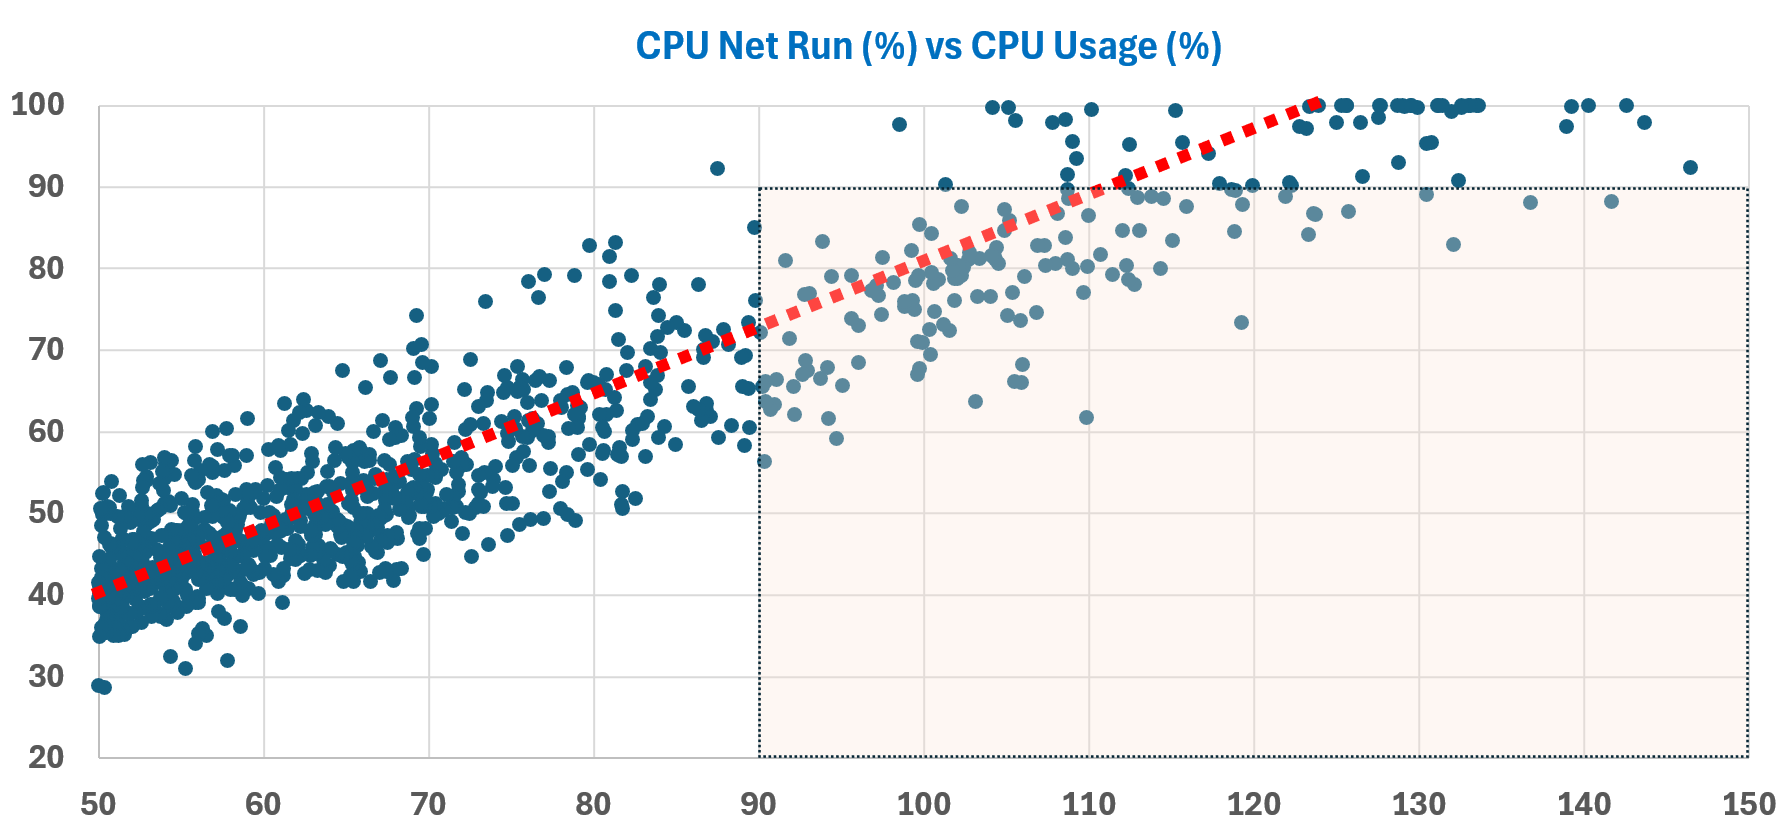
Overall
I plotted 1102 VM with Usage (GHz) > 2 and Usage (%) > 50%.\
The rectangle is VMs that likely get upsized when there is no need. Usage > 90% but Run is < 90%.\
The red line shows that Usage tends to be 25% higher.
CPU Usage Disparity
This metric is required to convince the owners of the VM to downsize their large VMs. It’s very common for owners to refuse sizing it down even though utilization is low, because they have already paid for it or cost is not an issue.
Let’s an example. This VM has 104 vCPU. In the last 90 days, it’s utilization is consistently low. The Usage (%) counter never touch 40%. Demand is only marginally higher. Idle (%) is consistently ~20%.
All the key performance metrics such as Guest OS CPU Run Queue are low.
Obviously the VM does not need 104 vCPU. How to convince the owner if he is not interested in refund? The only angle left is performance. But then we’re faced with the following:
-
CPU Run Queue inside the Guest OS is low. Decreasing CPU will in fact increase it, which is worse for performance.
-
CPU Context Switch is high from time to time.
-
CPU Co-Stop is very low (max of 0.006% in the last 90 days). Decreasing CPU may or may not make it lower. Regardless, it’s irrelevant. Same goes with VM Wait and Swap Wait.
-
CPU Ready is very low (max of 0.14% in the last 90 days).
The only hope we have here to convince VM owner is to give insight on how the 104 vCPU are used. There are 2 ends of the spectrum:
| At one end, all 104 are balanced | All are running at that low 20%. This triggers an interesting discussion on why the application is unable to even consume a single vCPU. Is this inefficiency the reason why the application vendor is asking for so many vCPU? Commercially, it’s wasting a lot of software license |
|---|---|
| Imbalance | Some are saturated, while others are not.
|
In reality, there could be many combinations in between the 2 extremes. Other insights into the behaviour of the 104 vCPU are:
-
Jumping process. Each vCPU takes turn to be extreme high and low, as if they are taking turn to run. This could indicate process ping pong, where processes either do frequent start/stop, or they jump around from one vCPU to another. Each jump will certainly create context switch, like the cache needs to be warm up. If the target CPU is busy, then the running process was interrupted.
-
CPU affinity. For example, the first 10 vCPU is always much busier than the last 10 vCPU. This makes you think why, as it’s not normal.
Naming wise, vCPU Usage Disparity is a better name than Imbalance vCPU Usage. Imbalance implies that they should be balanced, which is not the case. It’s not an indication that there is a problem in the guest OS because VCF Operations lacks the necessary visibility inside the guest OS
Quiz!
Review the following. How can the average utilization is only 12.% yet the Usage Disparity is >100%
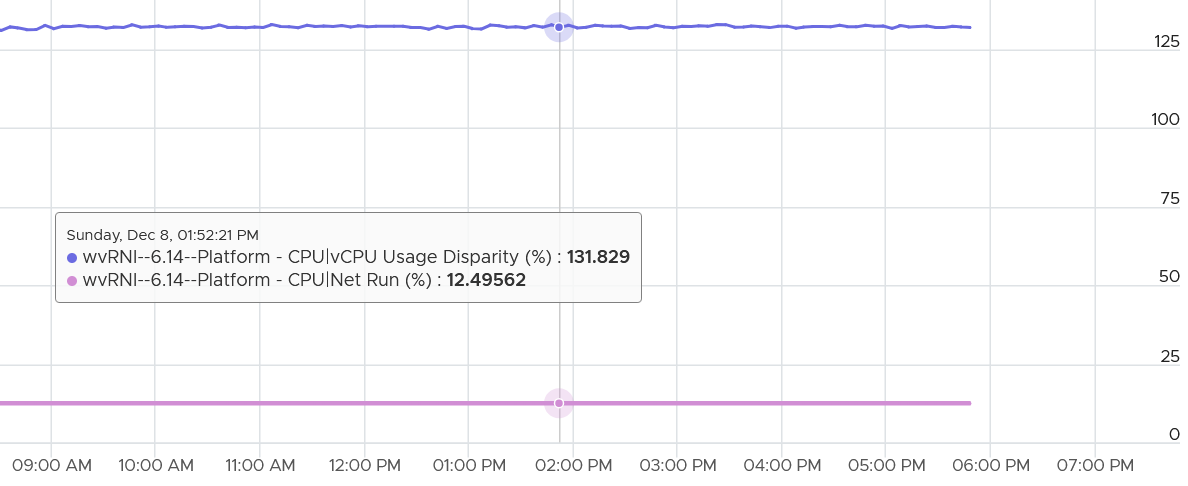
To answer, we need to plot each vCPU one by one.
Below is what we get.
Why only the first vCPU?
My take is uniprocessor kernel. It was compiled without SMP support.
Why did it go above 100%?
That’s CPU Frequency. Turbo has kicked in.
Demand
Demand is similar to Usage. It differs to Usage as it assumes the VM does not share the physical core. It’s what the VM utilization would be had it not experienced any issue, including hyper-threading.
Demand is not what Usage would be had the VM got everything it demanded. This metric is for the kernel resource scheduler. Ignore it.
Just to assure you, get a VM with high CPU Ready and Co-Stop that was intentionally caused. Set a limit. I did that, and here is what I got:
Co-Stop: 8.78%
Ready: 15.91%
Wait: 13.16%
Run: 62.15%
Total of the 4 = 100%.
This is expected. So far so good
But then here is what I got for Demand (%) and Usage (%):
Demand is identical to Usage, despite Contention (%) being near 0%.
The reason is Demand is a kernel internal metric. From the kernel perspective, the VM did not demand as limit is intentionally set.
In the event the VM vCPU is running on a core where both threads are busy, the value of Usage will be 37.5% lower, reflecting the fact that the VM only gets 62.5% of the core. This makes sense as the HT throughput benefit is fixed at 1.25x.
If there is no competition for resource, Demand and Usage will be similar.
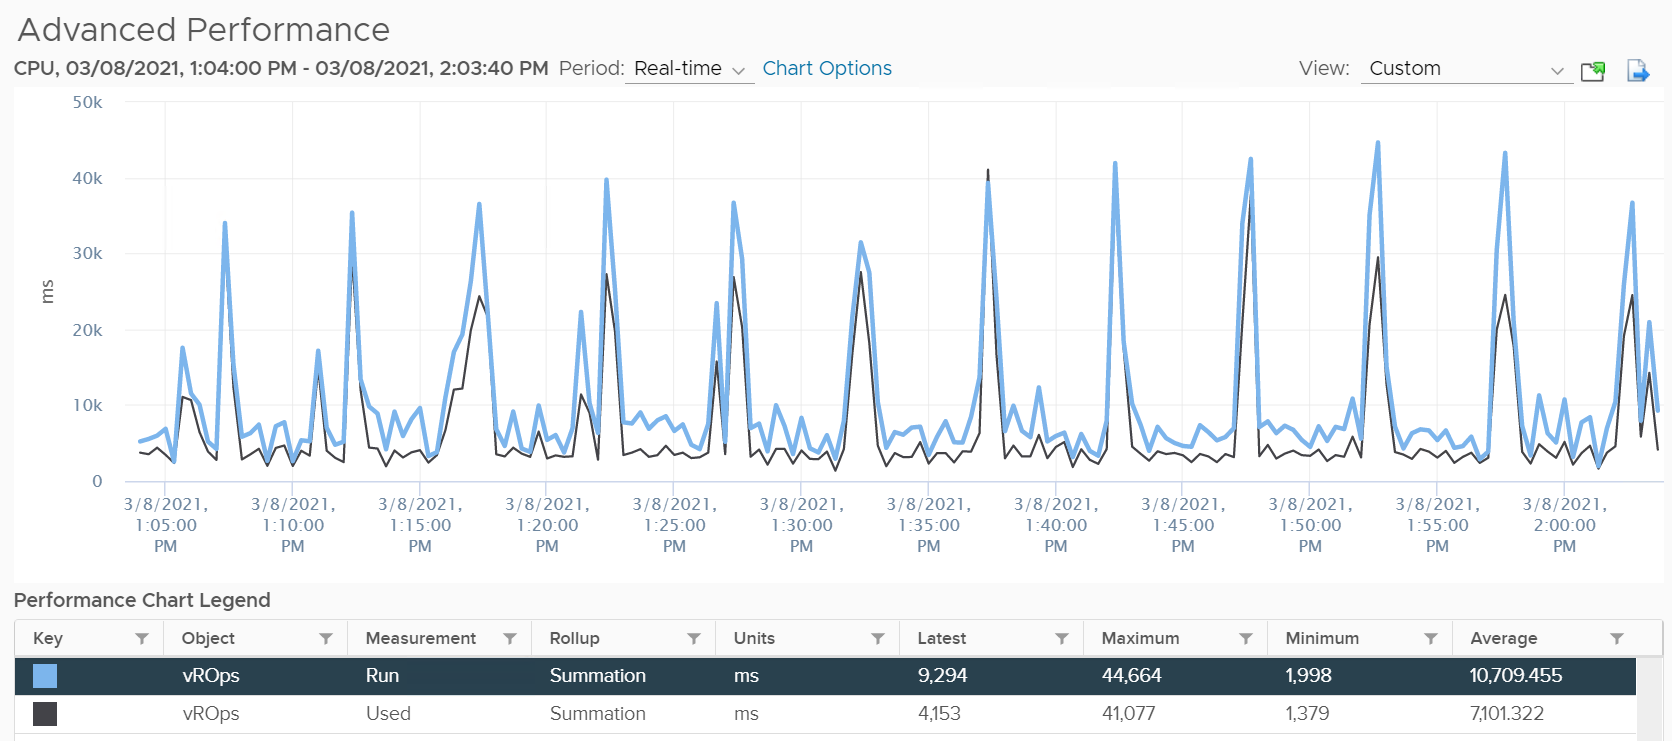
Take a look at the following screenshot from vCenter. It’s comparing Demand (thick line) and Usage (grey line)
What do you notice?
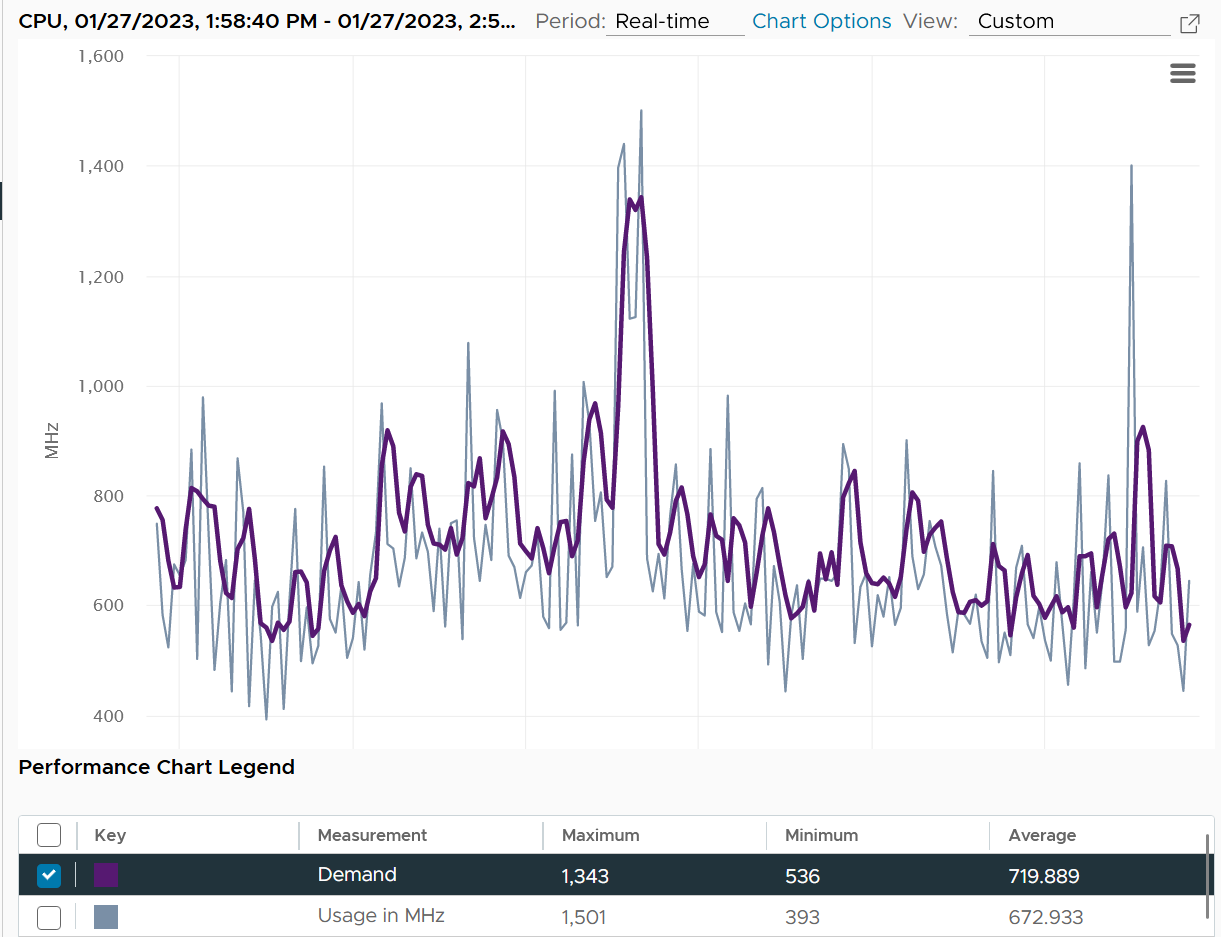
How can Usage be higher than Demand at some of the point?
The reason is Demand is averaged over a longer time, giving it a steadier value. That’s why the peak is shorter but wider. Notice the average over 1 hour is higher for Demand.
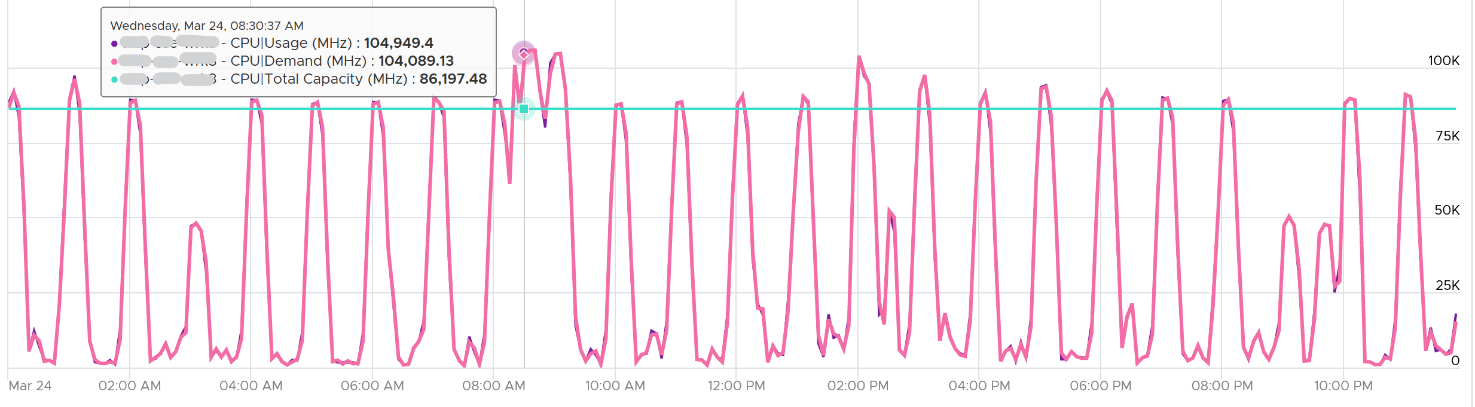
Due to Turbo Boost, Demand (MHz) and Usage (MHz) can exceed 100%. The following is a 32-vCPU Hadoop worker node. Notice it exceeds the total capacity multiple times, as total capacity is based on base clock speed. Demand and Usage are identical as it’s the only VM running and the host has more than 32 cores, hence there is 0 issue.
Okay, now that you have some knowledge, let’s test it 😊
Quiz Time! Looking at the chart below, what could be causing it?
Why did Demand jump while Usage dropped? VM CPU Contention (%) jumped even more. What is going on?
And why is that Contention is much more than Demand – Usage?
The reason why Demand metric jumps is the VM wanted more vCPU. That’s the only explanation.
Usage drops because the additional demand could not be met.
The VM experiences contention, which includes hyperthreading sharing. I did not include CPU Ready, Co-stop, Overlap, VM Wait and Swap Wait, as they do not matter in this case.
From the chart you can see that the formula for VM CPU Contention > Demand – Usage. Contention (%) is around 20% when Demand is 25% and Usage is 15%. The reason is Contention accounts for both CPU frequency and hyper threading, while the difference between Demand and Usage is only hyper-threading.
VCF Operations provides a percentage metric for Demand. The formula is
Demand (%) = Demand (MHz) / Total Capacity (MHz) x 100
Source wise, the metric in VCF Operations simply maps to vCenter counter cpu.demand.average.
System
A VM may execute a privilege instruction, or issue IO commands. These 2 activities are performed by the hypervisor, on behalf of the VM.
IO processing differs to non-IO processing as it has to be executed twice. It’s first processed inside the Guest OS, and then in the hypervisor storage subsystems, because each OS has their own storage subsystem. For ESXi, its network stack also has to do processing if it’s a IP-based storage.
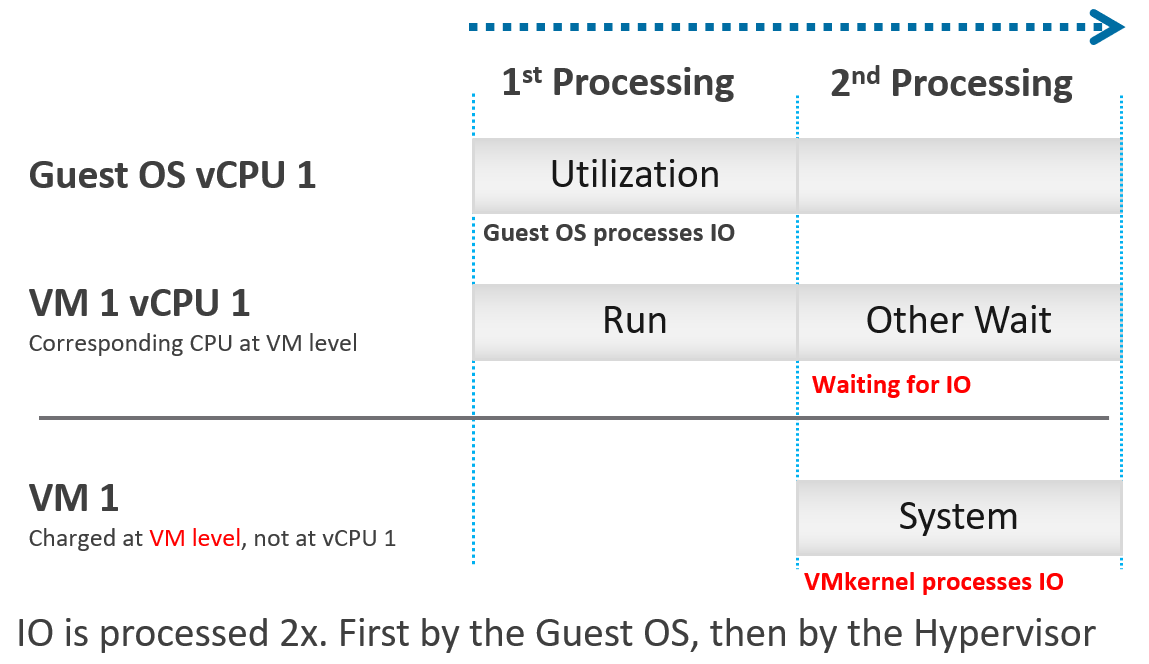
ESXi typically uses another core for this work instead of the VM vCPU, and put that that VM vCPU in wait state. This work has to be accounted for and then charged back to the associated VM. The System counter tracks this. System counter is part of VMX world of the VM.
Guest OS isn’t aware of the 2nd processing. It thinks the disk is slower as it has to wait longer.
If there is snapshot, then the kernel has to do even more work as it has to traverse the snapshot.
The work has to be charged back to the VM since CPU Run does not account for it. Since this work is not performed by any of the VM CPU, this is charged to the VM CPU 0. The system services are accounted to CPU 0. You may see higher Used on CPU 0 than others, although the CPU Run are balanced for all the VCPUs. So this is not a problem for CPU scheduling. It’s just the way the kernel does the CPU accounting.
The System counter is not available per vCPU. Reason is the underlying physical core that does the IO work on behalf of the VM may be doing it for more than 1 vCPU. There is no way to break it down for each vCPU. The following vCenter screenshot shows the individual vCPU is not shown when System metric is selected.
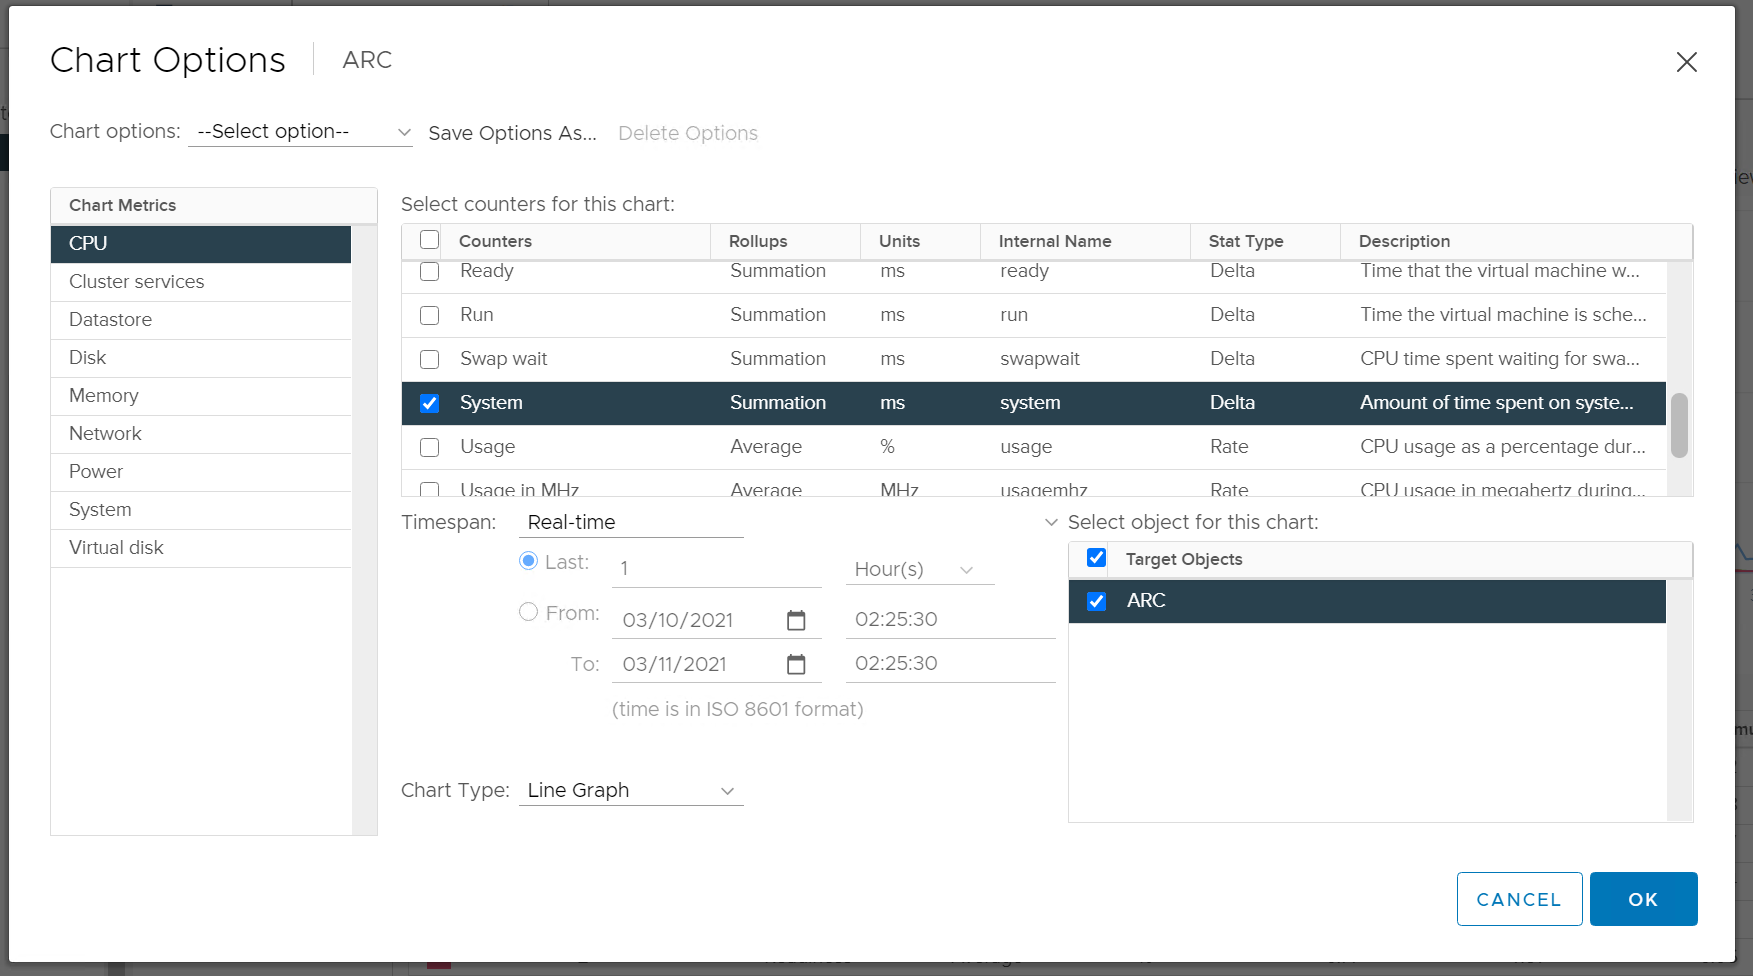
ESXi is also performing IOs on behalf of all VMs that are issuing IOs on that same time, not just VM 1. The kernel may serialize multiple random IO into sequential for higher efficiency.
Note that I wrote to CPU accounting, not Storage accounting. For example, vSphere 6.5 no longer charges the Storage vMotion effort to the VM being vMotion-ed.
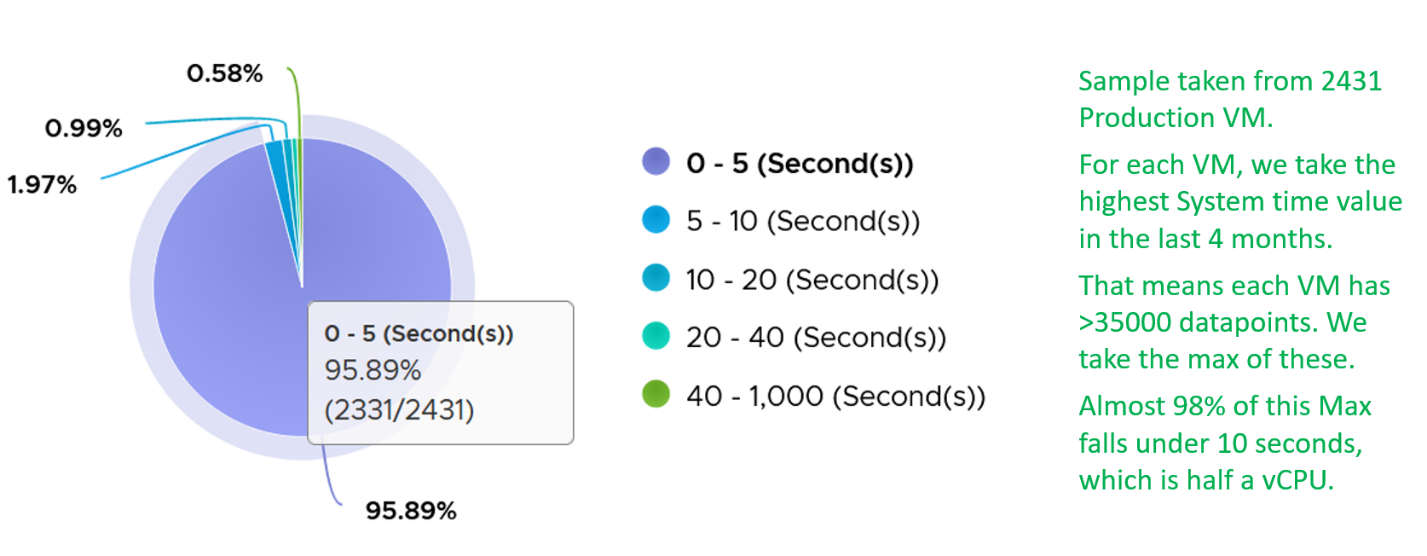
Majority of VMs will have System value less than 0.5 vCPU most of the time. The following is the result from 2431 VMs.
On IO intensive VM like NSX Edge, the System time will be noticeable, as reported by this KB article. In this case, adding more vCPU will make performance worse. The counter inside Linux will differ to the counter in vSphere. The following table shows high system time.
Reservation
The number is only available in MHz or GHz, not in vCPU. That means when you move the VM to an ESXi of different frequency, you need to adjust the number manually.
Quiz!
By now I hope you vrealize that the various “utilization” metrics in the 4 key objects (Guest OS, VM, ESXi and Cluster) varies. Each has their own unique behaviour. Because of this, you are right to assume that they do not map nicely across the stack. Let’s test your knowledge 😊
VM vs ESXi
Review the following chart carefully. Zoom in if necessary.
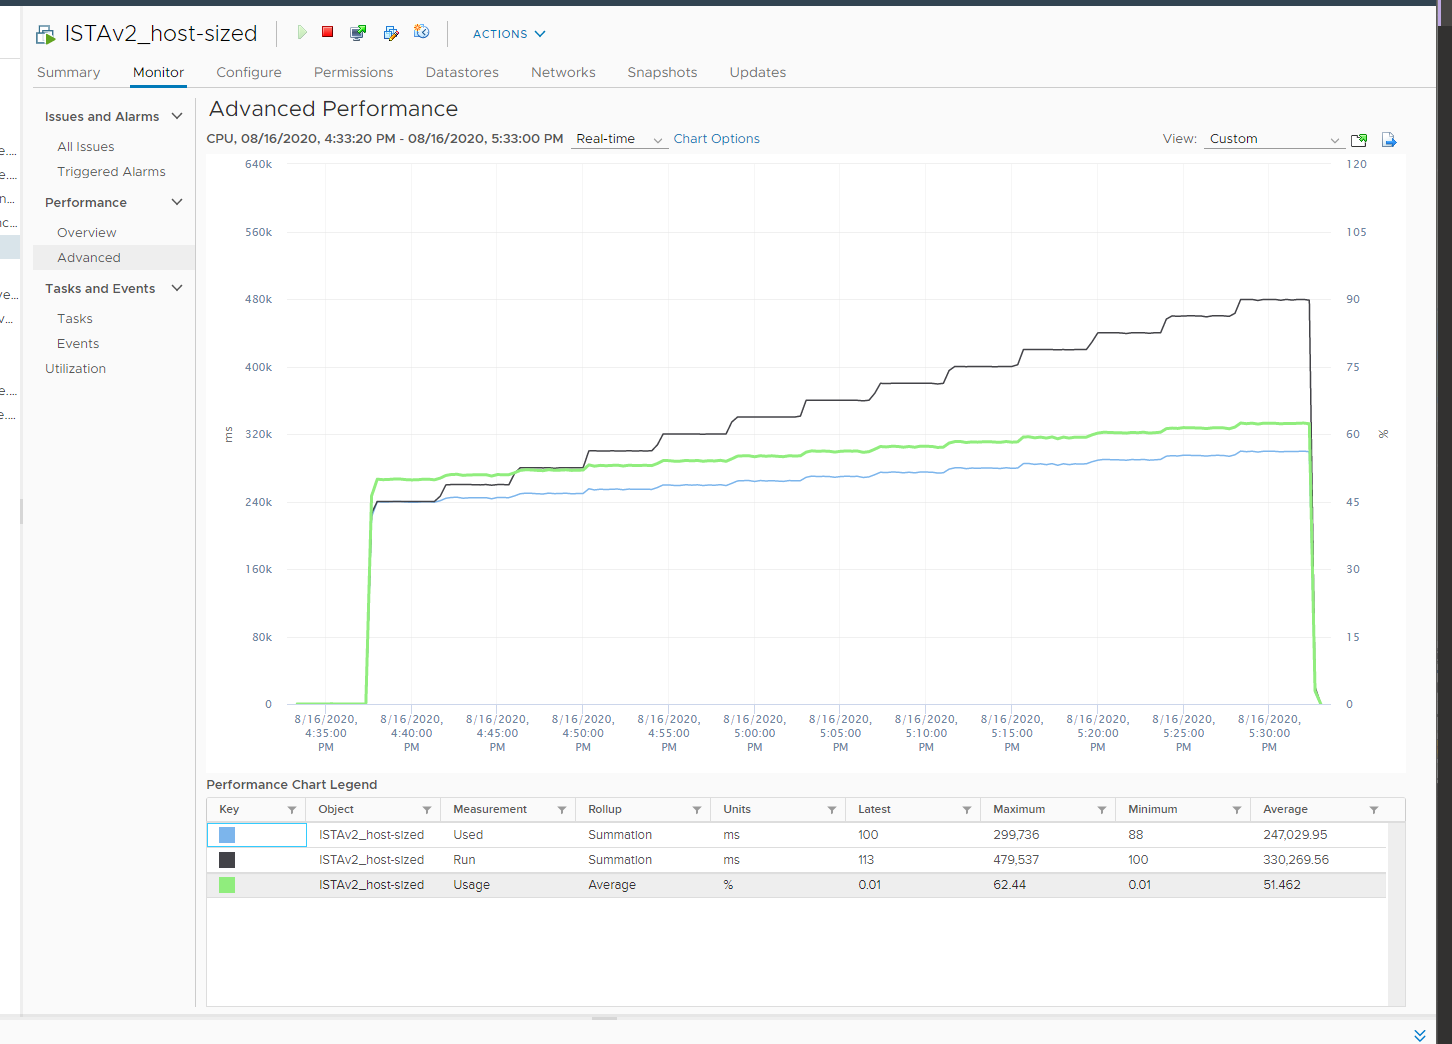
The vCenter chart[^11] above shows a VM utilization metrics from a single VM. The VM is a large VM with 24 vCPUs running controlled CPU test. The power management is fixed so it runs at nominal clock speed. This eliminates CPU frequency scaling factor.
The ESXi only has 12 cores. Hyper threading is enabled, so it has 24 threads.
The VM starts at 50% “utilization”, with each vCPU pinned to a different physical core. It then slowly ramps up over time until it reaches 100%.
Why do the three metrics moved up differently? What do they measure?
Now let’s look at the impact on the parent ESXi. It only has a single VM, but the VM vCPU matches the ESXi physical cores. The ESXi starts at 50% “consumption”, then slowly ramp up over time until it reached 100%.
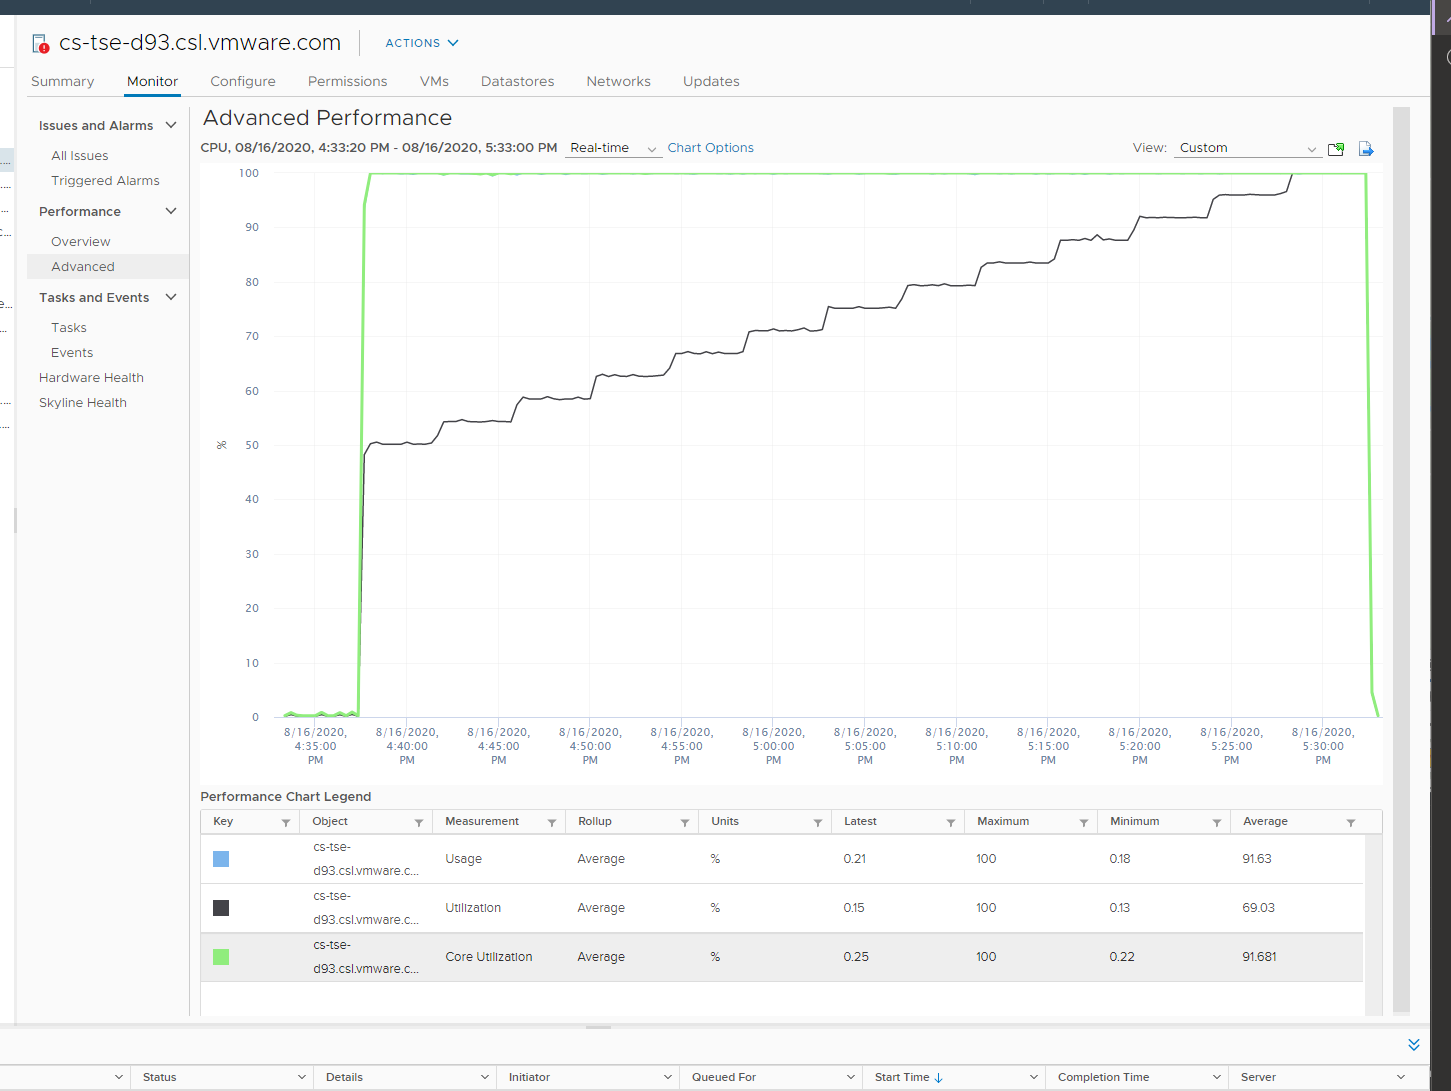
Why does CPU Usage moves in tandem with Core Utilization, but Utilization moved up differently? What do they measure?
Let’s break it down…
At the start of the test
The VM runs 12 vCPU, but each vCPU was pinned to each ESXi core. So all cores are 100% utilized, but each running 1 thread.
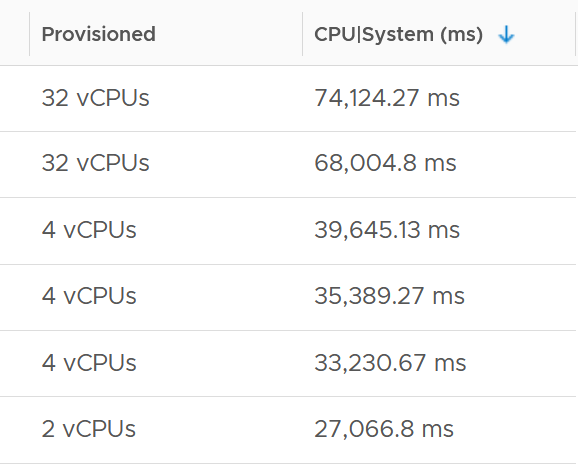
VM CPU Run (ms) is 240K milliseconds, which is 20K milliseconds x 12 (half of its 24 vCPU).
VM CPU Used (ms) is also at 240K milliseconds. There is no loss from overlap, the VM does not do much IO, and no efficiency loss/gain due to HT.
VM CPU Usage is 50%.
So at this point, all 3 metrics of VM CPU are 50%.
The counter at ESXi tells a different story. The ESXi Core Utilization (%) immediately went up to 100% while Utilization went up to only 50%. The reason is Core Utilization measures whether the core is used or not. It takes a different perspective.
Usage (%) is identical to Core Utilization in this case, because CPU frequency is static.
On the other hand, ESXi Utilization (%) looks at if each thread HT is running or not. It does not care about the fact that the 2 threads share a core, and simply roll up to ESXi level directly from thread level. This is why it’s showing 50% as it only cares whether a thread is running or not, at any point in time.
During Ramp Up period
VM is being ramped up steadily. You can see all 3 metrics went up in steps.
VM CPU Run (ms) ramps up from 240K to 480K. All 24 vCPU has 20K ms value, which equals to 100%.
VM CPU Used (ms) barely moved. From 240K to 300K. That’s 1.25x, demonstrating that Used understands HT only delivers 1.25x throughput.
VM CPU Usage (%) ramp up from 50% to 62.5%, also demonstrating awareness of contention due to HT.
Used (ms) = Usage (%)
ESXi CPU Usage (%) counter stayed flat at 100%. The reason is all 12 cores were already busy and the metric is capped at 100%. That means VM CPU Usage (%) is aware of HT, but ESXi CPU Usage (%) is not.
ESXi CPU Core Utilization (%) matches VM Run. Both went 2x.
Towards the end of the run
VM CPU Run is at 480K ms. This counter is suitable for VM Capacity sizing, as it correctly accounts that each vCPU is used by Guest OS.
VM CPU Used is at 300K milliseconds, which is 62.5%.
VM CPU Usage (%) is at 62.5%. On average, each of the VM vCPU only gets 62.5%. If you use this for your VM capacity, you will get the wrong conclusion as it’s already running 100%
ESXi CPU Usage (%) is at 100%. This makes it suitable from Capacity viewpoint, albeit too conservative. It is not suitable from Performance, as you cannot tell if there is still room.
ESXi CPU Utilization (%) is at 100%. Because it tracks the ramp correctly, it can be used from Performance. You can use it for capacity, but take note that 100% means you get performance hit from. In fact, at 50% the HT effect will kick in.
When Run is lower than Used
Take a look at this VM. It’s a single vCPU, so co-stop is not applicable.
The ESXi clock speed is 2.095 GHz, so the VM has a capacity of 2.095 GHz. A limit is imposed at 2 GHz.
What’s your conclusion on the Demand and Usage counters?
They are basically identical, hovering around 1.96 GHz. If you use the 2.095 GHz as the 100%, basically both counters are flat around 94%.
Why are they similar? Shouldn’t Demand be higher?
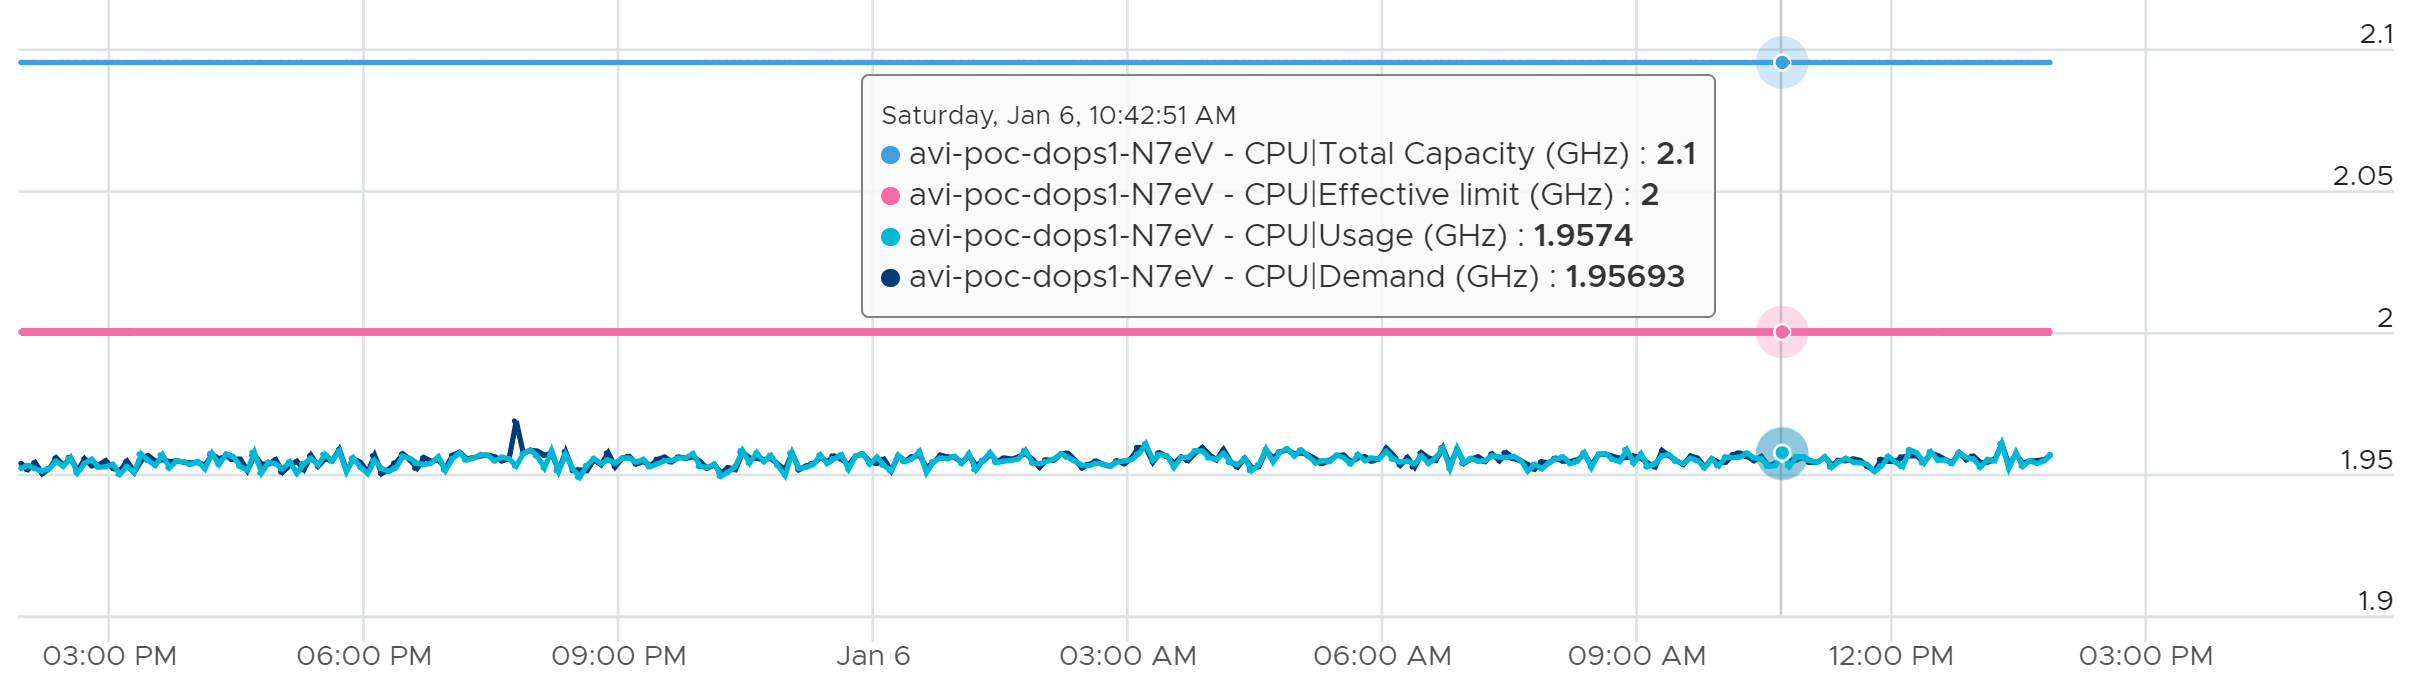
Now let’s see the Used (ms) metric.
It’s also flat, around 18600 ms. Using the 20000 as the 100%, it’s around 93%. This is fairly expected, as I think Usage (MHz) contains non vCPU worlds (e.g. MKS)
Now let’s plot Run (ms) alongside. Why is it much lower?
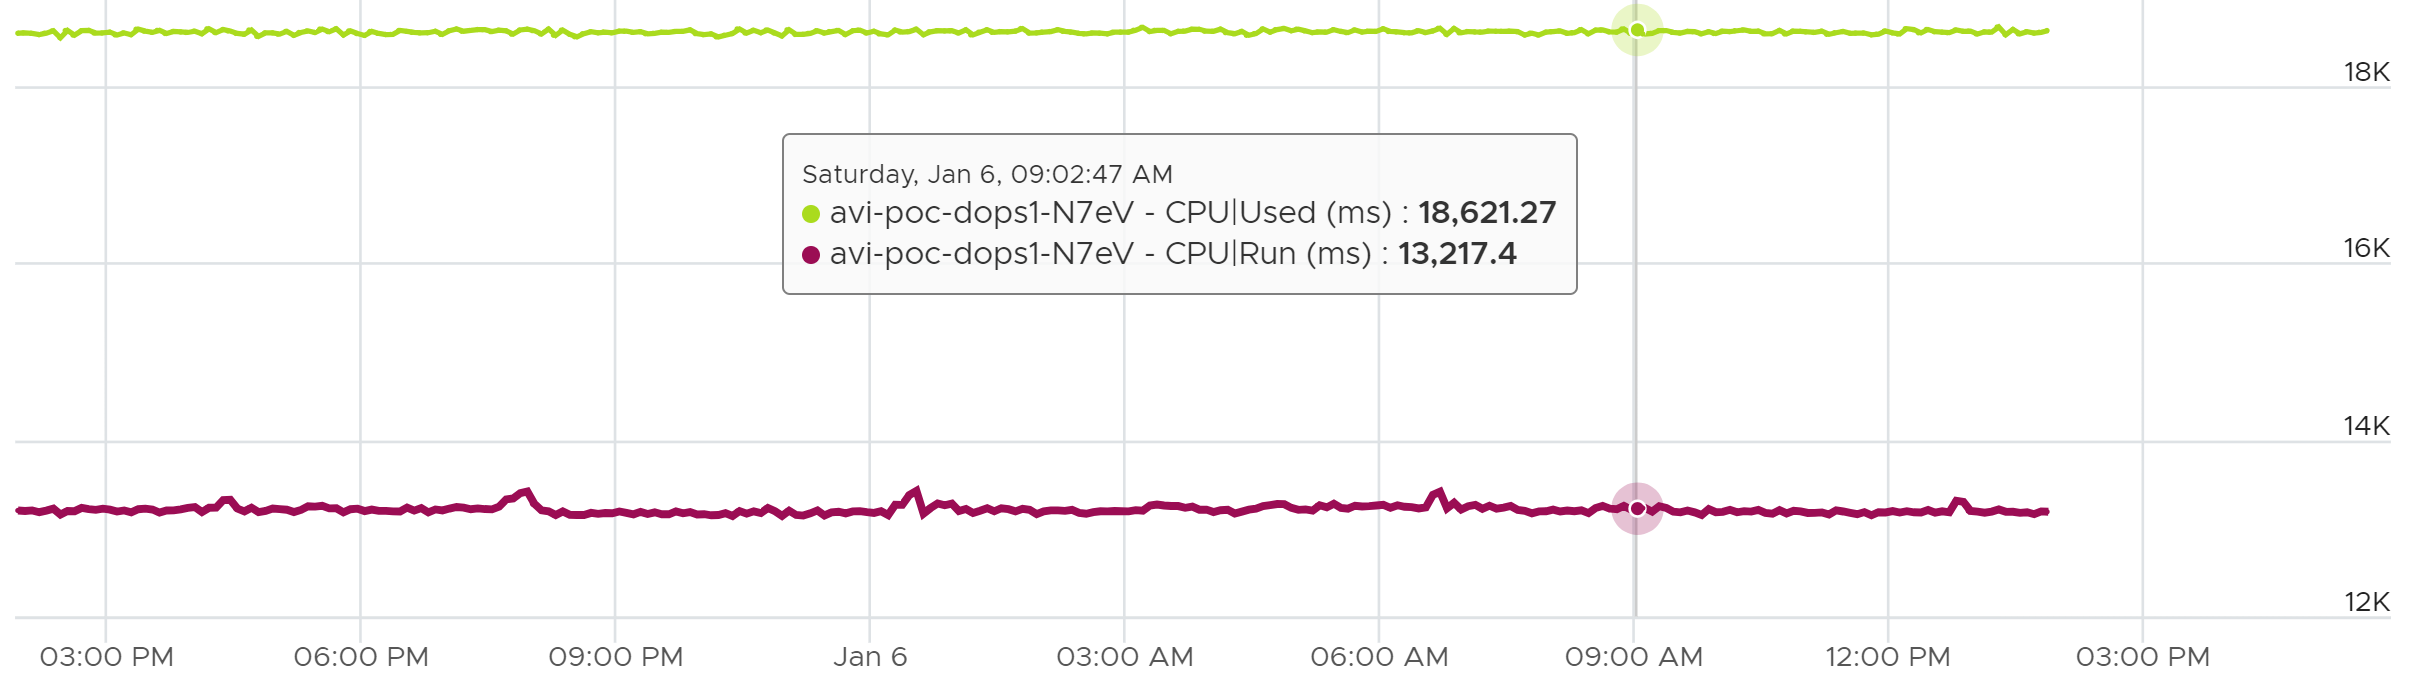
Why is Used consistently 41% higher than Run?
Answer is CPU Ready.
If you sum up Run + Ready + Overlap + Idle, it will be 20000.
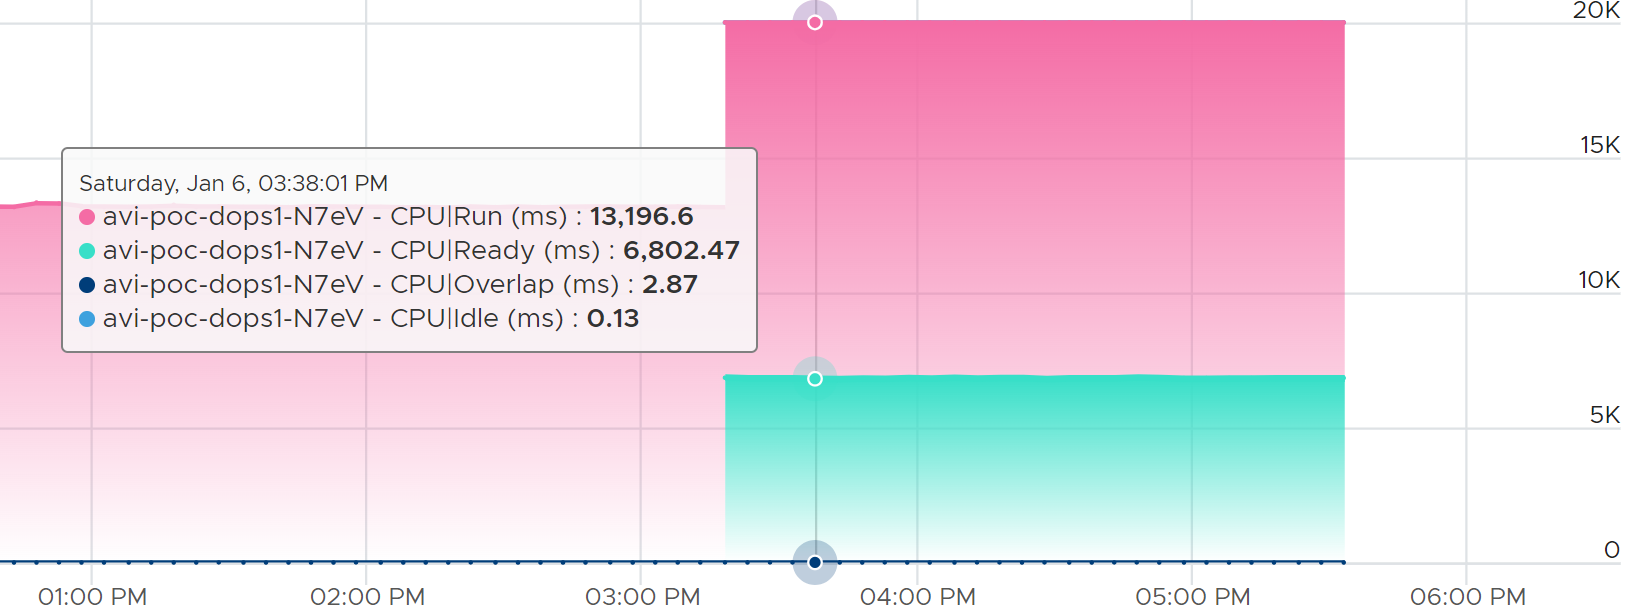
When Run is higher than Used
Now let’s look at the opposite scenario.
This VM is a 64-bit Ubuntu running 4 vCPU. Used (ms) is around 44% of Run (ms). The VM had minimal System Time (ms) and Overlap (ms), so Used is basically lowered by both power savings and CPU SMT.
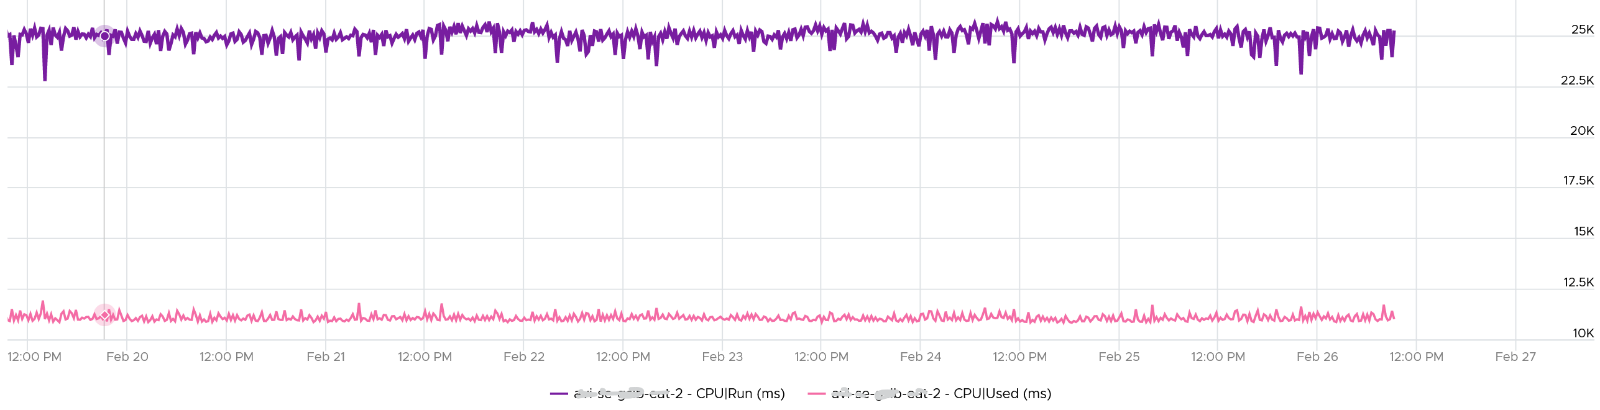
In this example, if Run is far from 100% and the application team want faster performance, your answer is not to add vCPU. You should check the power management and CPU SMT, assuming the contention metrics are low.
ESXi
Throughout this book, I always cover the contention metrics first, then consumption. Why is it that I swap the order for ESXi Host?
Because in the provider layer there is no contention. The one that faces contention is the consumer (VM).
Consumption Metrics
vSphere Client UI provides 6 counters to track ESXi CPU “consumption” and 1 to track reservation.
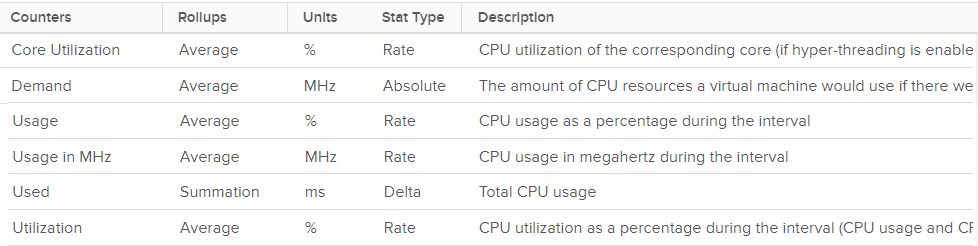
Why 6?
Let’s dive into the utilization metrics with a quiz.
Quiz: 50% or 75% or 100%?
Hope you like the tour of VM CPU accounting. Now apply that knowledge into ESXi and explain the following:
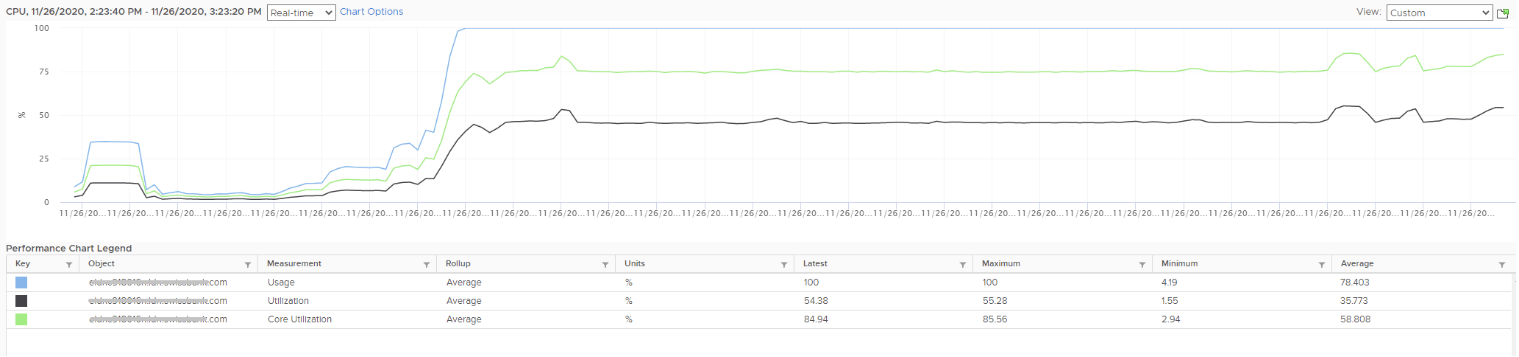
The above is an ESXi host, showing 3 types of utilization metrics.
-
One shows ~50%, indicating you have capacity.
-
The second one shows 100%, indicating you do not have capacity. BTW, this was the old version, where the metric was capped at 100%.
-
The 3rd shows ~70%.
Which metrics do you take for the ESXi CPU “consumption” then?
They also do not move in tandem. Towards the end, both the black line and green line fluctuate, but the blue one was flat at 100%. Why?
Since the graph is a bit small, let’s zoom in:
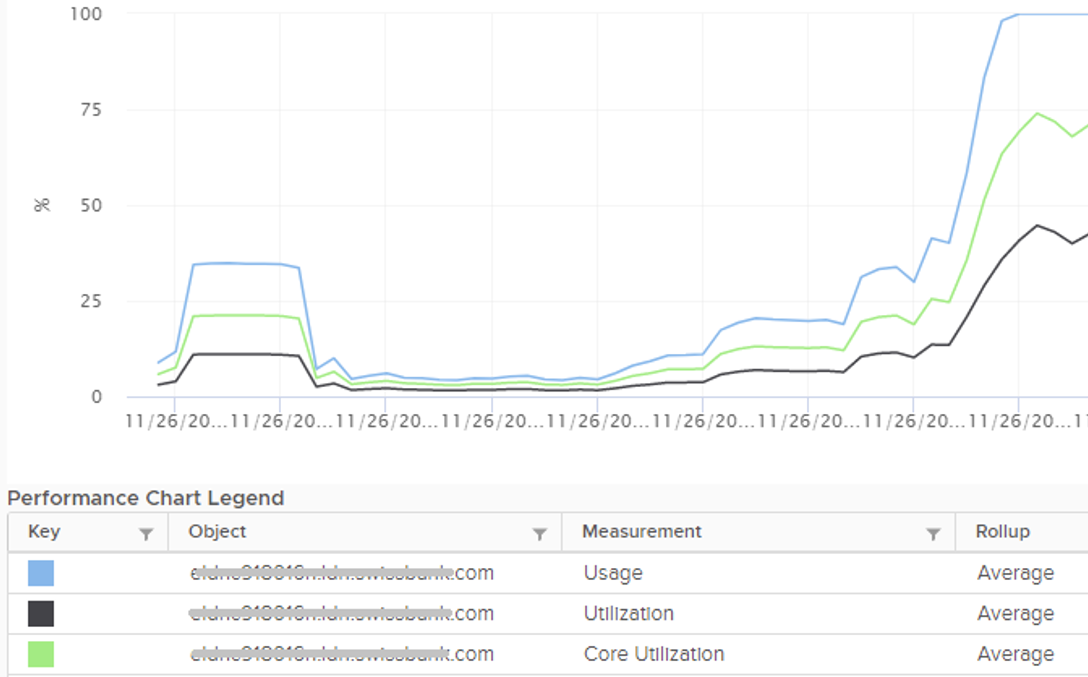
Notice they have similar pattern, but their sensitivity differs.
-
Why is Usage (%) = 100% when Utilization (%) is around 47%? The gap is more than double. What could be causing it?
-
Why is Utilization (%) fluctuating yet Usage (%) remains constant? Notice both Utilization varies between 45% and 55% while Usage remains flat at 100%
-
Why is Core Utilization (%) in the “middle”? What does it actually measure then?
High Load Example
The preceding example shows Utilization (%) mostly below 50%. Let’s pick the opposite example, where at least half the threads are utilized. What do you expect the value of Usage (%) and Core Utilization (%)?
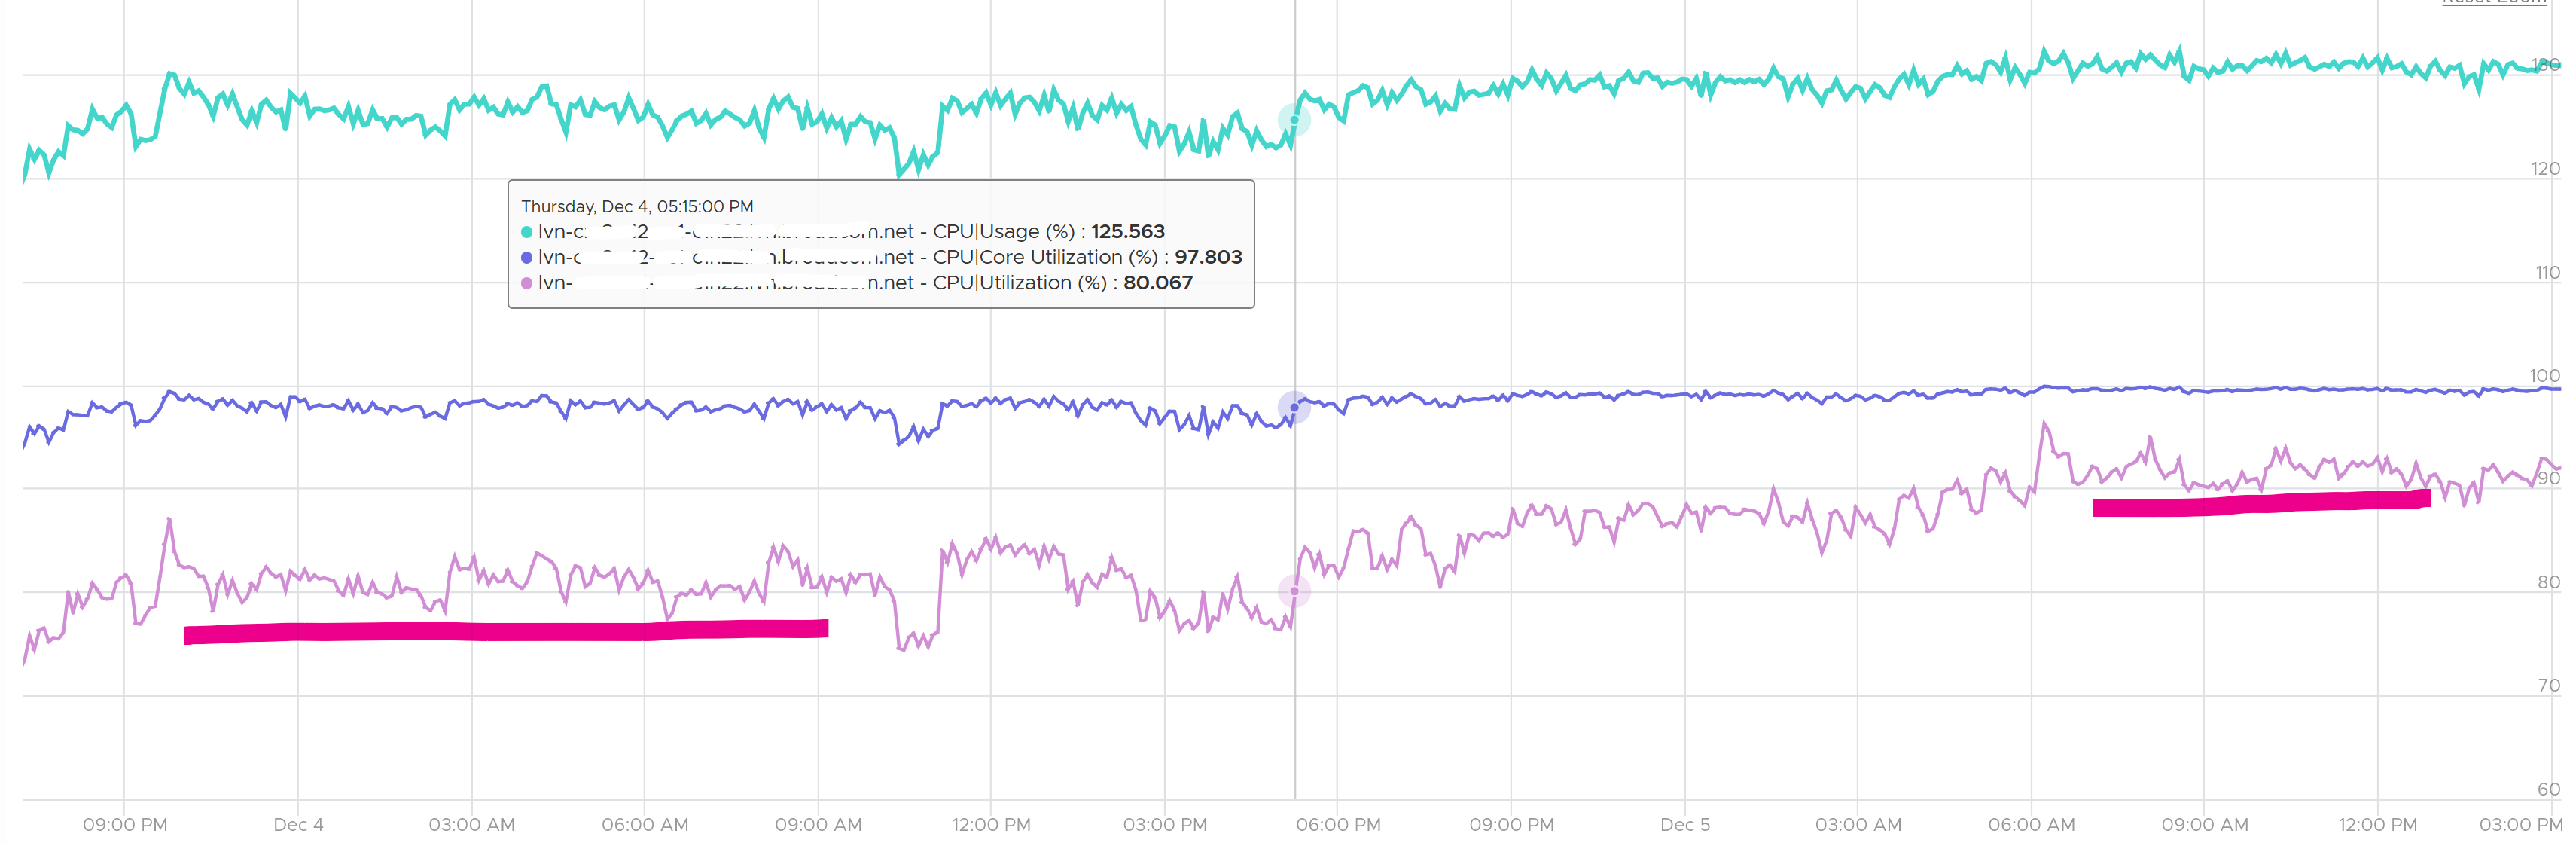
Notice the Utilization (%) metric went up from ~80% to 90%.
At around 80%, not all cores are running all the tiem. This means a few cores were idle, despite most cores running both threads. Yes, that indicate imbalance.
As Utilization (%) reach 90%, the Core Utilization got closer to 100%, which is the limit.
Usage (%) was constantly above 100%, as it’s compared with the base frequency. This indicates the CPU was constantly running above the nomimal speed. Notice the pattern of Usage is not as volatile as Utilization (%). The reason is hyperthreading only gains 1.25x.
Analysis
Unlike RAM, CPU performance varies widely among different CPU models. Speed matters in CPU, whereas in RAM we can generally ignore it. DDR5 RAM is faster than DDR4 but for general monitoring reason it can be ignored. Because of this significant difference in CPU, we need to have metrics to account for:
-
How often it runs.\
How much the CPU runs in a time period. E.g. if it runs 60% of the time in the last 100 seconds, that means it runs for 60 seconds accumulatively in that period. That’s why you see many metrics in millisecond. They track the consumption over time.
-
When it is running, how fast is the run.\
All else being equal, a 5 GHz CPU is 5x faster than a 1 GHz CPU. Throughput impacts utilization. The faster it can complete a task, the shorter it has to work. That’s why you see some metrics in MHz.
-
When it is running, how efficient is the run.\
CPU SMP impacts the core efficiency. This efficiency is then translated into MHz, for ease of accounting. Unfortunately, this simplification creates confusion as HT and Power Management are not the same thing.
These 3 dimensions of run are the reason why CPU consumption is hard to measure. It becomes “it depends on what you consider”. It can’t be a single number. Insisting that the CPU has a single, static, total capacity and use this as the only 100% for all use cases will result in confusion in “consumption” numbers.
Core vs Thread
If Core Utilization (%) is < 2x of Thread Utilization (%), you have imbalanced. Some cores are running 2 threads, while others are idle.
HT and power management is done at core level, not thread. This creates complexity in rolling up the counters at thread level to core level.
Let’s start. The basic unit is time, expressed in 20000 ms.
20000 ms = 100% at the core level. This means the value remains 20000 if you disable HT.
Since there are 2 threads, what happens when both are idle?
You assigned Idle = 10000 ms for each.
When one of the threads is running hot, the highest the Used value of the thread can go is 20000. This means the CPU frequency doubles. What happens to the paired thread then? Does it show 0 ms? I am yet to test here.
At thread level, 100% Used = 20000 ms, while 100% Idle = 10000 ms. This creates confusion when you work at thread level.
Thread Utilization
It’s easier to think the metric Utilization (%) as Thread Utilization (%), so I’m going to refer to it as such.
You’re welcome.
| At a thread level | This is the most basic counter. It’s the ESXi equivalent of VM CPU Run. It tracks at a single physical thread level. At any given moment, a thread is either running (unhalted) or not (halted). So it’s binary (0% or 100%). Using a human analogy, think of it as a person who is either running or standing, and never walking. It’s not considering CPU Frequency nor HT. Over a time period, the value is averaged. So when you see the number as 50%, it does not mean it’s running 100% at half the “speed”. It means it’s running half the time, which is why the original counter is in millisecond and not percentage. This metric is only relevant when hyper-threading is enabled. |
|---|---|
| At a core level | Core Utilization, as the name implies, rolls up at the core level. It is a simple metric. If one of the threads is running, then this metrics reports 100%. This is logical as the core is indeed running. If both are running, this metrics also reports 100%. I agree that reporting the same number on 2 different scenarios will certainly cause confusion. |
Let’s apply the above into an example. We start with a single core of a physical socket. The socket may have many cores; we are just interested on 1 core only. The core has 2 threads as it supports CPU SMT.
In a time period of say 20 seconds[^12], this core had the following consumption:
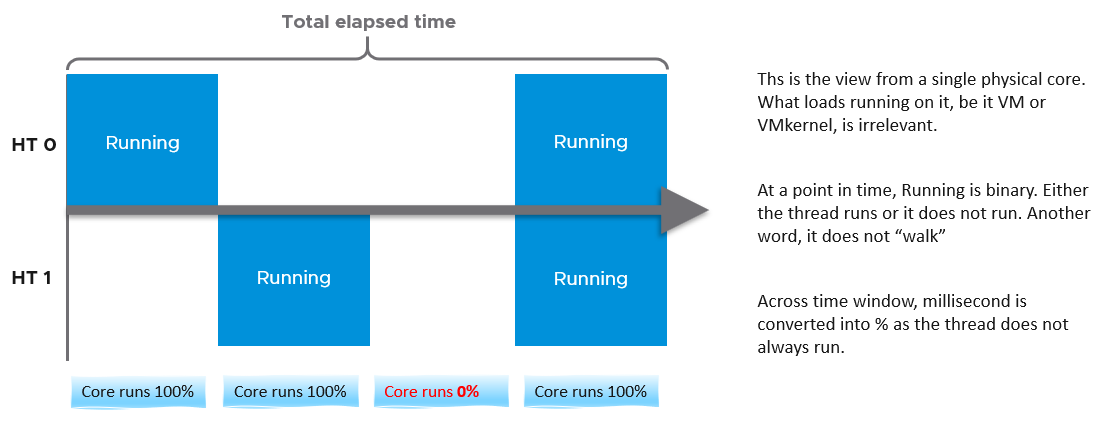
Going back to our example, here are metrics reported:
-
Thread Utilization (%) for HT 0 = 10 seconds / 20 seconds = 50%
-
Thread Utilization (%) for HT 1 = 10 seconds / 20 seconds = 50%
-
Core Utilization (%) for entire core = 15 seconds / 20 seconds = 75%
BTW, in vSphere Client performance tab, you can’t select a core if you enable HT. You can only choose PCPU, which is a thread. So what happens on the Core Utilization counter at thread level?
Does it get split into half?
As you can see below, no. The value is duplicated.
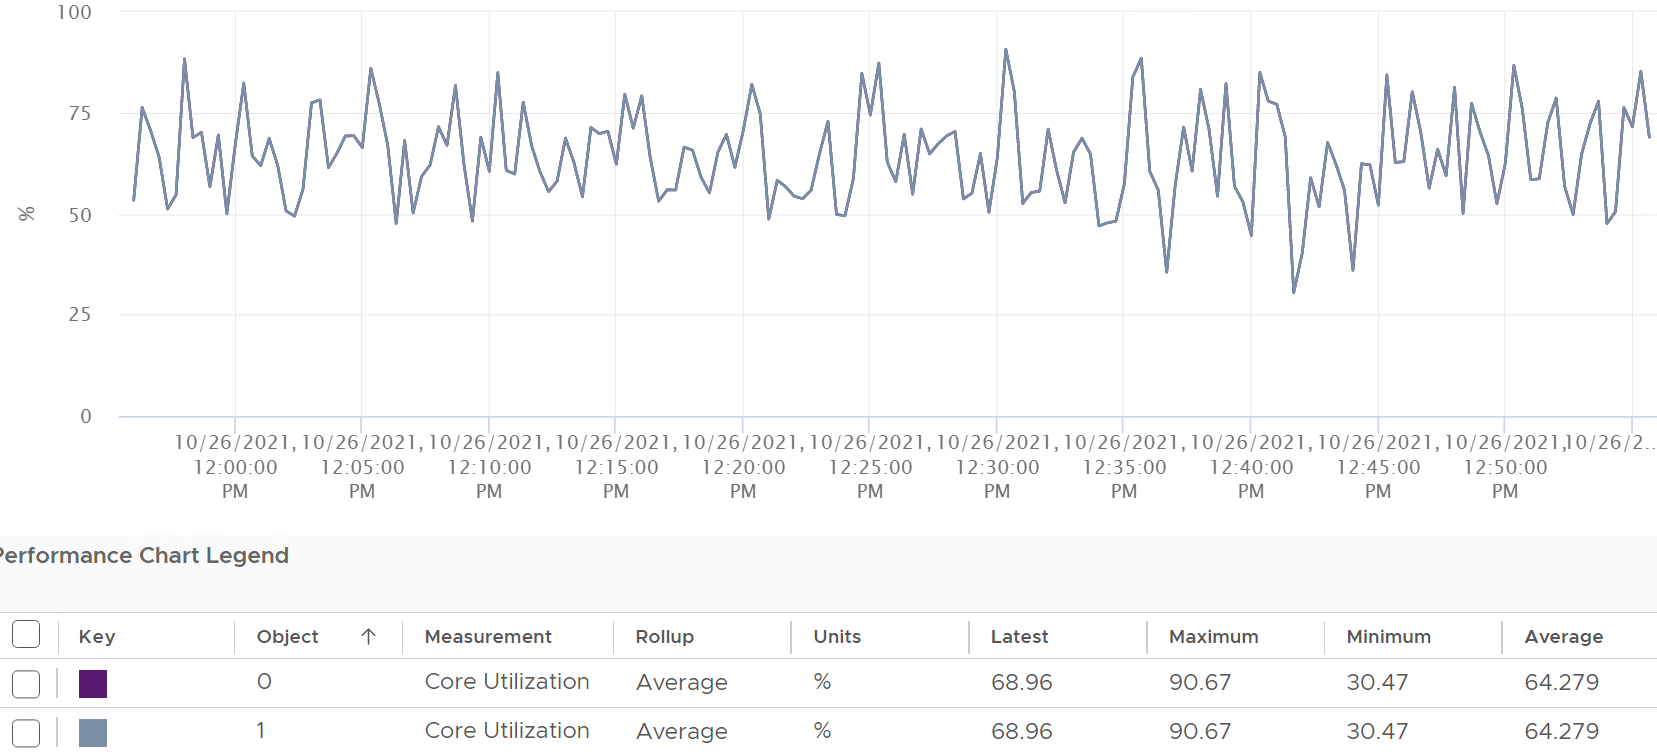
Notice in the above chart, the 2 have identical value.
Thread Utilization (%), on the other hand, will be different. Each thread has different value.
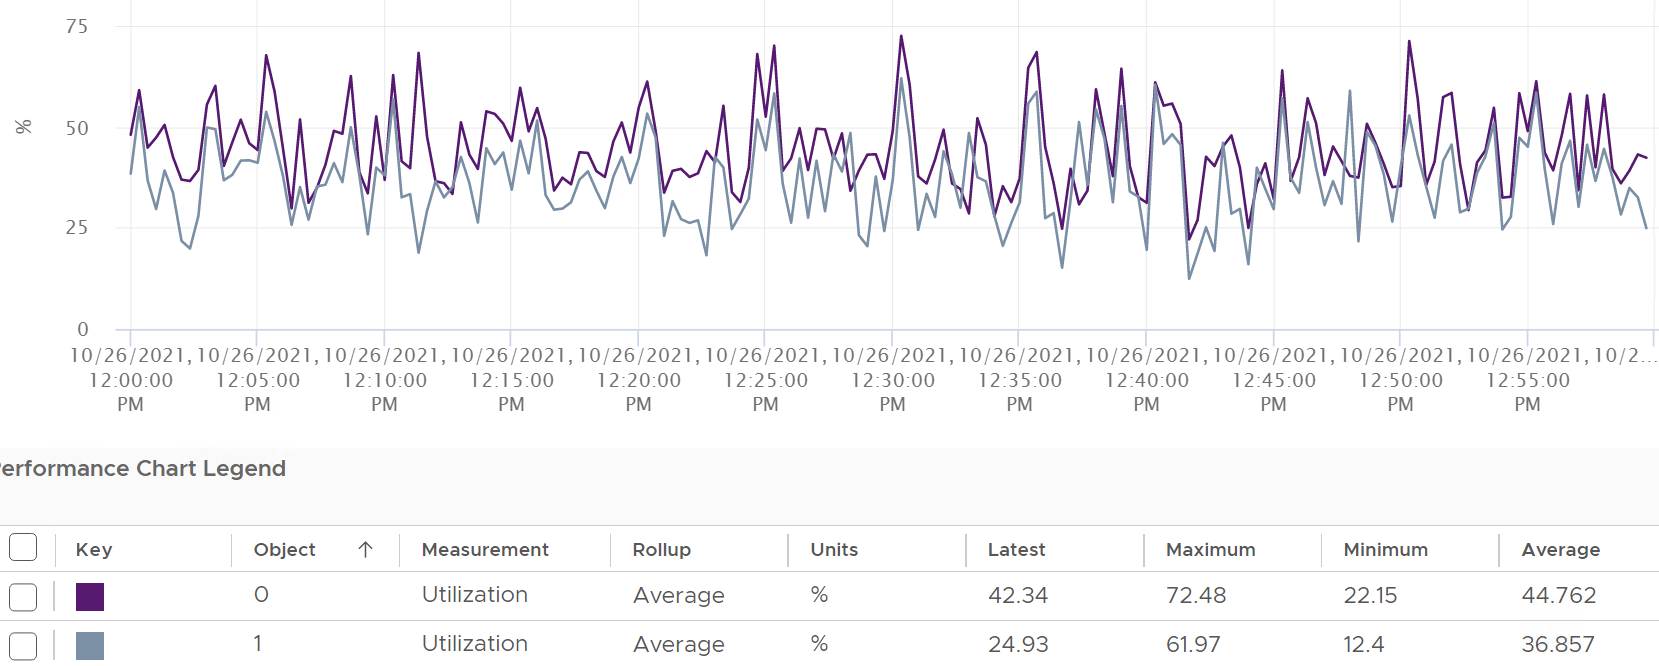
If you simply sum them up, you get more than 100%, so don’t! Their context is a single thread.
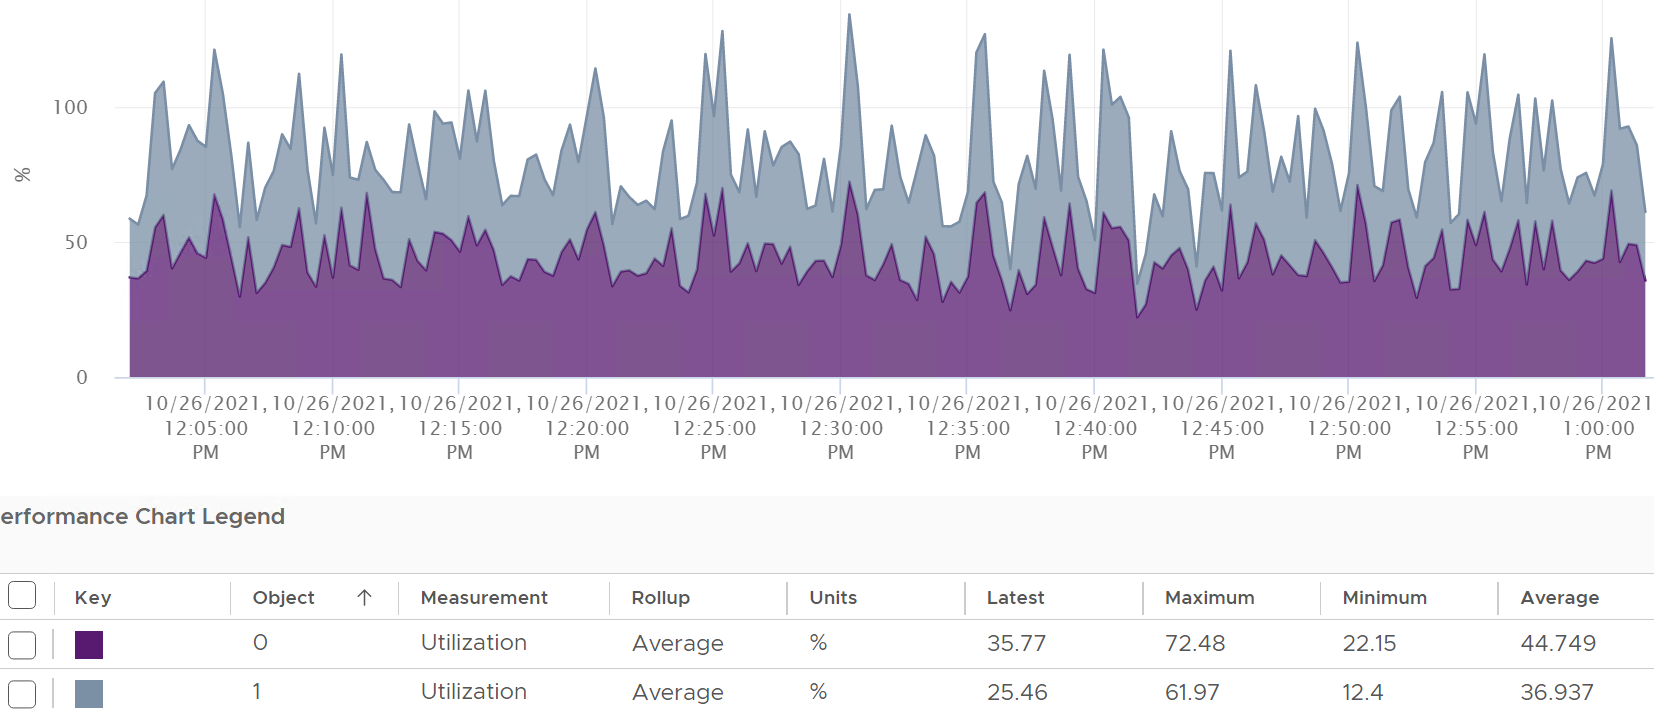
Now let’s roll this up to the ESXi level. The following shows a tiny ESXi with 2 cores, where each core has 2 threads.
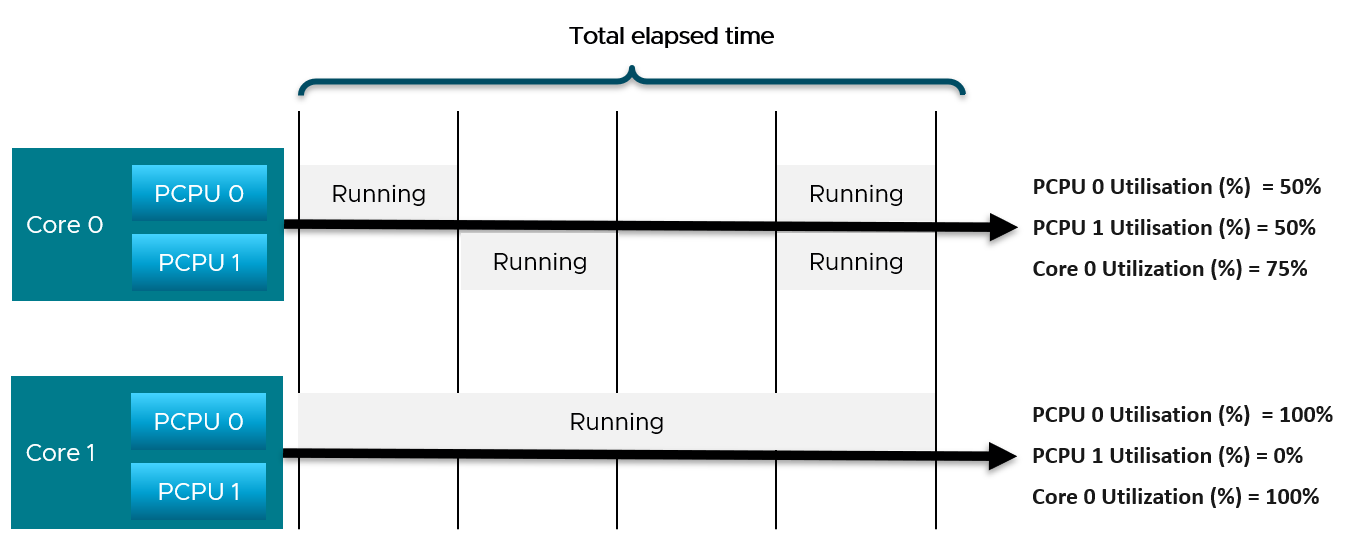
The metrics at ESXi level is
-
CPU Thread Utilization (%) = (50% + 50% + 100% + 0% ) / 4 = 50%.
-
CPU Core Utilization (%) = (75% + 100% ) / 2 = 87.5%
Thread Utilization = 50% because each thread is counted independently. There are 4 threads in the preceding ESXi, each runs 50%, so the average at ESXi level is 50%. This counter basically disregards that HT does not deliver 2x the throughput.
This is why the Core Utilization (%) will tend to be consistently higher than Thread Utilization (%). The following chart demonstrate that.
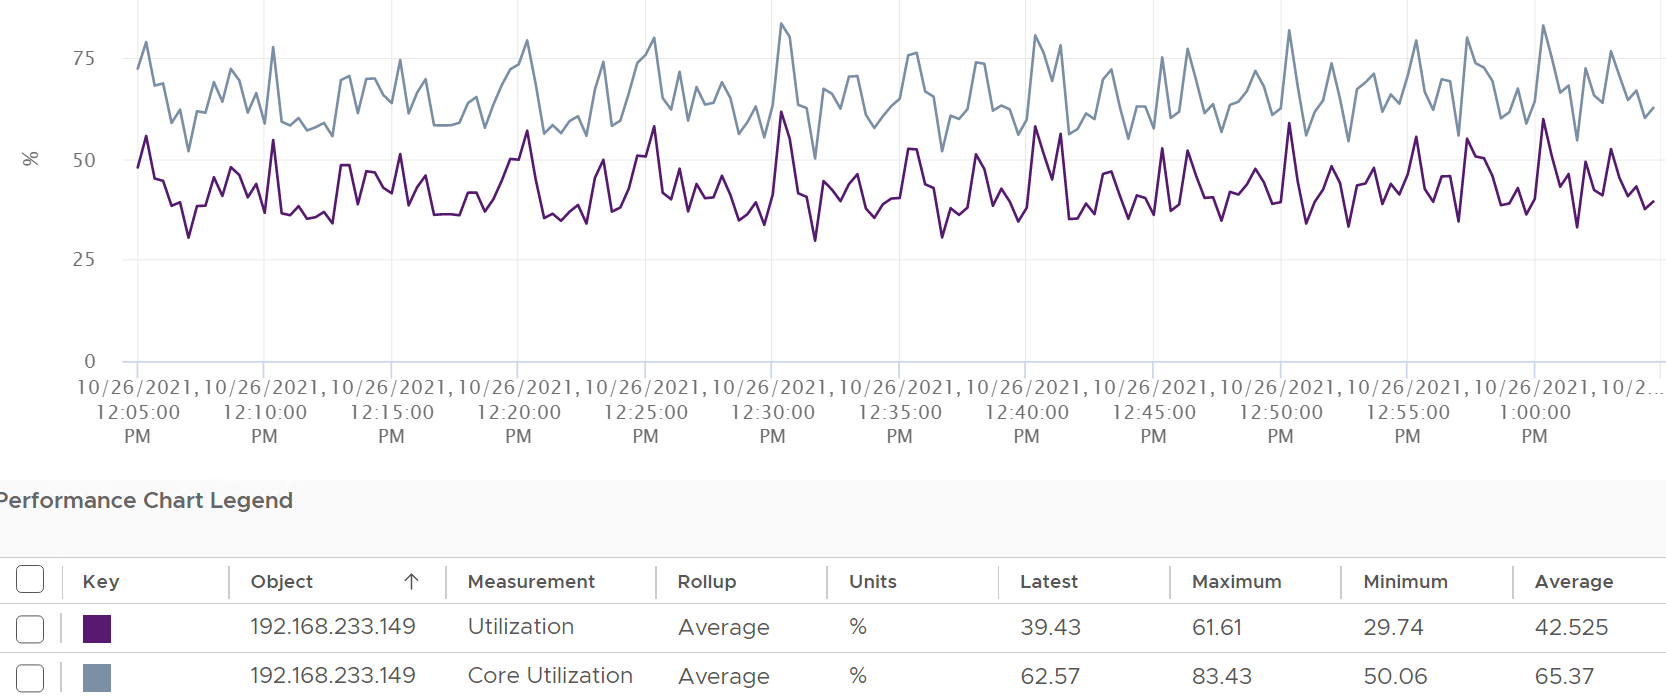
Now let’s go back to the chart shown earlier. Can you now explain Thread Utilization (%) and Core Utilization (%)?
Great! Let’s move to the next one.
In the following example, this ESXi has no hyper-threading. What do you notice?
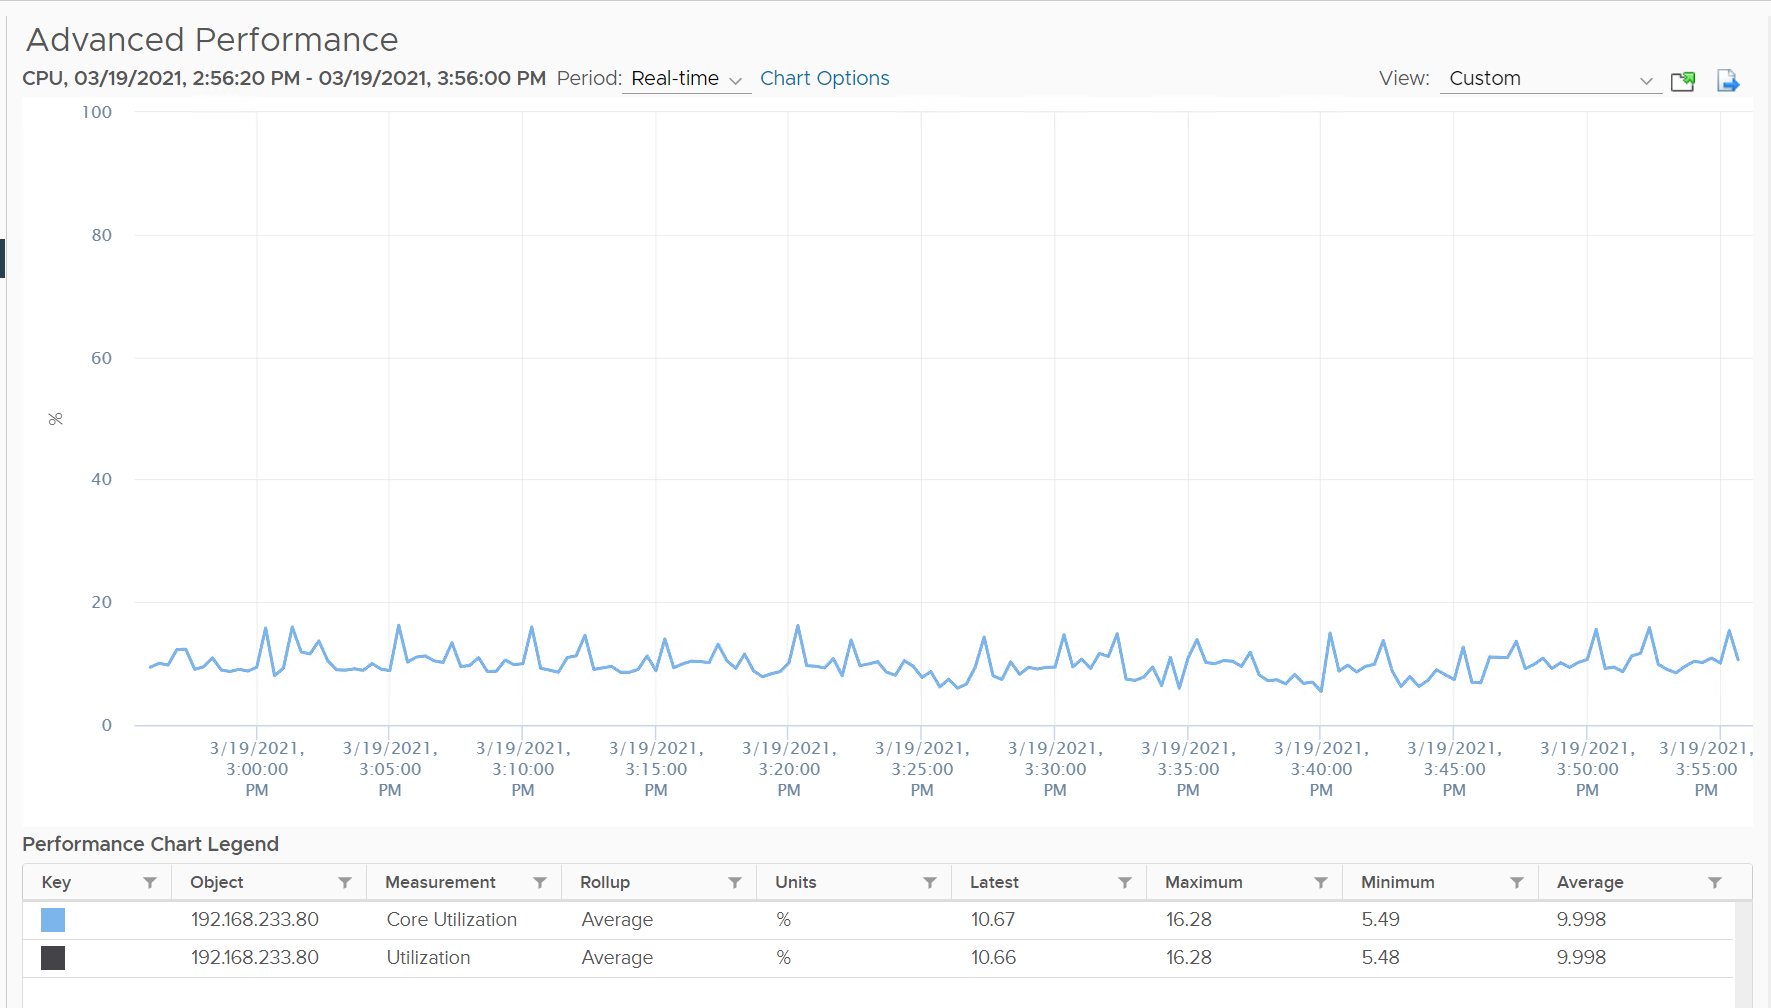
Yup, the Core Utilization is identical with Thread Utilization.
Peak Core CPU Usage
An ESXi with 72 CPU cores will have 144 threads. You will not be able to see when a single core peak at ESXi Host level as it’s the average of 144 metrics. If you are concerned that any of them is running hot, you need to track the peak among them.
Imbalance among the cores happen because when a VM runs, it runs on as few core as possible, not spread out to all ESXi cores. It’s more efficient to schedule that way, as will requires less context switches.
The following shows an ESXi where 3 of the threads hit >90%
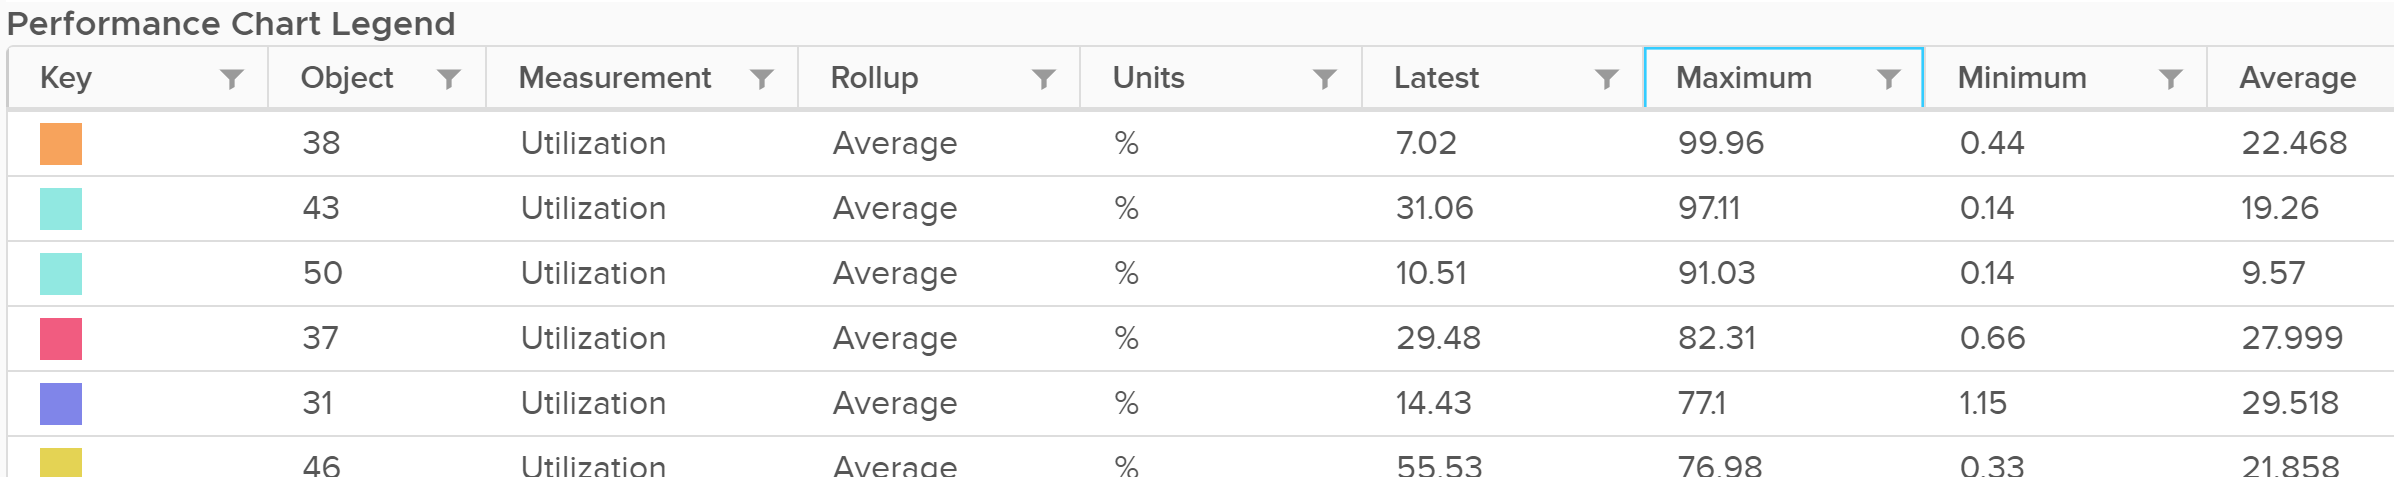
The average, however, is low. The total usage can hit 5600% as there are 56 threads, hence the total is only hovering 1100%, which translates into 20%.
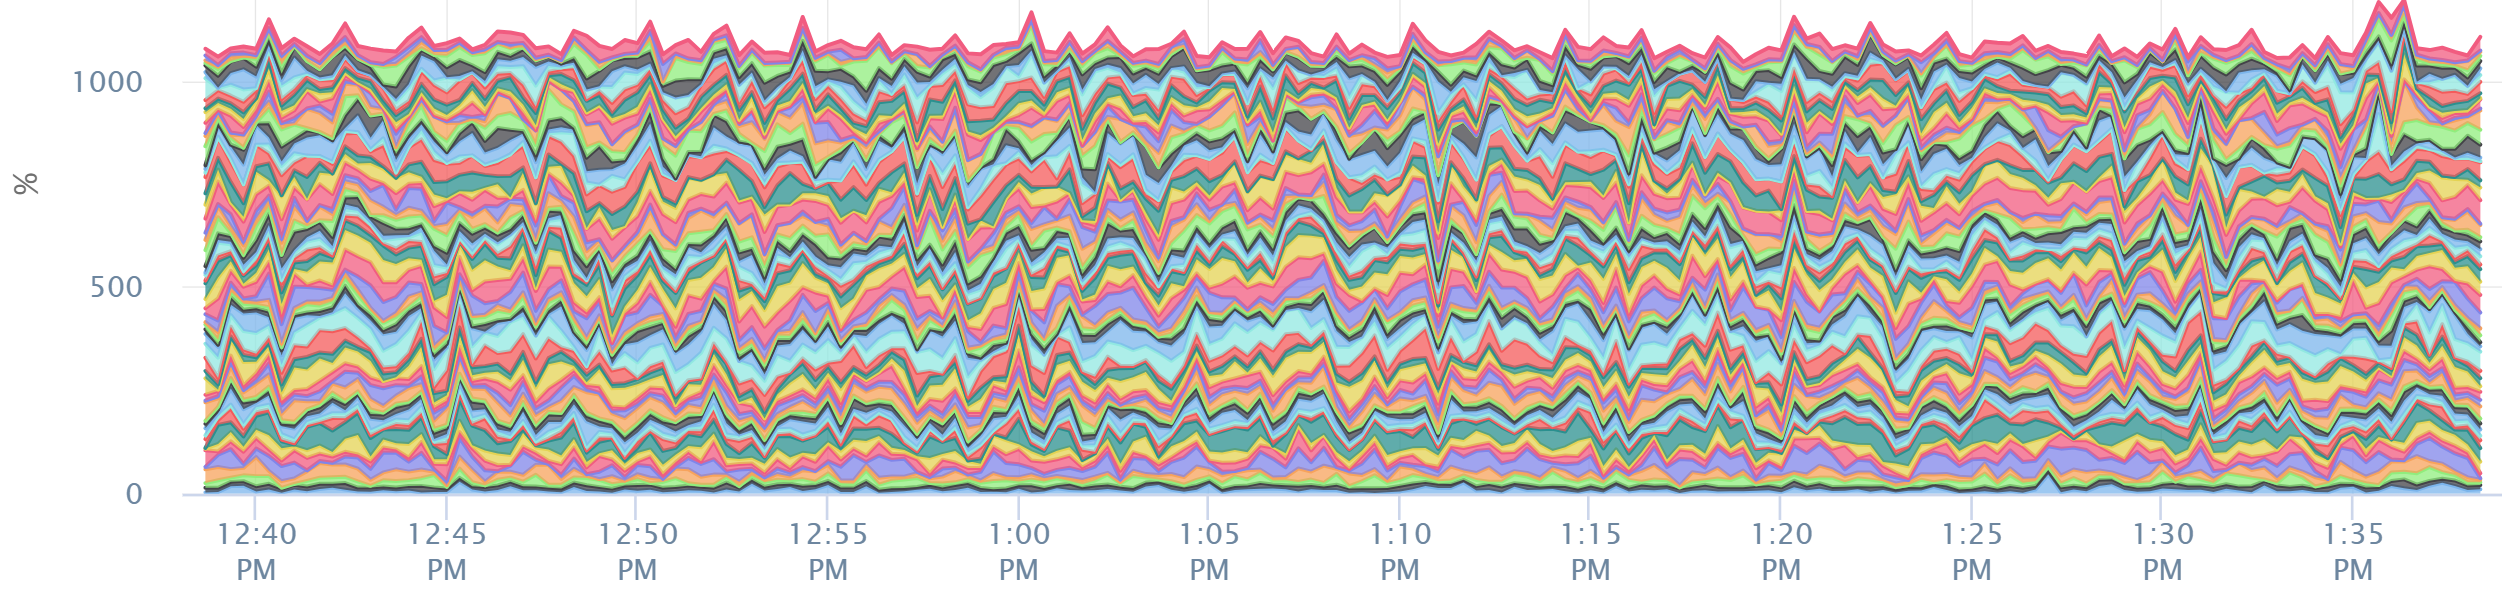
Peak CPU Core Usage (%) tracks the highest CPU Usage among the CPU cores. A constantly high number indicates that one or more of the physical cores has high utilization. So long the highest among any cores at any given time is low, it does not matter which one at a specific point in time. They can take turn to be hot, it does not change the conclusion of troubleshooting. Max() is used instead of 95thpercentile as both result in the same remediation action, and Max() can give better early warning.
The imbalance value among the cores is not needed because it is expected when utilization is not high.
Used | Usage
You are now ready to tackle the next metrics, which are Used (ms), Used (%), Usage (%) and Usage (MHz). Used (%) is used in esxtop, while vSphere Client UI uses the other 3 metrics.
vSphere Client uses the name Used instead of Usage. But in the metrics chart page, it uses Usage. As a result, I’m going to assume that Used (MHz) = Usage (MHz) as vSphere Client UI uses them interchangeably. While I’ve found differences in rare cases, it is safe to take as Usage = Used.
I only see the use case for Usage (MHz). The other 2 units (second and percentage) are not needed. Using millisecond is hard to account for “how fast you run” and “how efficient you run”. With MHz, we gain an additional dimension, which is speed. We can plot the speed across time.
If you have a specific need on Used (ms), Used (%) and Usage (%), reach out to me with the reason and happy to provide the documentation on these 3 metrics.
Usage (MHz) relates to Utilization in a similar way that VM Usage metric relates to VM Run metric. The difference is a physical thread does not experience overlap, and system is not applicable as it’s run in the kernel.
Here is how Utilization and Usage are related at PCPU level:
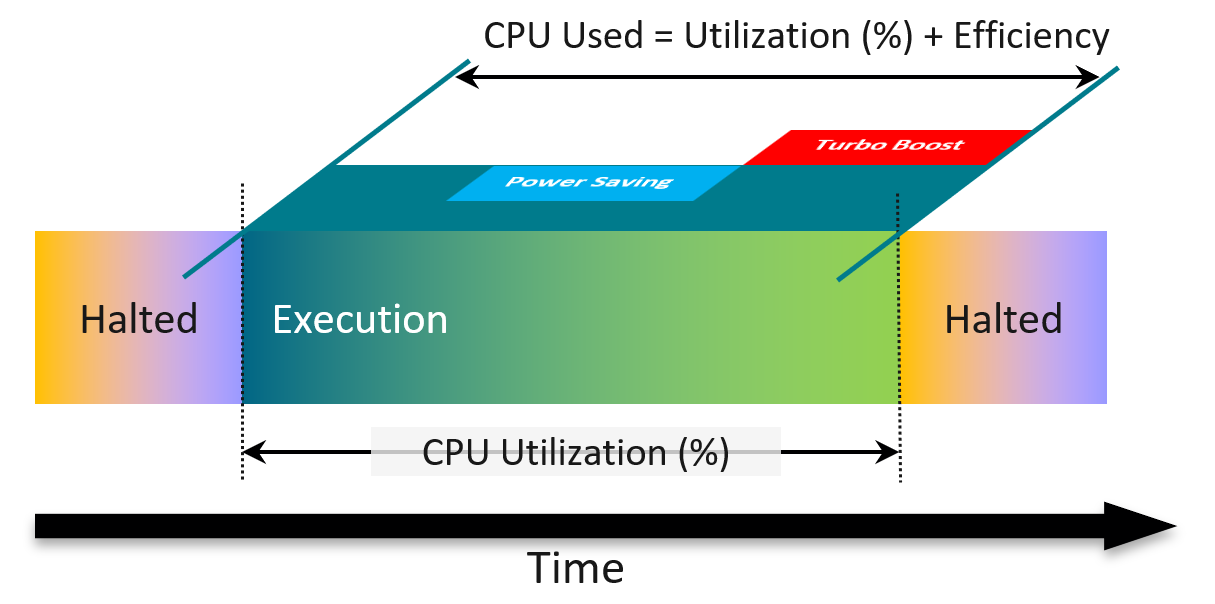
Used is calculated based on a hardware counter called Non-Halted Core Cycle (NHCC). Logically, the higher the CPU clock speed, the more cycles you complete. That’s why the value gets higher in turbo boost.
From the diagram above, you can see that Usage accounts for 2 factors that Utilization does not:
-
A physical thread is either executing (running) or halted (idle). Its execution will be less efficient if its paired thread is also running at the same time.
-
While it’s running, it can run at lower/higher CPU clock speed due to power management.
Usage
vCenter adds this counter, meaning it does not exist at ESXi level.
You see both the Capacity of 35.18 GHz and Used of 11.3 GHz. There is no concept of Usable Capacity in vSphere, so the Free amount is basically Capacity – Used.
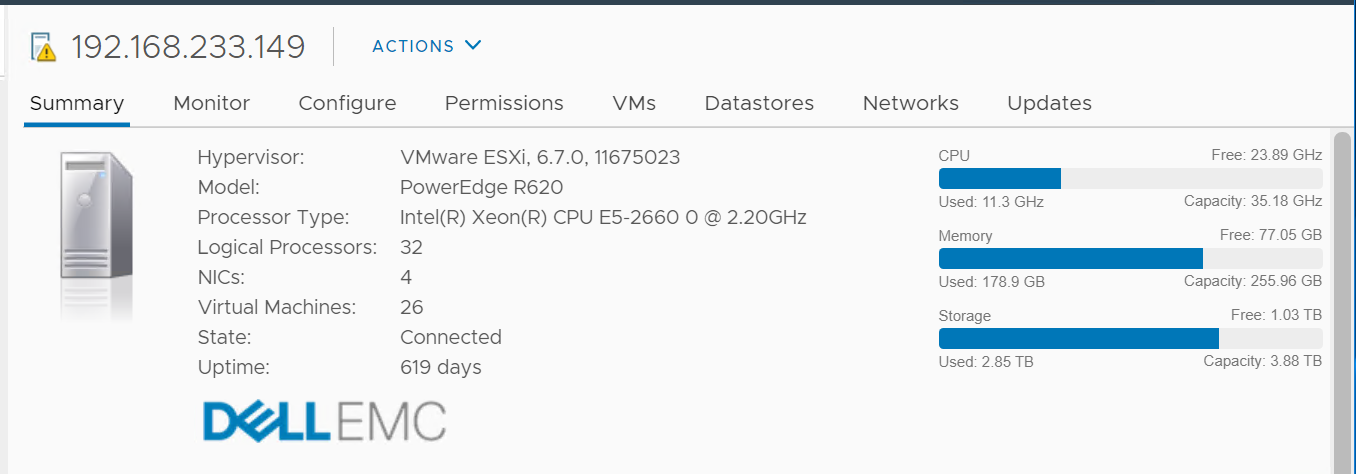
The Used CPU is summary.quickStats.overallCpuUsage.
The value above is likely some average of say 5 minutes as it remains static for a while, and it does not exactly match the number below as the roll up period is not the same.
Usage and 100%
Usage no longer capped at 100% of total capacity at the nominal frequency. This was fixed in Aria Operations 8.18. In a highly utilized host, you will see Usage exceed it. This is indeed a desirable situation as you bought the host to be used as much as possible.
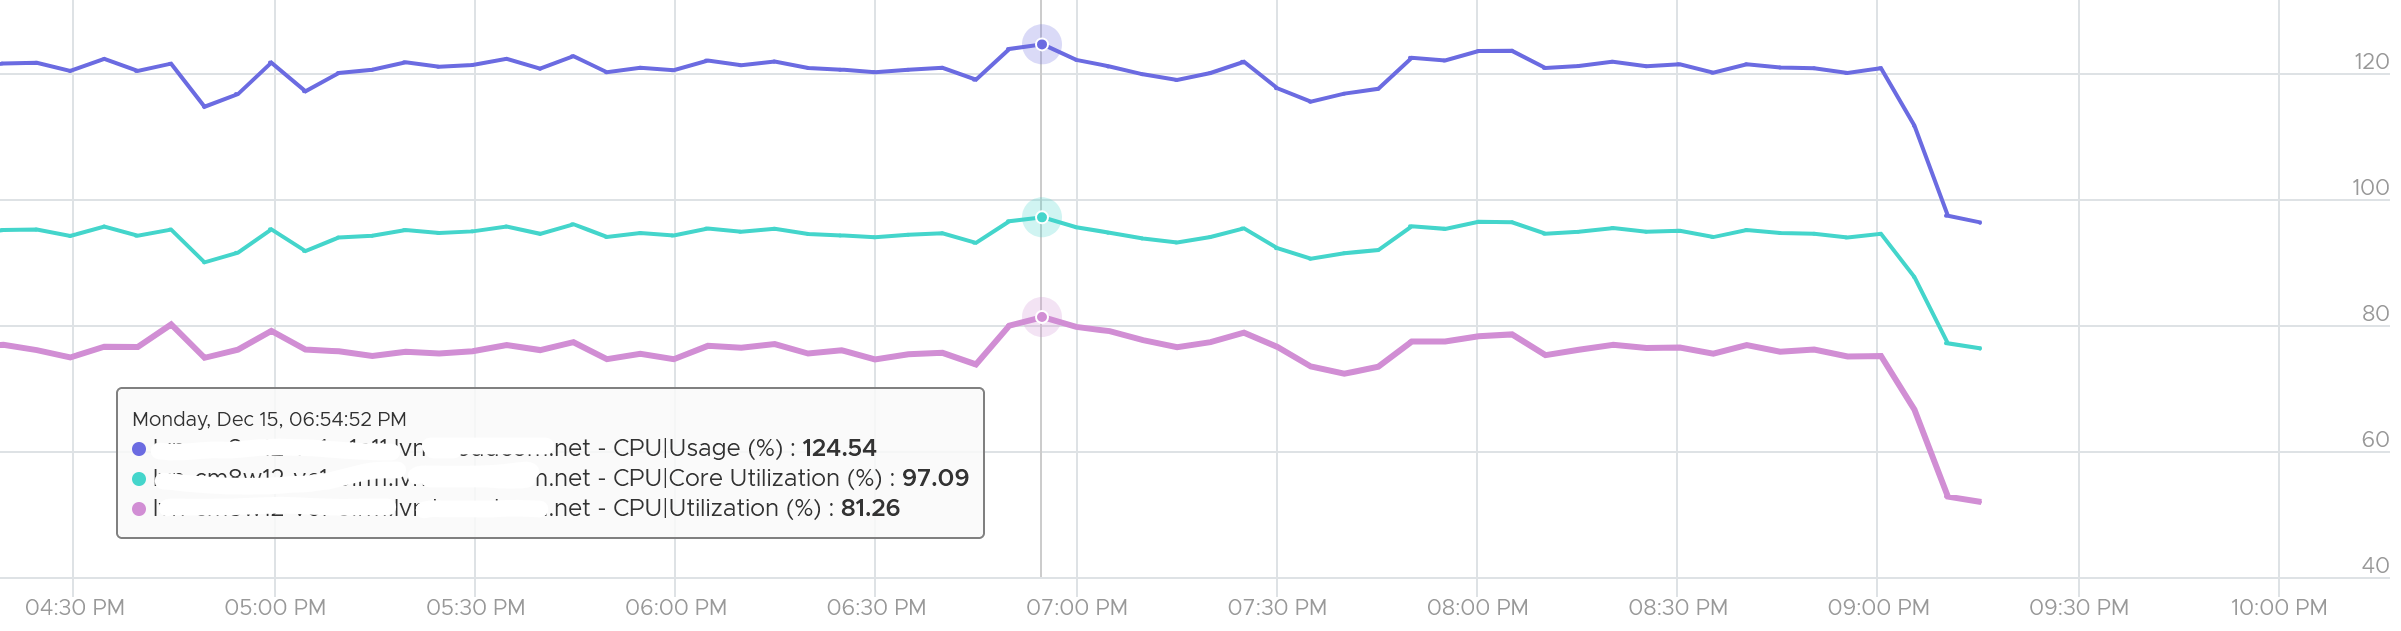
Consumed
When vSphere UI lists ESXi Hosts, it typically includes the present utilization. It lists the metrics as Consumed CPU (%) and Consumed Memory (%).
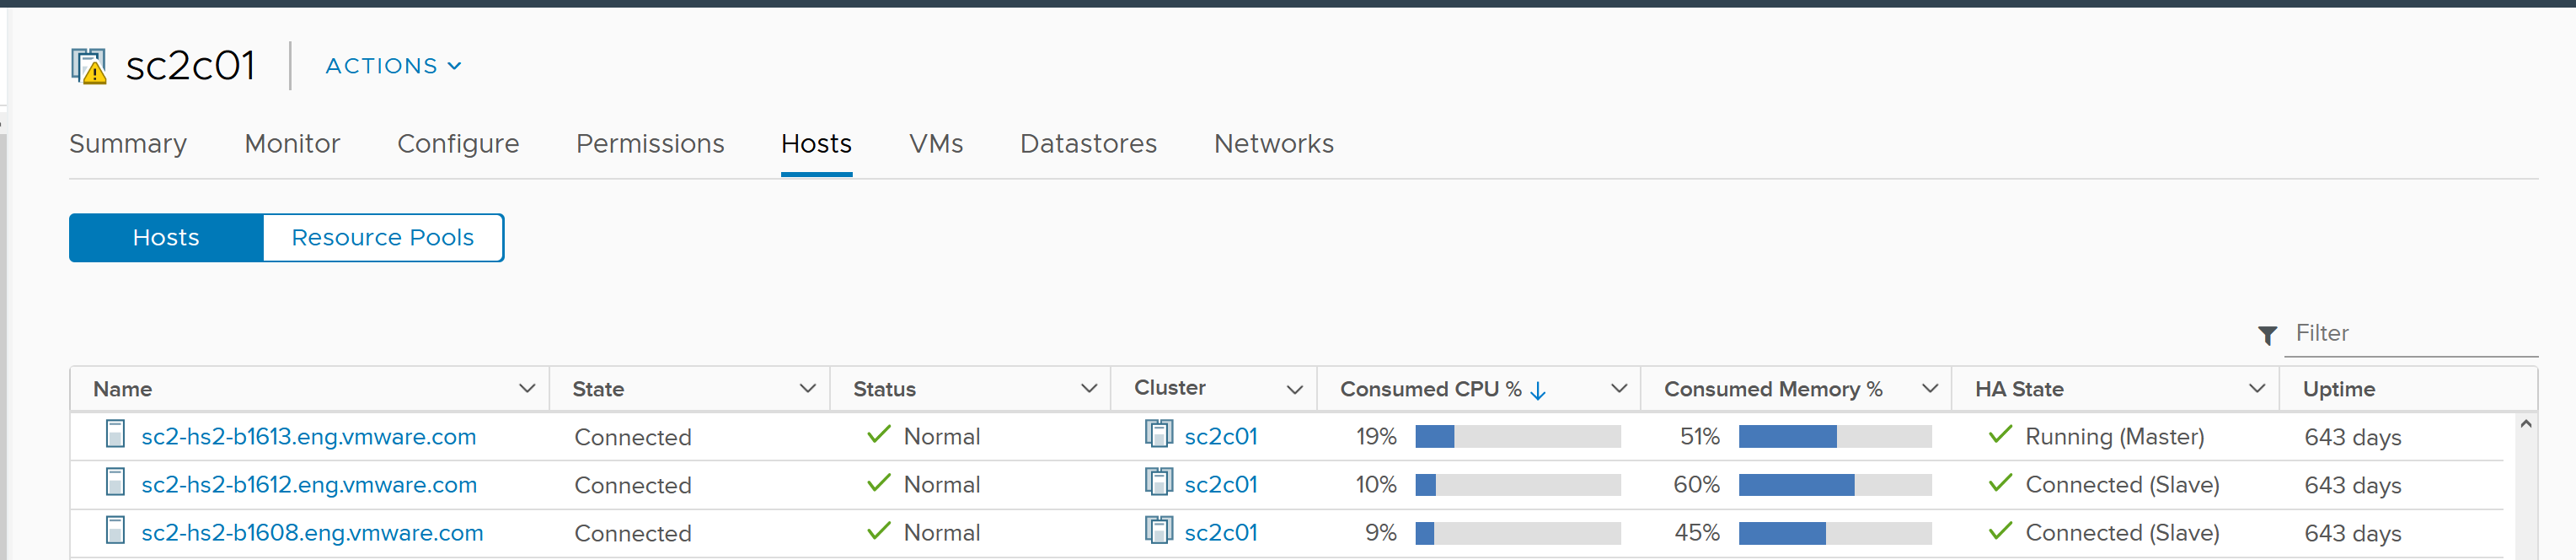
Consumed CPU maps to CPU Usage (%). Consumed Memory (%) maps to Memory Consumed (KB).
To confirm it, simply plot CPU Usage value. The last value is what you see at the table.
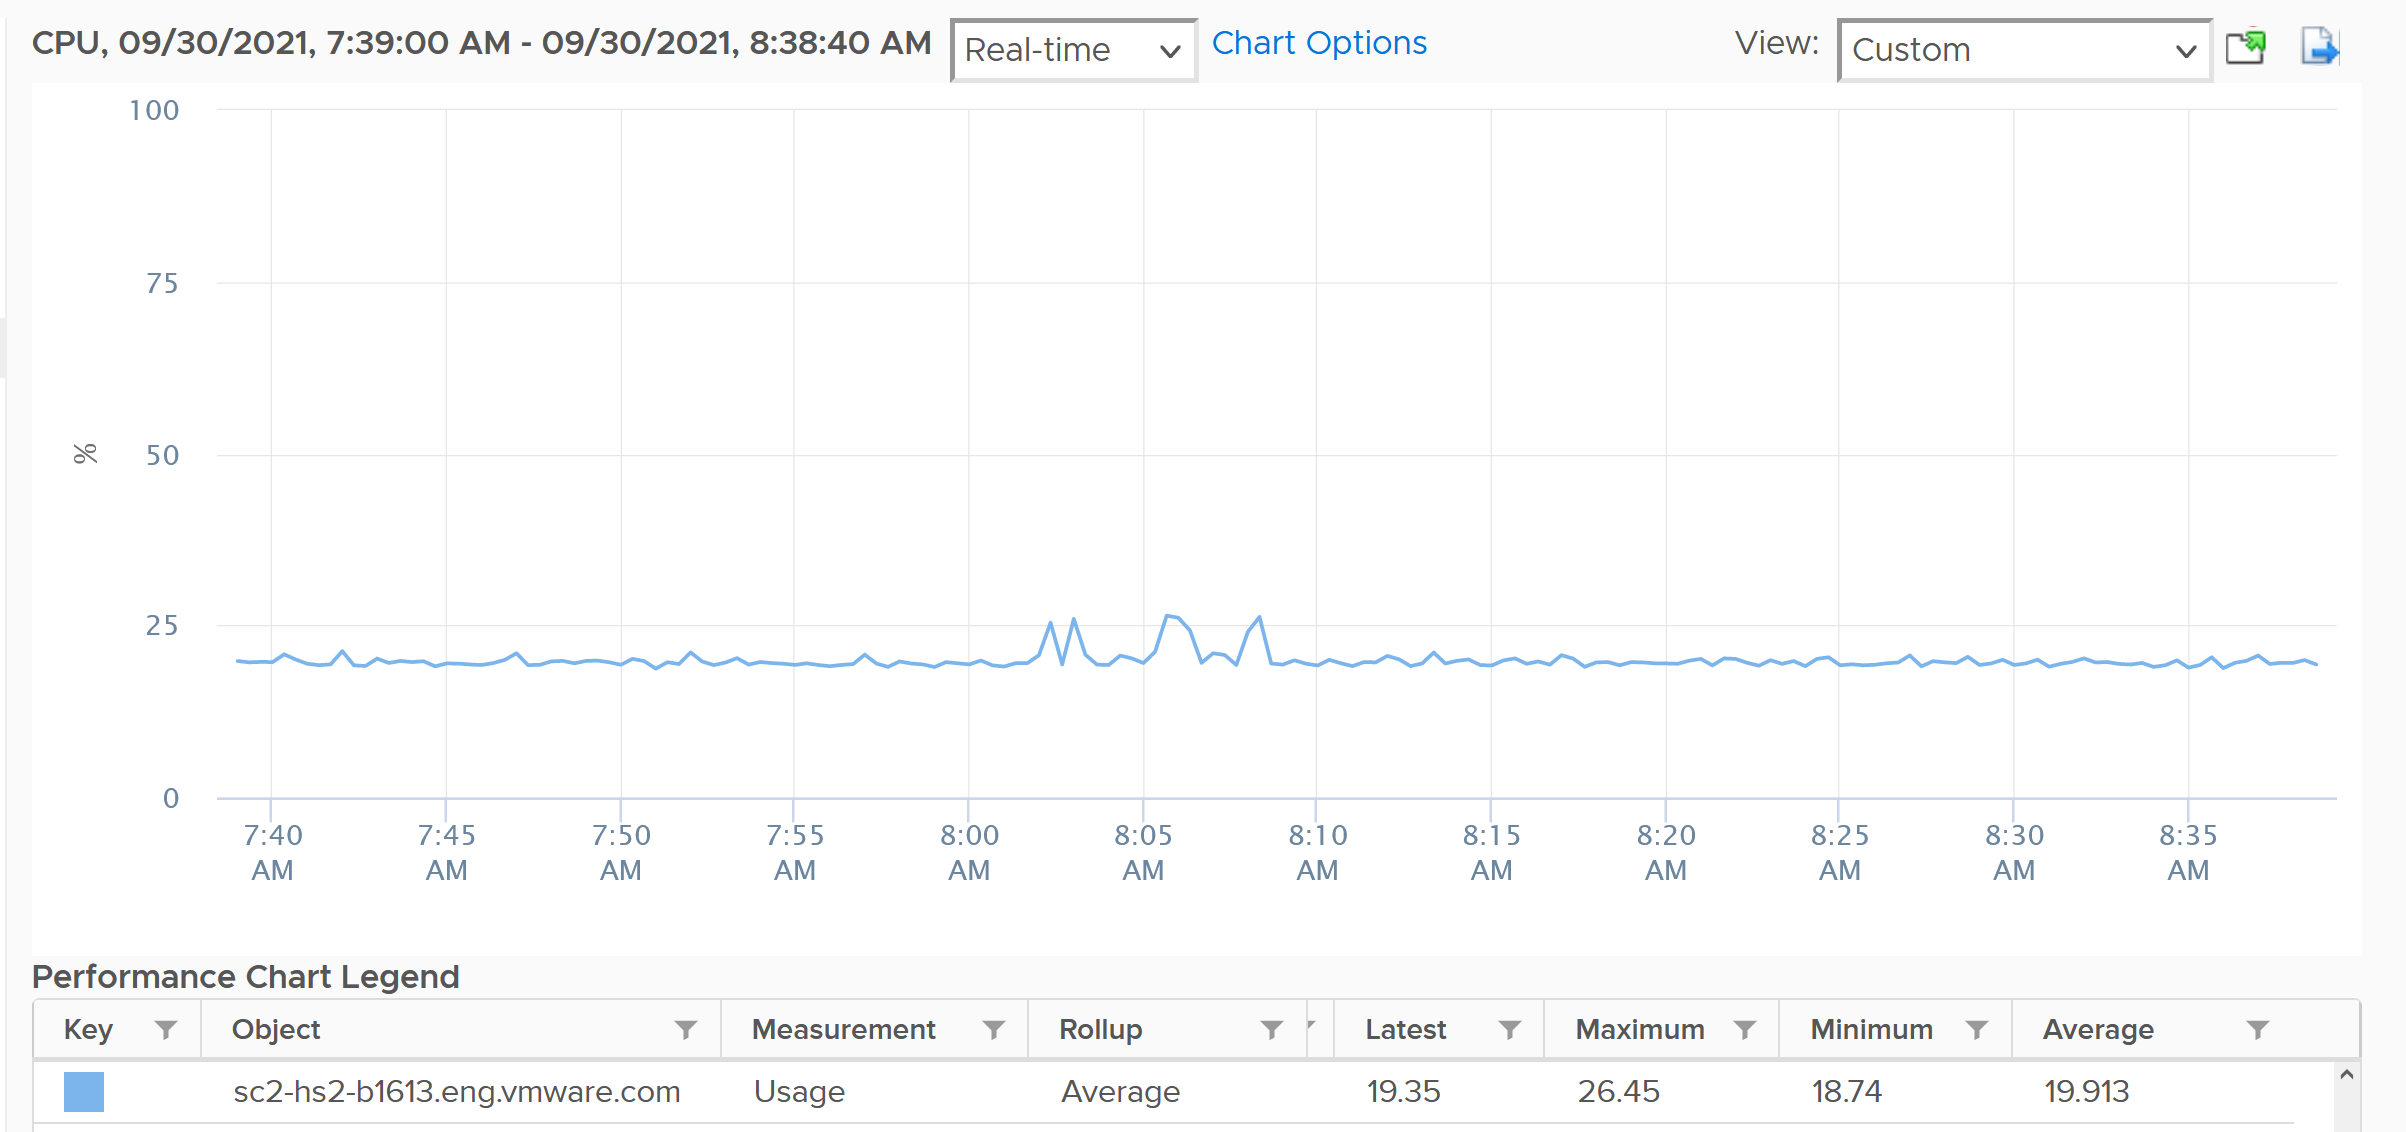
You also see them in vSphere Host Client.
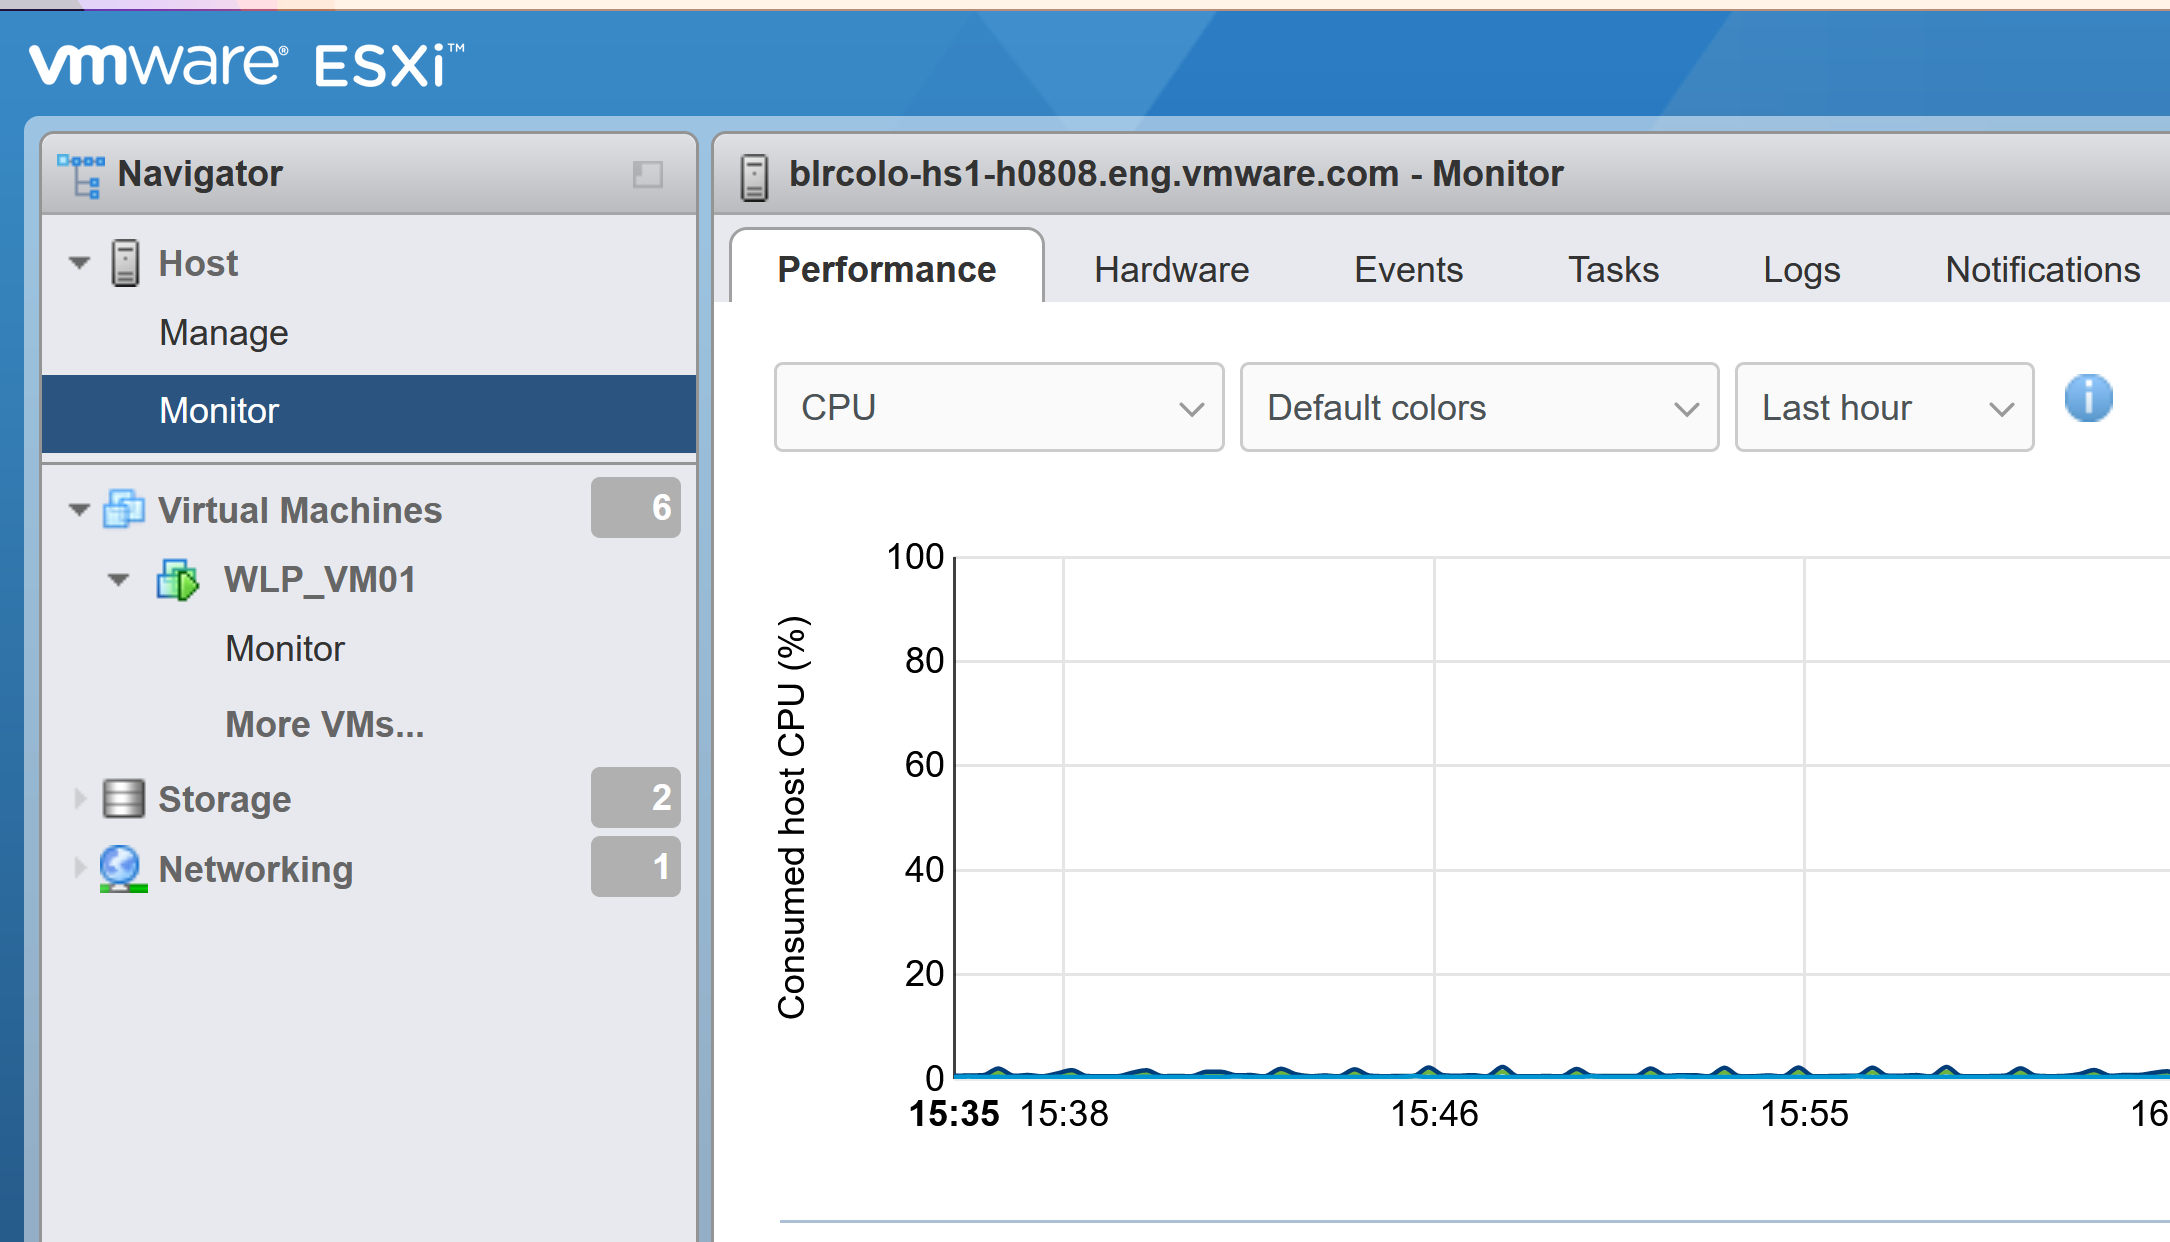
As a bonus, you get the breakdown by CPU package.
Demand
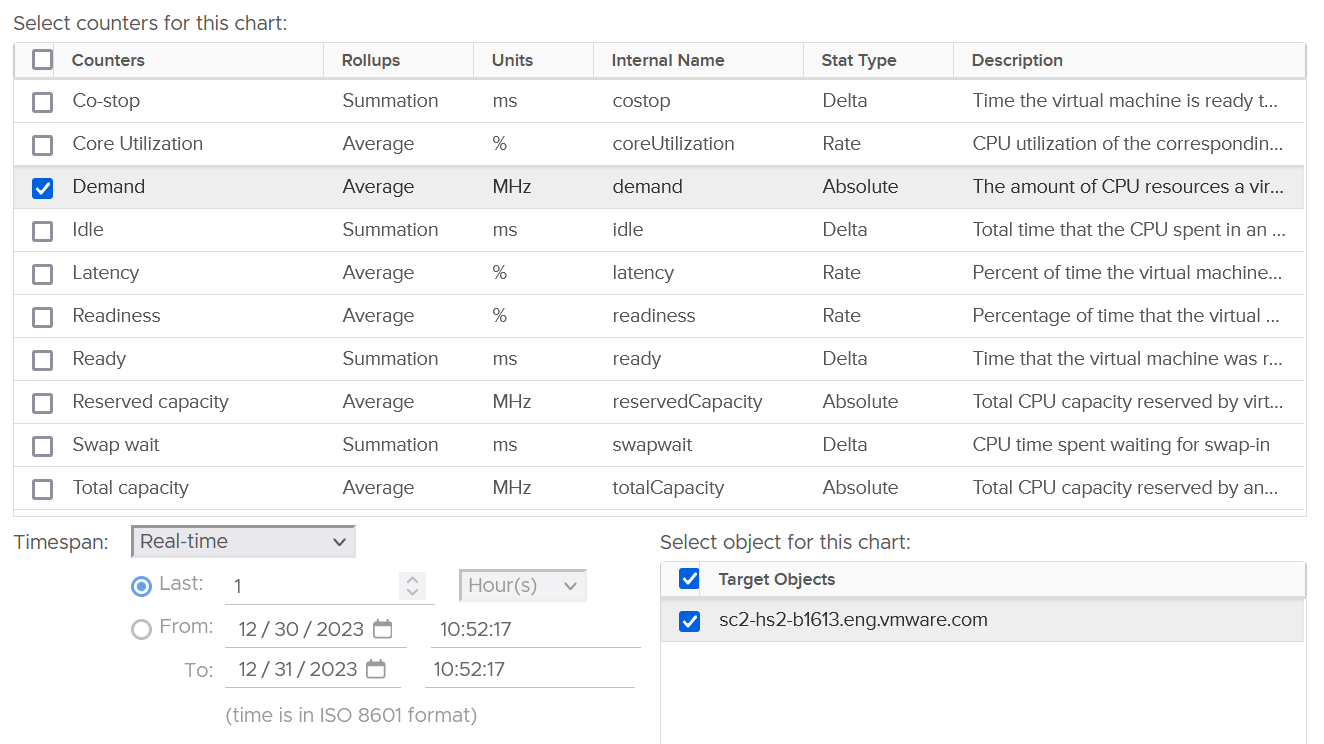
This is an internal counter. It’s for the kernel CPU scheduler to optimize the running of VM as the kernel is aware that hyper-threading has performance impact. As a result, demand looks at different context than Utilization/Used. The value you see at ESXi is the summation of all the VMs, not physical threads.
Demand is consumer-view, while Usage is provider view. Now you know why Demand is not available on a per-core or thread basis. If a host has no VM, Demand will show flat 0. Usage will not show 0 as it includes the kernel.
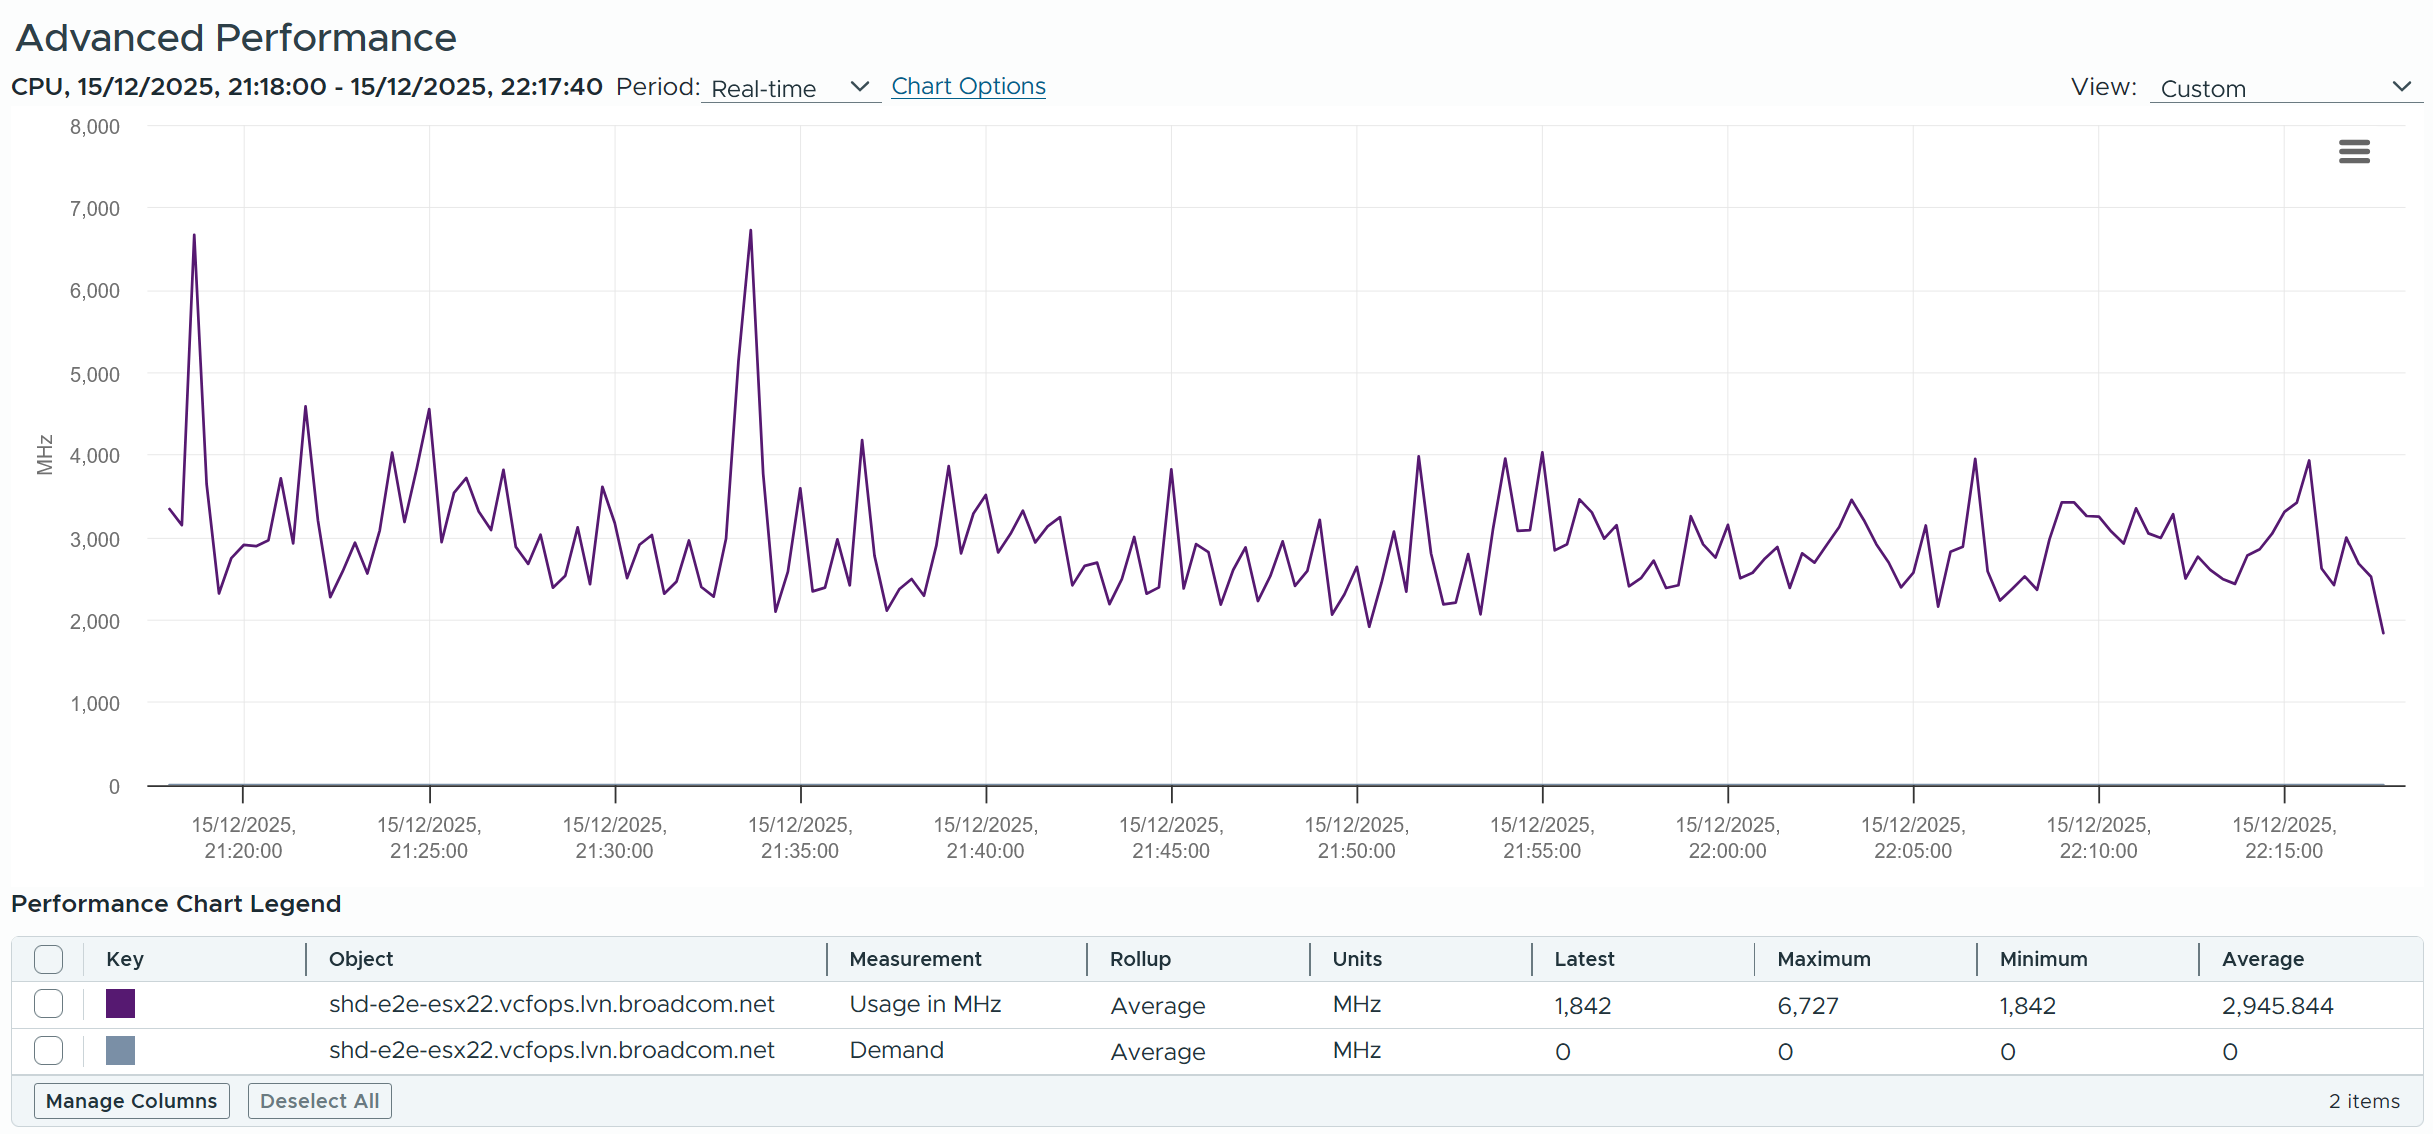
Demand includes the reservation by VM.
Usage includes kernel actual utilization. The following shows Demand remains perfectly flat at 10.21% for weeks. The ESXi has 0 running VM. The only explanation is the kernel reservation.
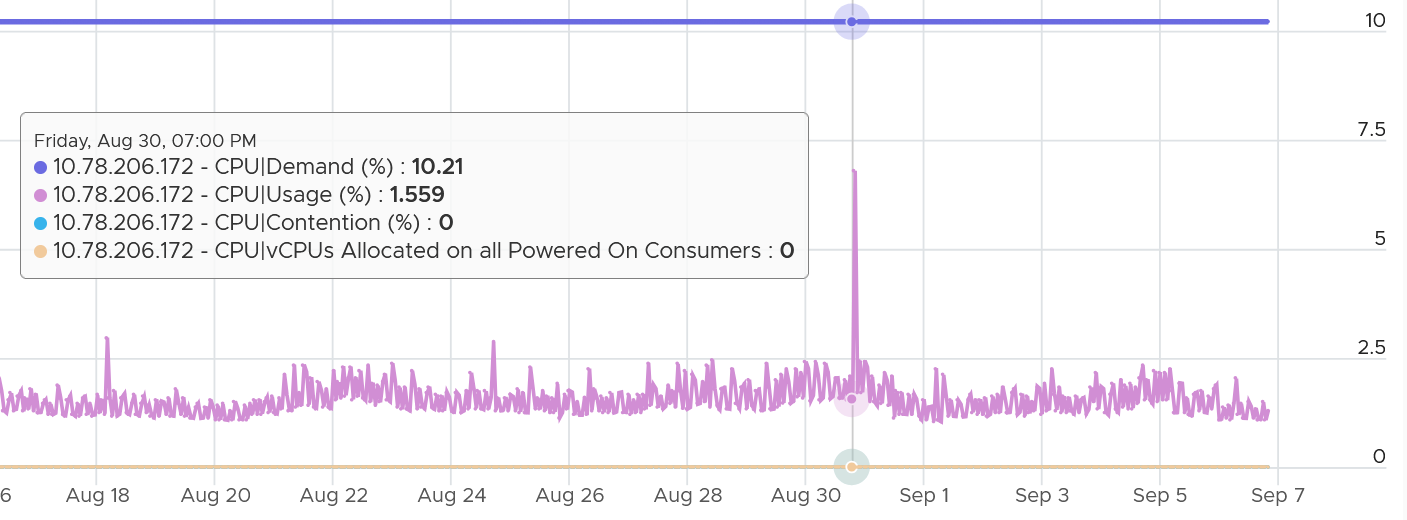
The following chart shows the same ESXi, where the Demand (MHz) = Overhead (MHz). Overhead tracks the kernel reservation.
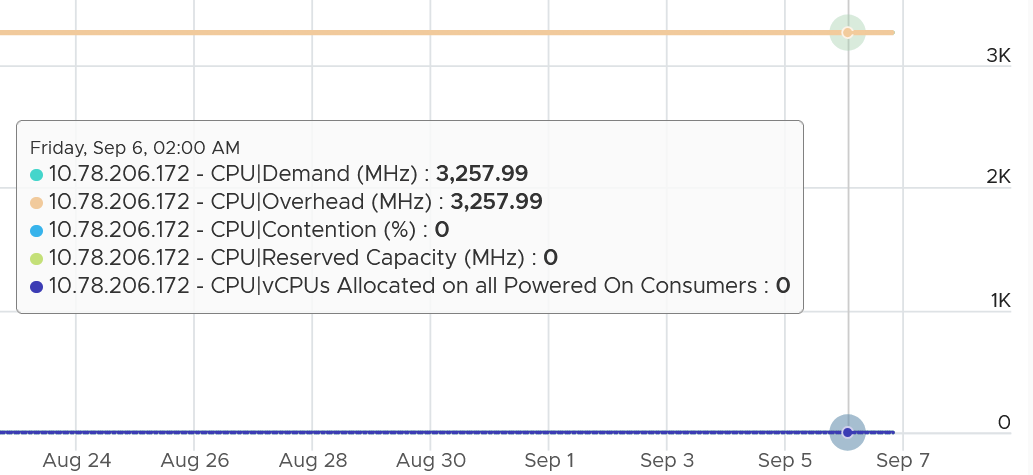
If the kernel reservation is lower than the kernel utilization, then Demand could be lower than Usage. The following example shows that.
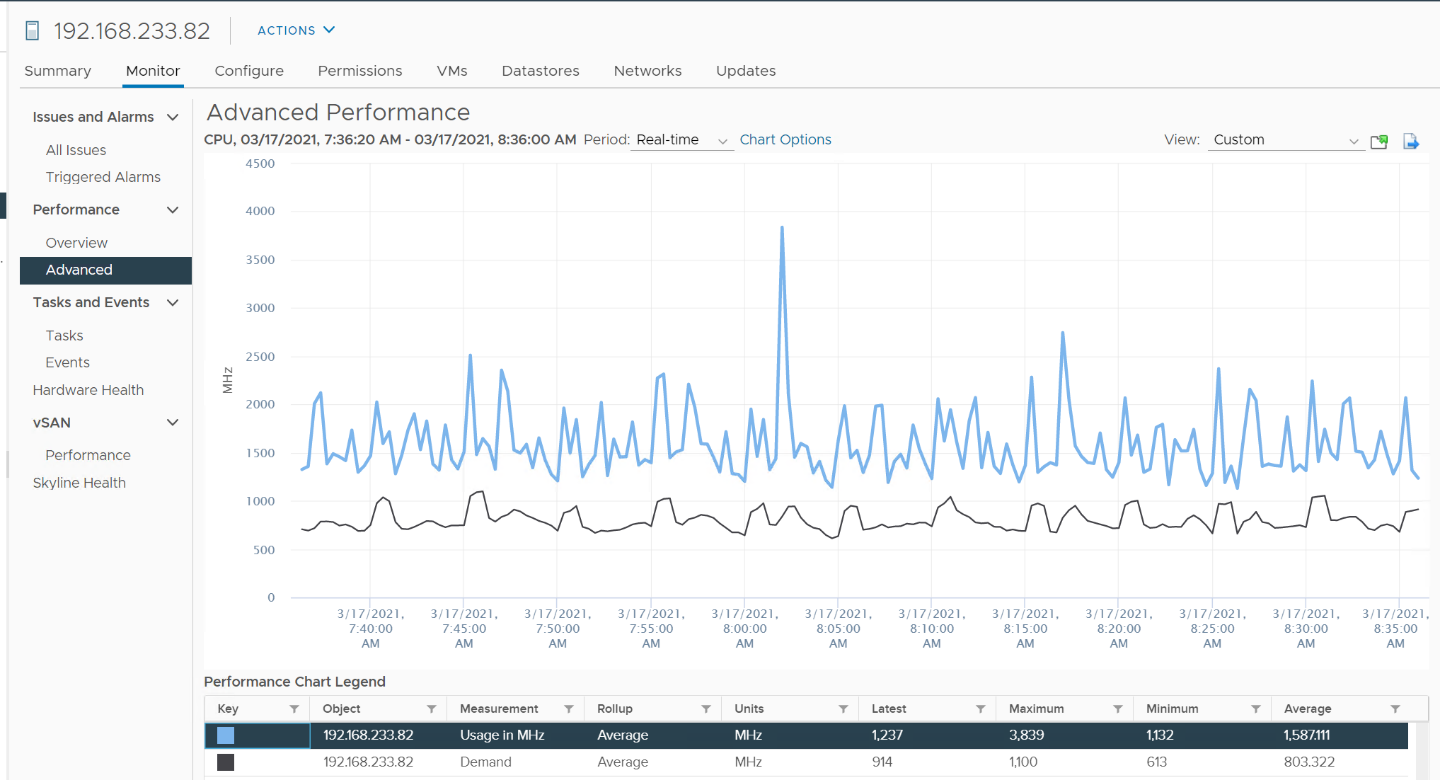
Once there is enough utilization, defined as some VMs are sharing the same cores, Demand will be higher than Usage. The following screenshot shows Demand being consistently higher
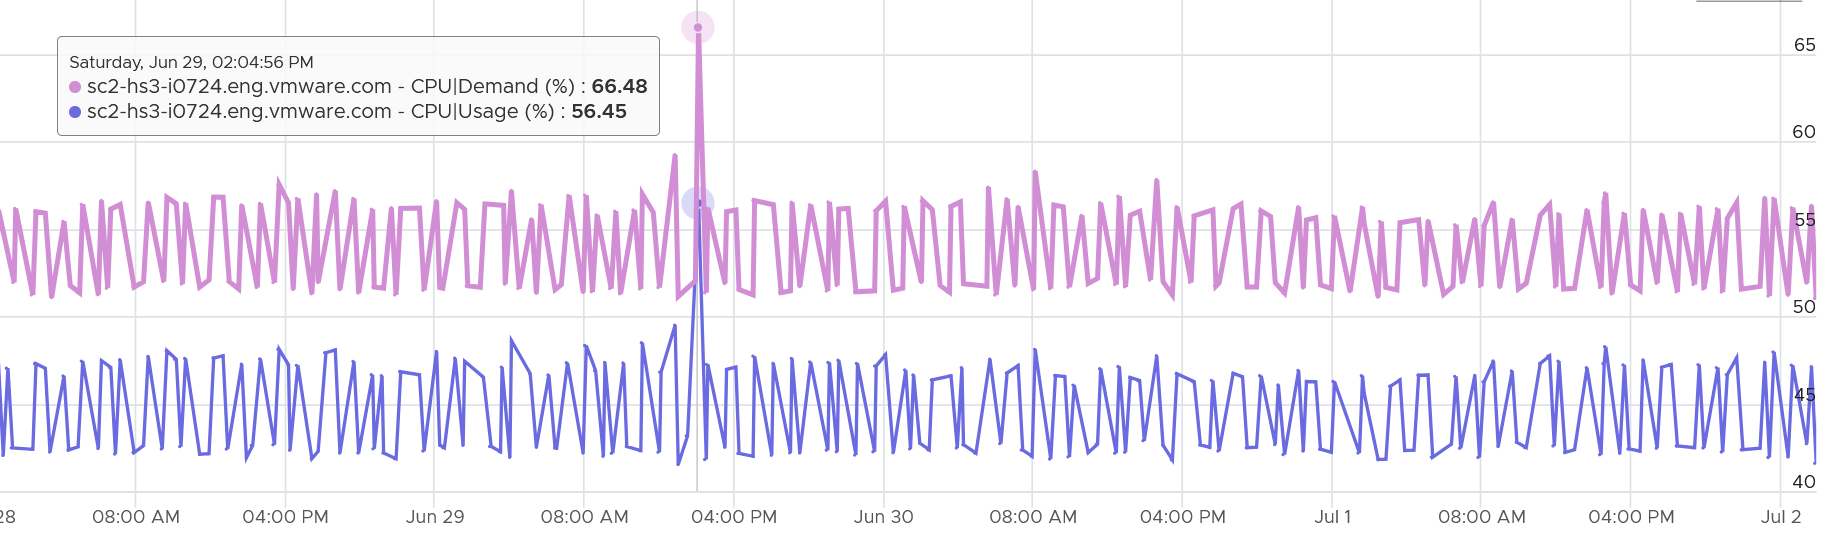
Summary
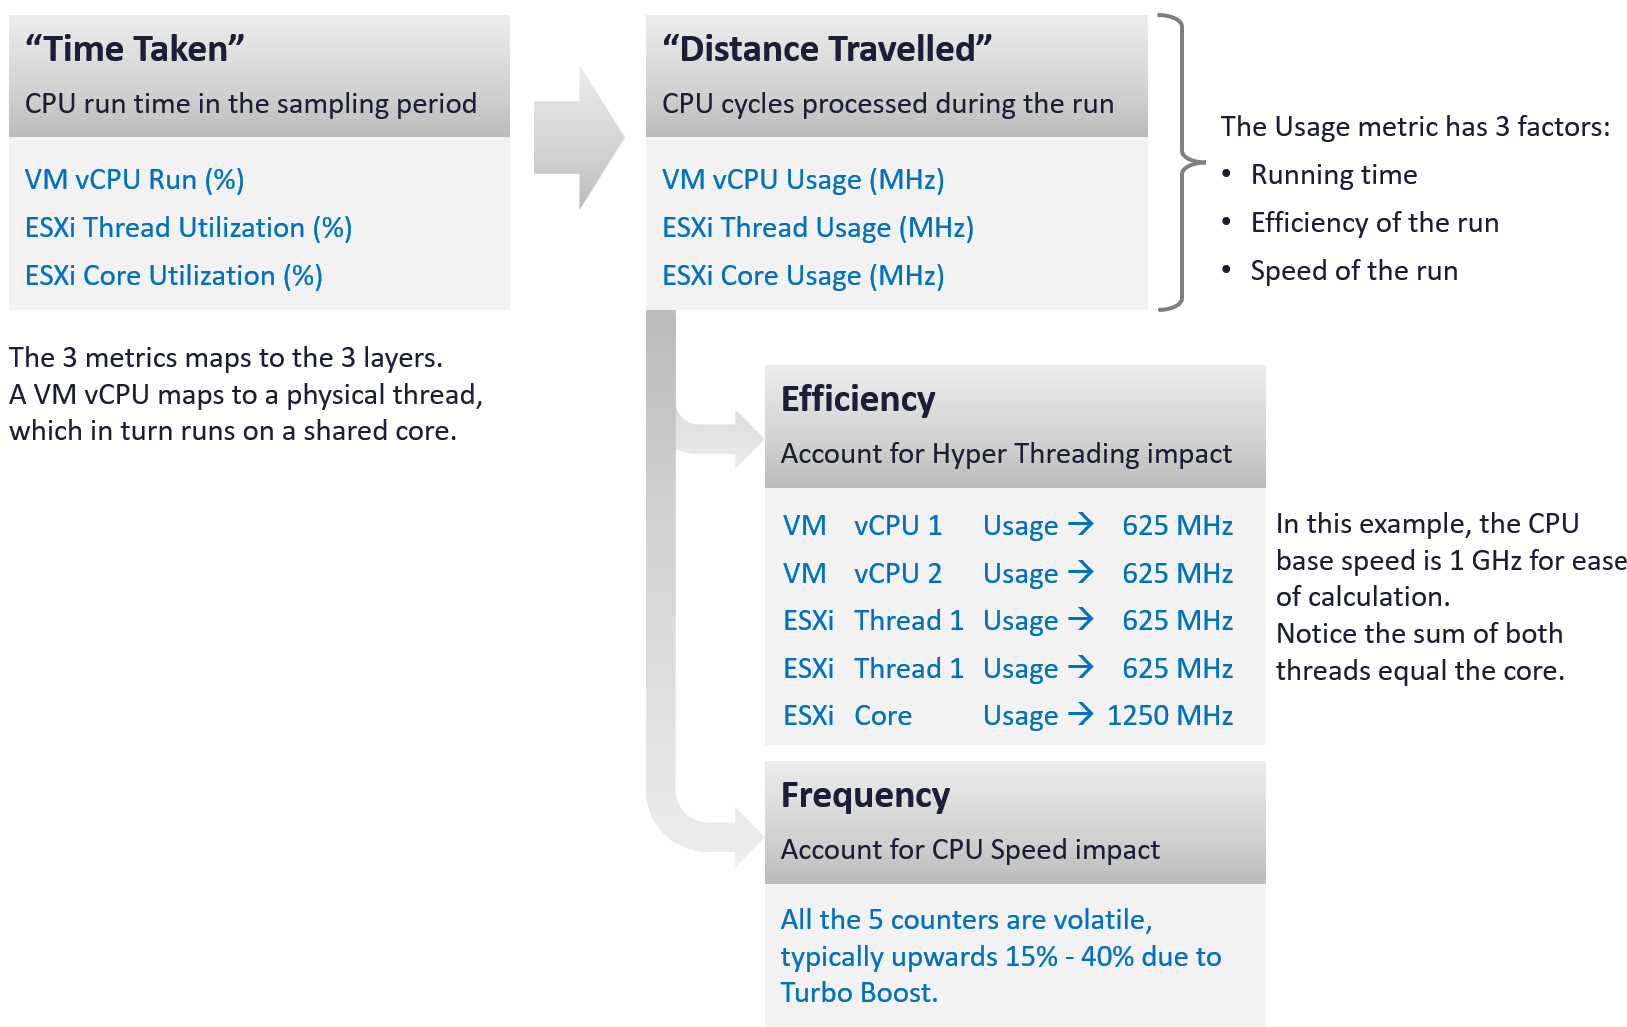
Comparison
Let’s evaluate all the possible scenarios so you can compare the values returned by the metrics. We will use a simple ESXi with 2 cores. Each core has 2 threads. In each of the scenario, a thread is either running or not running. There is no partial run within a thread as that’s mathematically covered in our scenarios.
I will also use 20000 ms as that’s more familiar. The following table shows an ESXi with 2 cores. There are 6 possible permutations in their utilization.
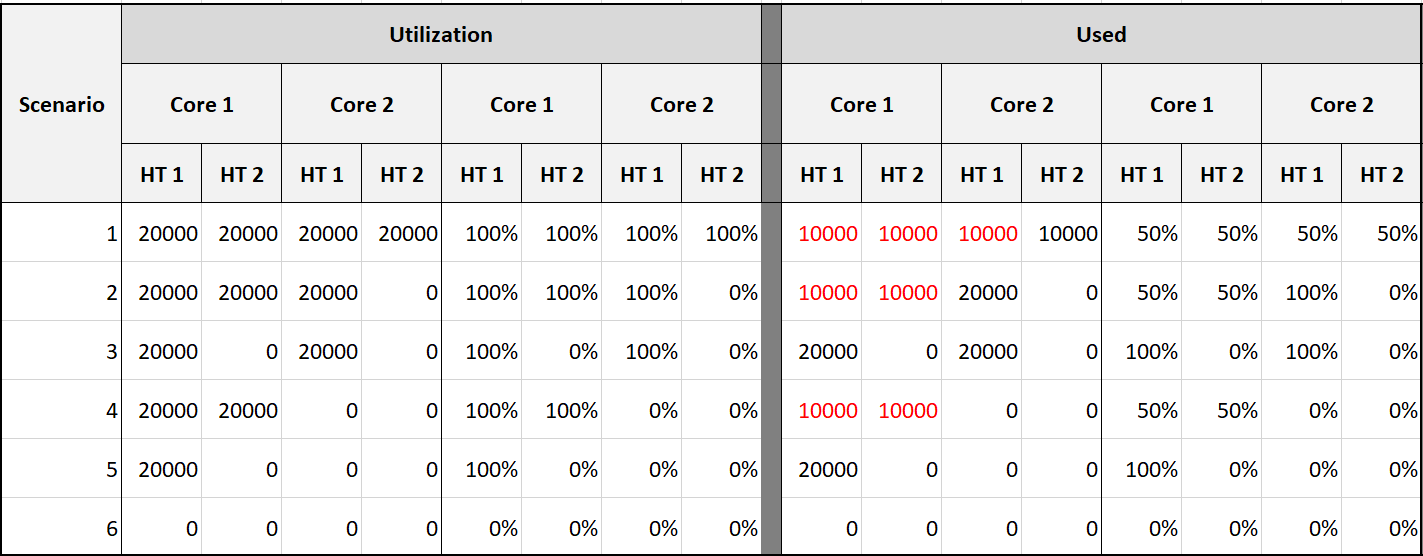
The table shows clearly that Used splits the Utilization into 2 when both threads are running.
Look at scenario 1. While Utilization charges 20000 ms to each thread, Used charges 10000. This is not intuitive as ESXi considers HT to deliver 1.25x. Personally I find 12500 easier to understand. The good news is this number is normalized back when it is rolled up to the ESXi host level.
How will those scenarios roll up at the ESXi level?
The following table shows the 4 metrics (Utilization, Used, Core Utilization, Usage). I have expressed each in % so it’s easier to compare.
There are 6 different scenarios, so logically there should be 6 different values. But they are not, so I added my personal take on what I like them to show. I’m keen to hear your thought.
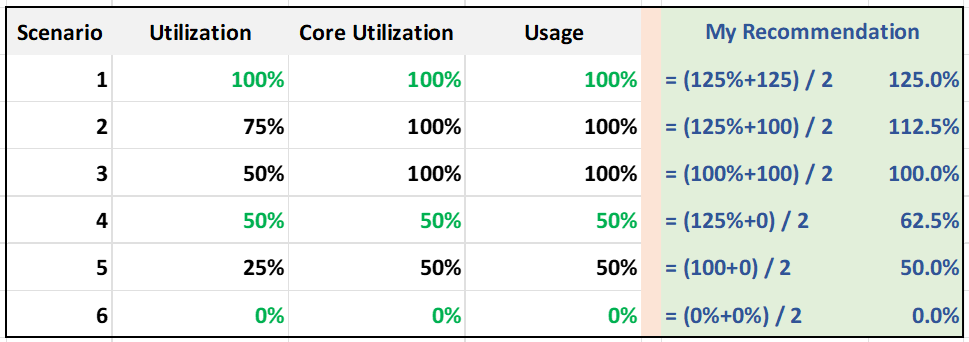
What’s causing the difference?
Yup. Hyper Threading.
Why do I choose 125% instead of 100%?
To me, the 1.25x bonus factor has to be shown. Without HT, it’s 100%. HT is a bonus. While it provides 1.25x overall throughput, each thread pays an expensive price, as each suffers 37.5% penalty.
| Scenario | Analysis |
|---|---|
| 1 | Do you notice something strange with the value of Usage (%)? Yes, it’s no longer 50%. It’s 100%. The average of 50% is 100%. The reason is the accounting does not count each thread as 20000. Each core has 20000 and not 40000. If you say that is similar behaviour to Core Utilization, you’re right. |
| 3 | Utilization is only showing 50% when both cores are in fact already utilized. I prefer this to show 80% as HT only delivers 1.25x, not 2x. |
| 5 | Utilization is again showing too low a value. |
Now let’s add CPU clock speed. What happens when there is power management?
I’d focus on just Used and Usage to highlight the difference.
What do you notice from the table below?
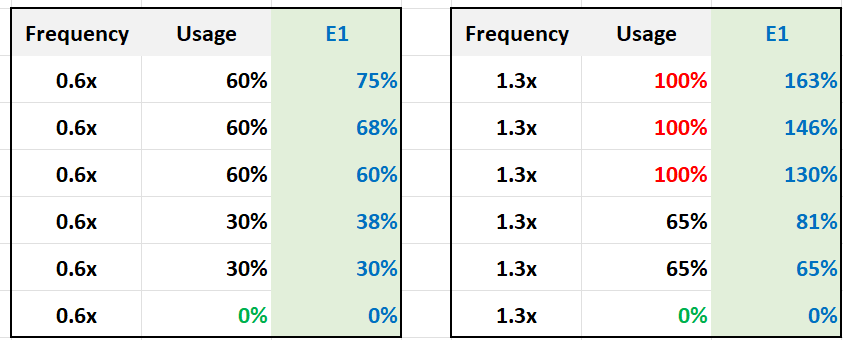
Usage is capped at 100%. I prefer this not to be capped, so you know its actual value. The good part is Demand metric is not.
For comparison, I put forth what I think the value should be.
Recommendation
The answer depends on the purpose: performance (VM-centric) or capacity (ESXi-centric)? Performance is about giving VM the highest quality resource (no HT), but capacity is about using all the resources (including HT).
Here is how the counters stack up in terms of sensitivity:
| Metric | Analysis |
|---|---|
| Utilization | The value shows 50% when it should report 80% |
| Core Utilization | The value goes up to 100% when it should report 80% |
| Usage | These 3 metrics are essentially the same. The value is affected by CPU frequency. During low utilization it under-reports due to power savings, while during high utilization it over-reports due to turbo-boost. |
| Used | |
| Consumed | |
| Demand | The value is even higher than Usage. |
I’d use Core Utilization (%) and Thread Utilization (%) as the primary counters. Yes, 2 counters.
I’d complement with Usage (MHz) for performance.
If Core Utilization is not yet 100% or Thread Utilization is not yet 50% then there is still physical cores available. You can go ahead deploy new VMs.
If Core Utilization = 100% (meaning Thread Utilization is at least 50%) then review Thread Utilization and ensure it’s not passing your threshold. I’d keep it around 80% - 90% per ESXi, meaning the level at cluster level will be lower as we have HA host. Also, check contention.
Regardless of what counters you use, As Mark Achtemichuk said it best: “drive by contention”.
Real World Samples
How do these values compare in production environment? The following table shows 297 ESXi hosts. It shows the various possibilities covered earlier.
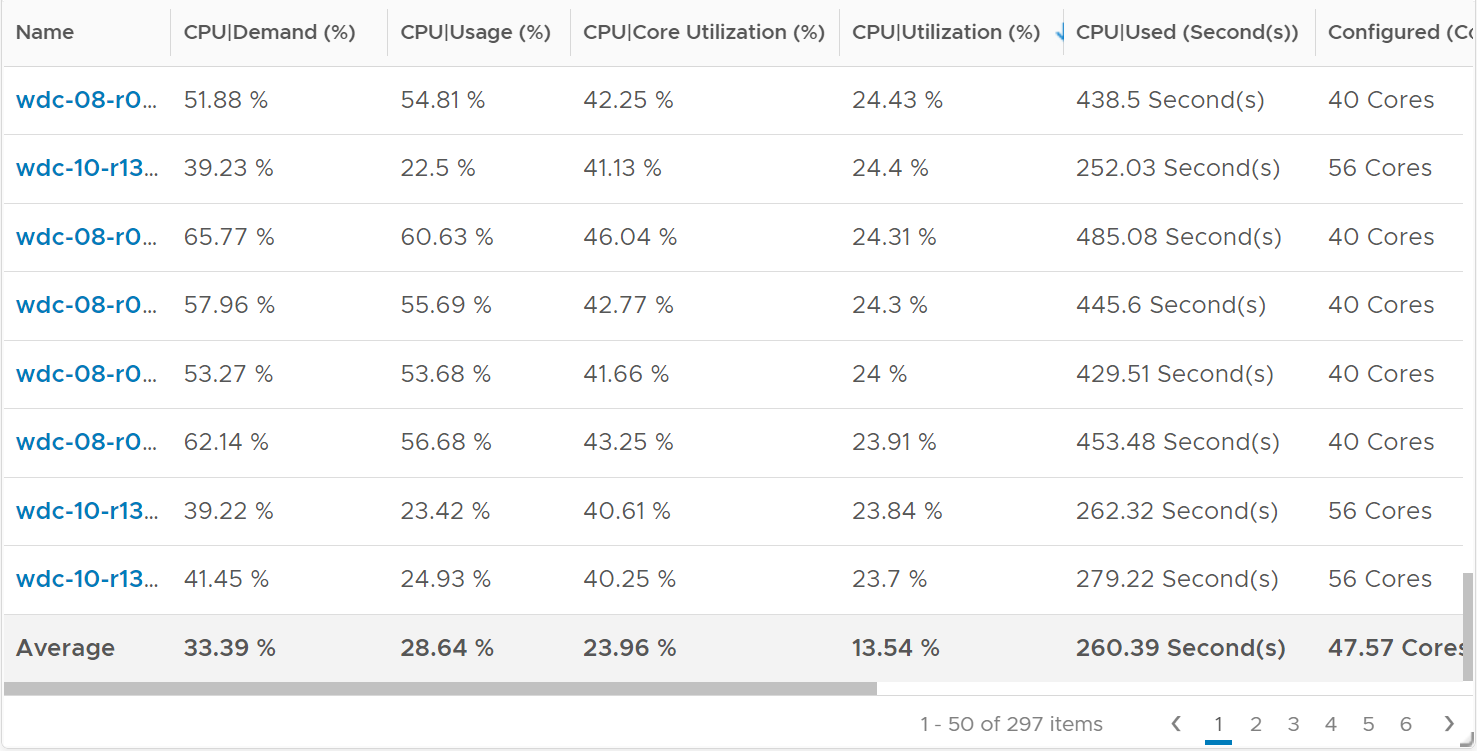
Let’s zoom on an ESXi with a very high utilization.
Take a look at the 4 numbers below. Demand is consistently around 130%.
With such a high demand value, it’s no surprise that Usage is 100% flat out.
Do we have a performance problem? What can you deduce from the other 3 numbers?
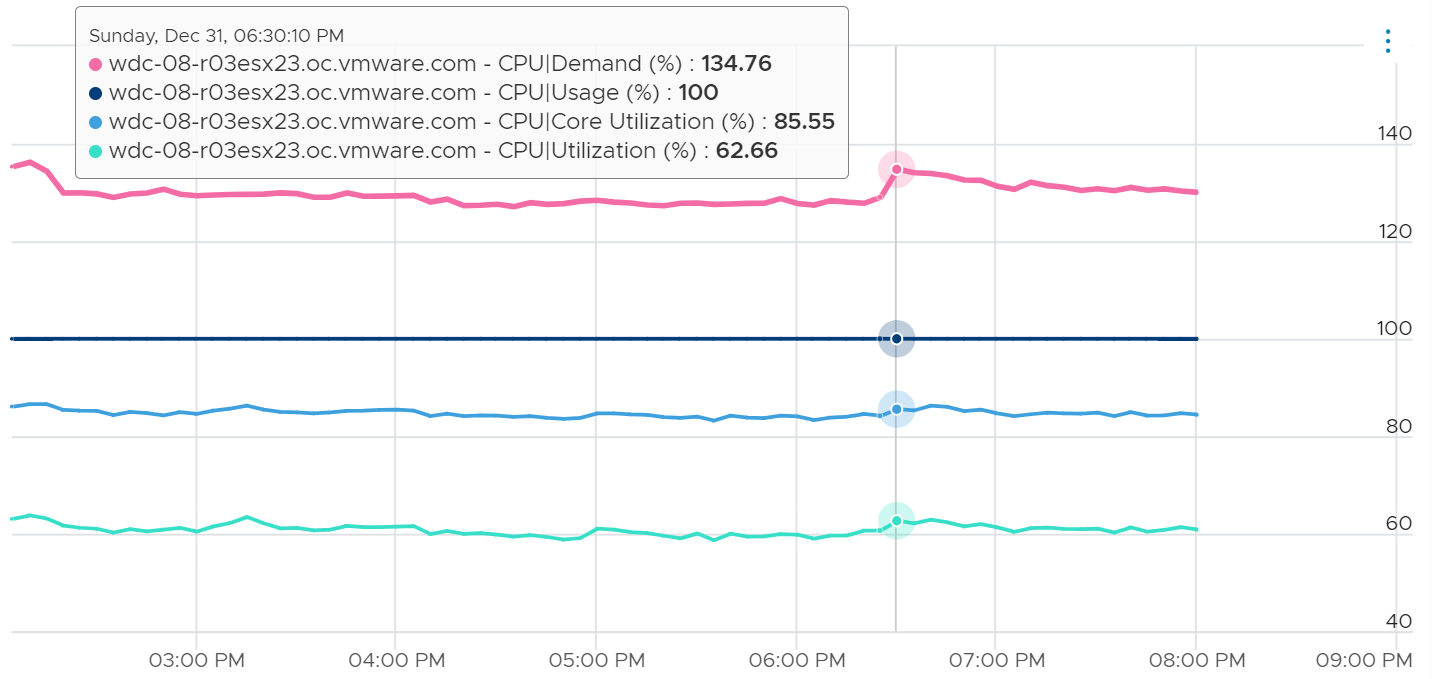
Core Utilization at 85% is not very high. The box still has 15% of the cores not running. The box has 40 cores 80 threads. Unless there is limit, there are still 6 cores available.
Utilization at 62% is moderate. This means ~38% x 80 threads, or 30 threads are available.
Based on the raw utilization above, I expect the CPU ready to be low.
Let’s check. What’s your conclusion from below?
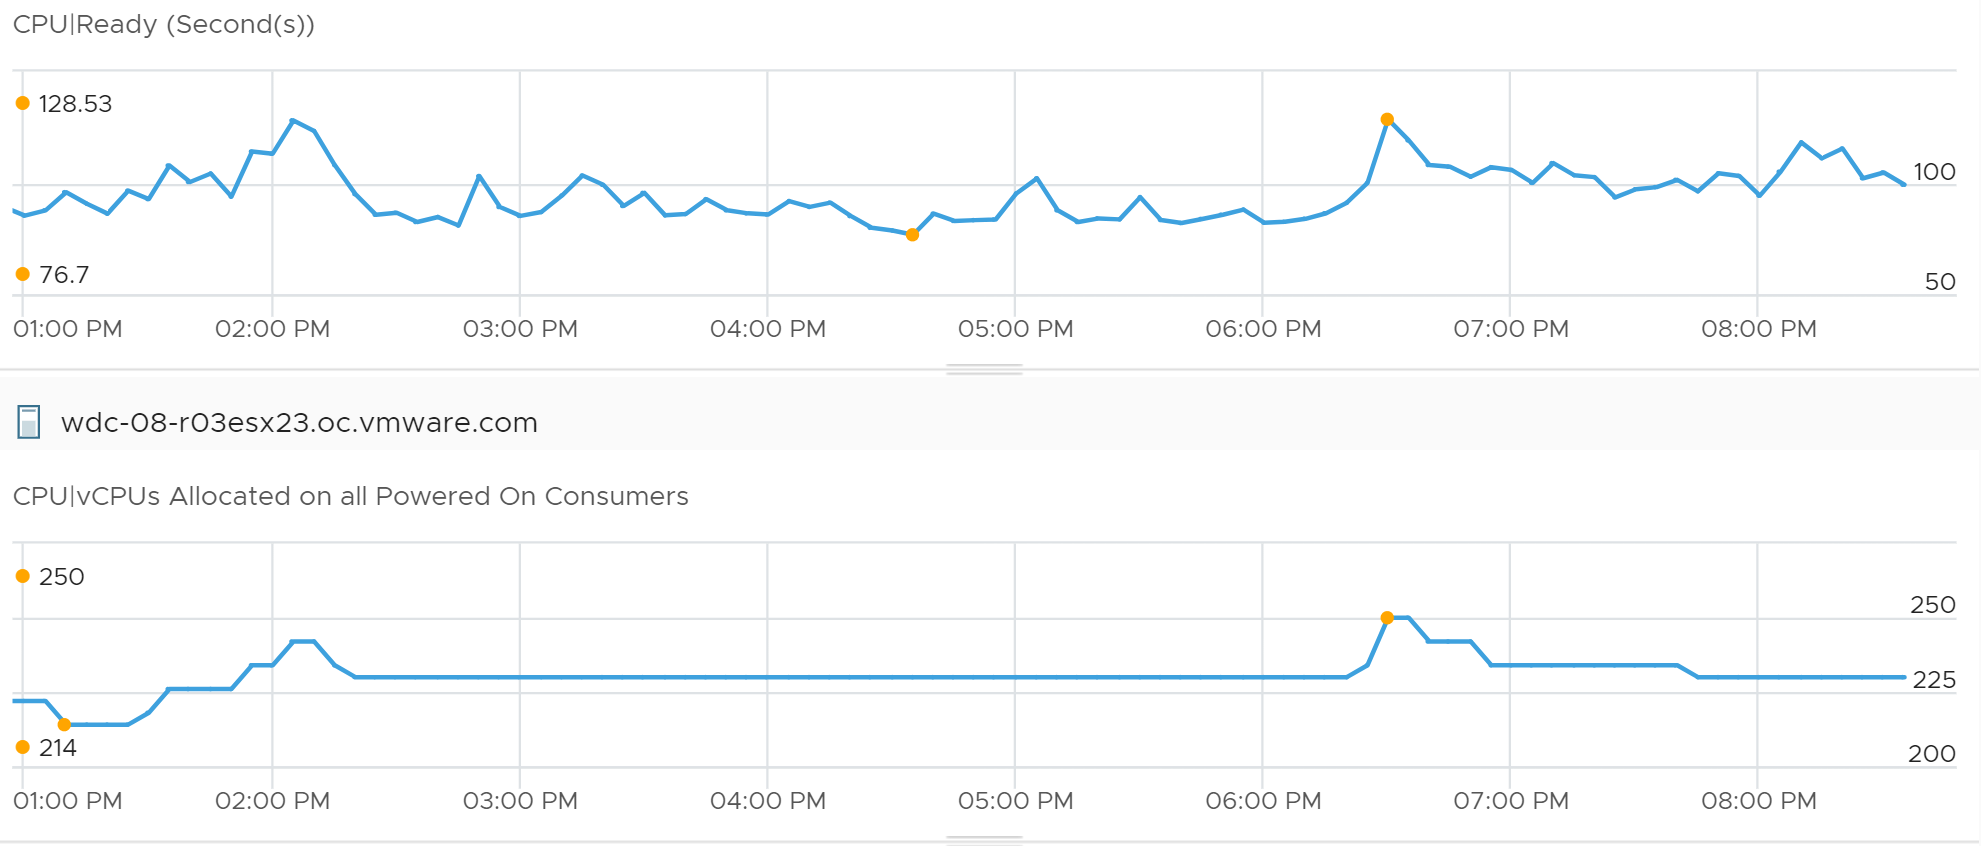
The value peaks at 128 seconds.
But that’s for the entire box. There are 250 vCPU at that time.
Dividing the value, it’s only 514 ms per vCPU. This translates into 2.5%, a relatively low number.
Let’s validate this further by going into each VM.
I took the average of the entire 7 hour period, and got around 2% for Ready and less than 0.1% for Co-Stop. This is pretty good considering these VMs are large. They are 15.29 vCPU on average. Some of them also have limit, which could contribute to the CPU read.
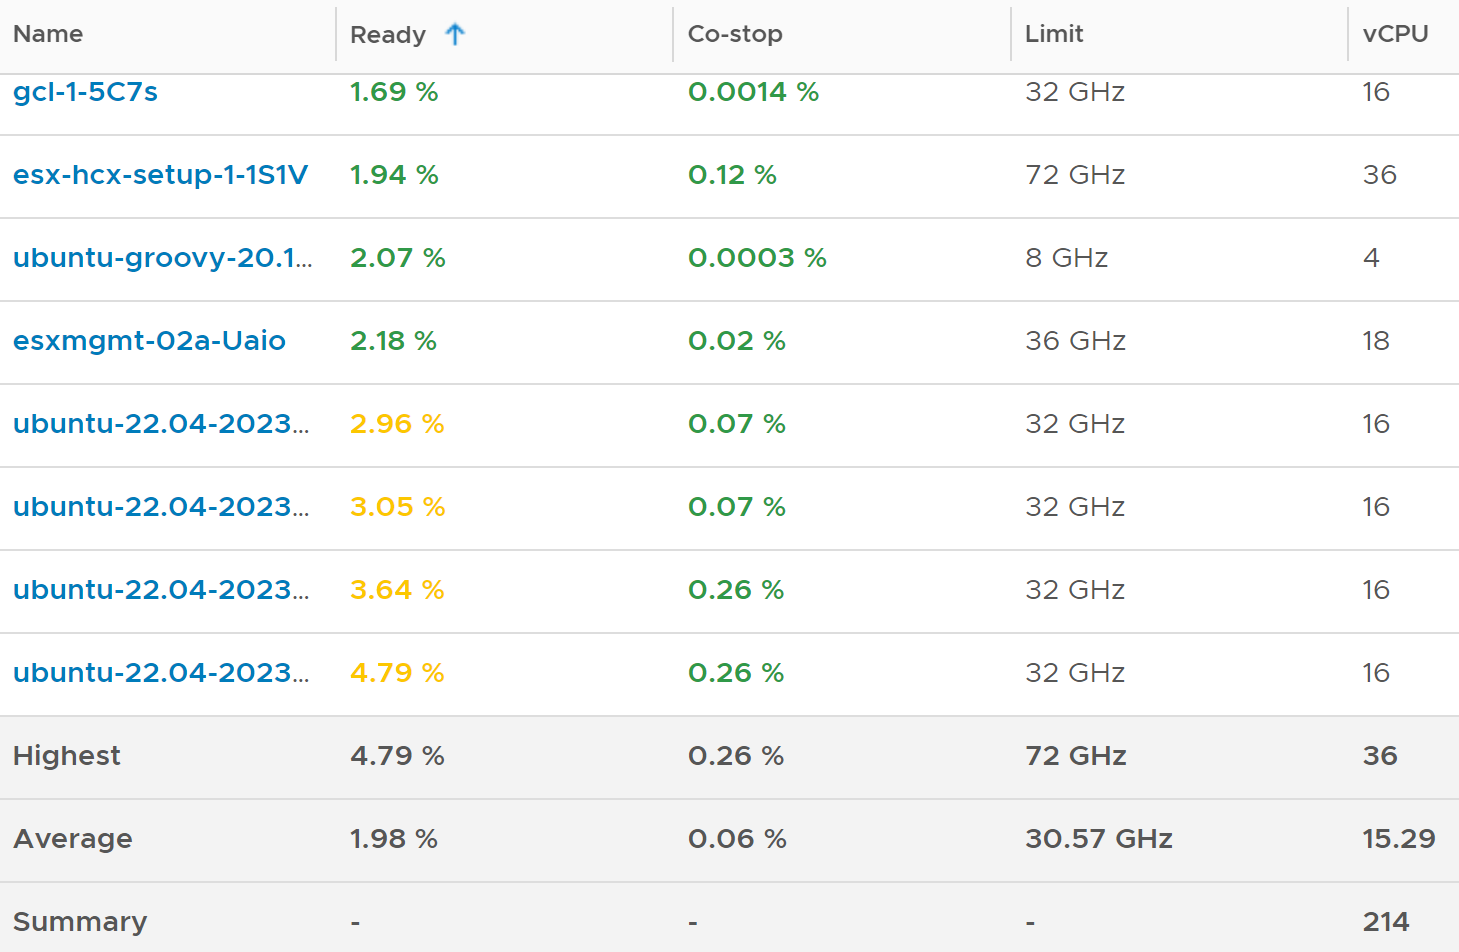
Now let’s pick the opposite example.
The following chart shows an ESXi with low utilization. What do you notice?
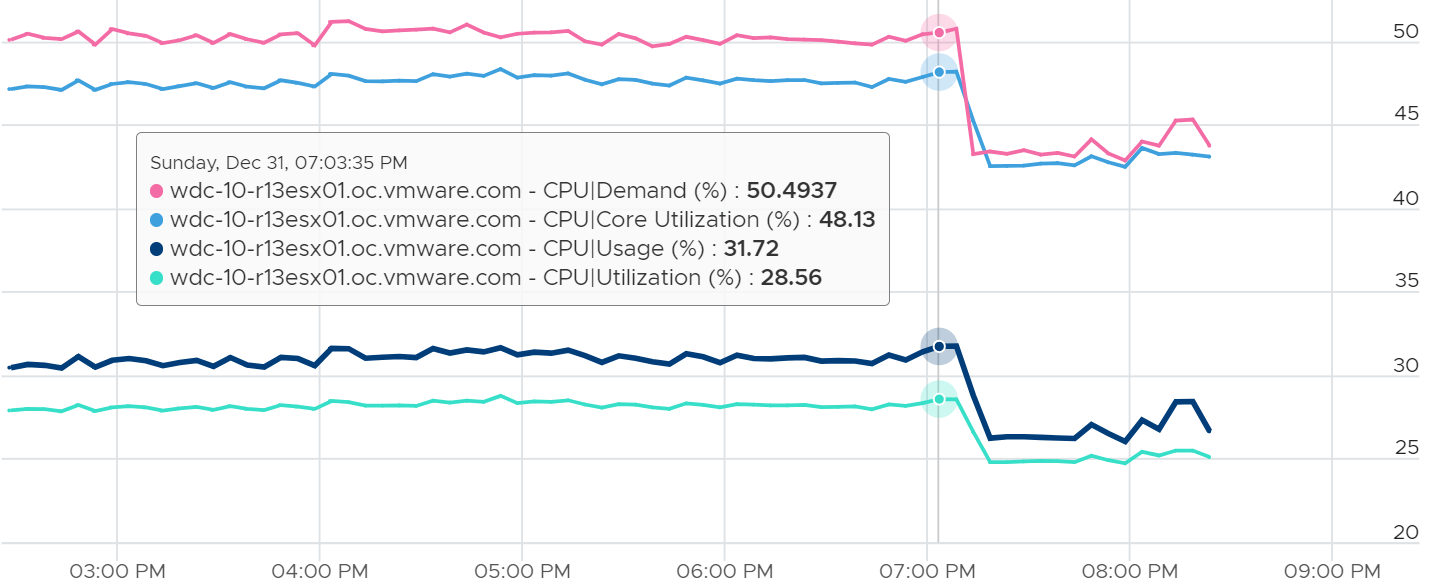
This time around, Usage is lower than Core Utilization.
This ESXi is not even 50% utilized, as the core utilization shows 48%. The kernel decides that it could complete the job with less power, and clocks down the core.
Reservation
There is only 1 metric provided, which is Reserved Capacity (MHz). Compare this with memory, which provides 3 counters. Why is that so?
Review the System Architecture section. In short, it is not applicable to CPU as due to its highly transient nature. When the VM is not running, the reserved capacity can be used by other VM. This differs to memory, which is “sticky” as it’s a form of storage.
The metric does not include hypervisor reservation.
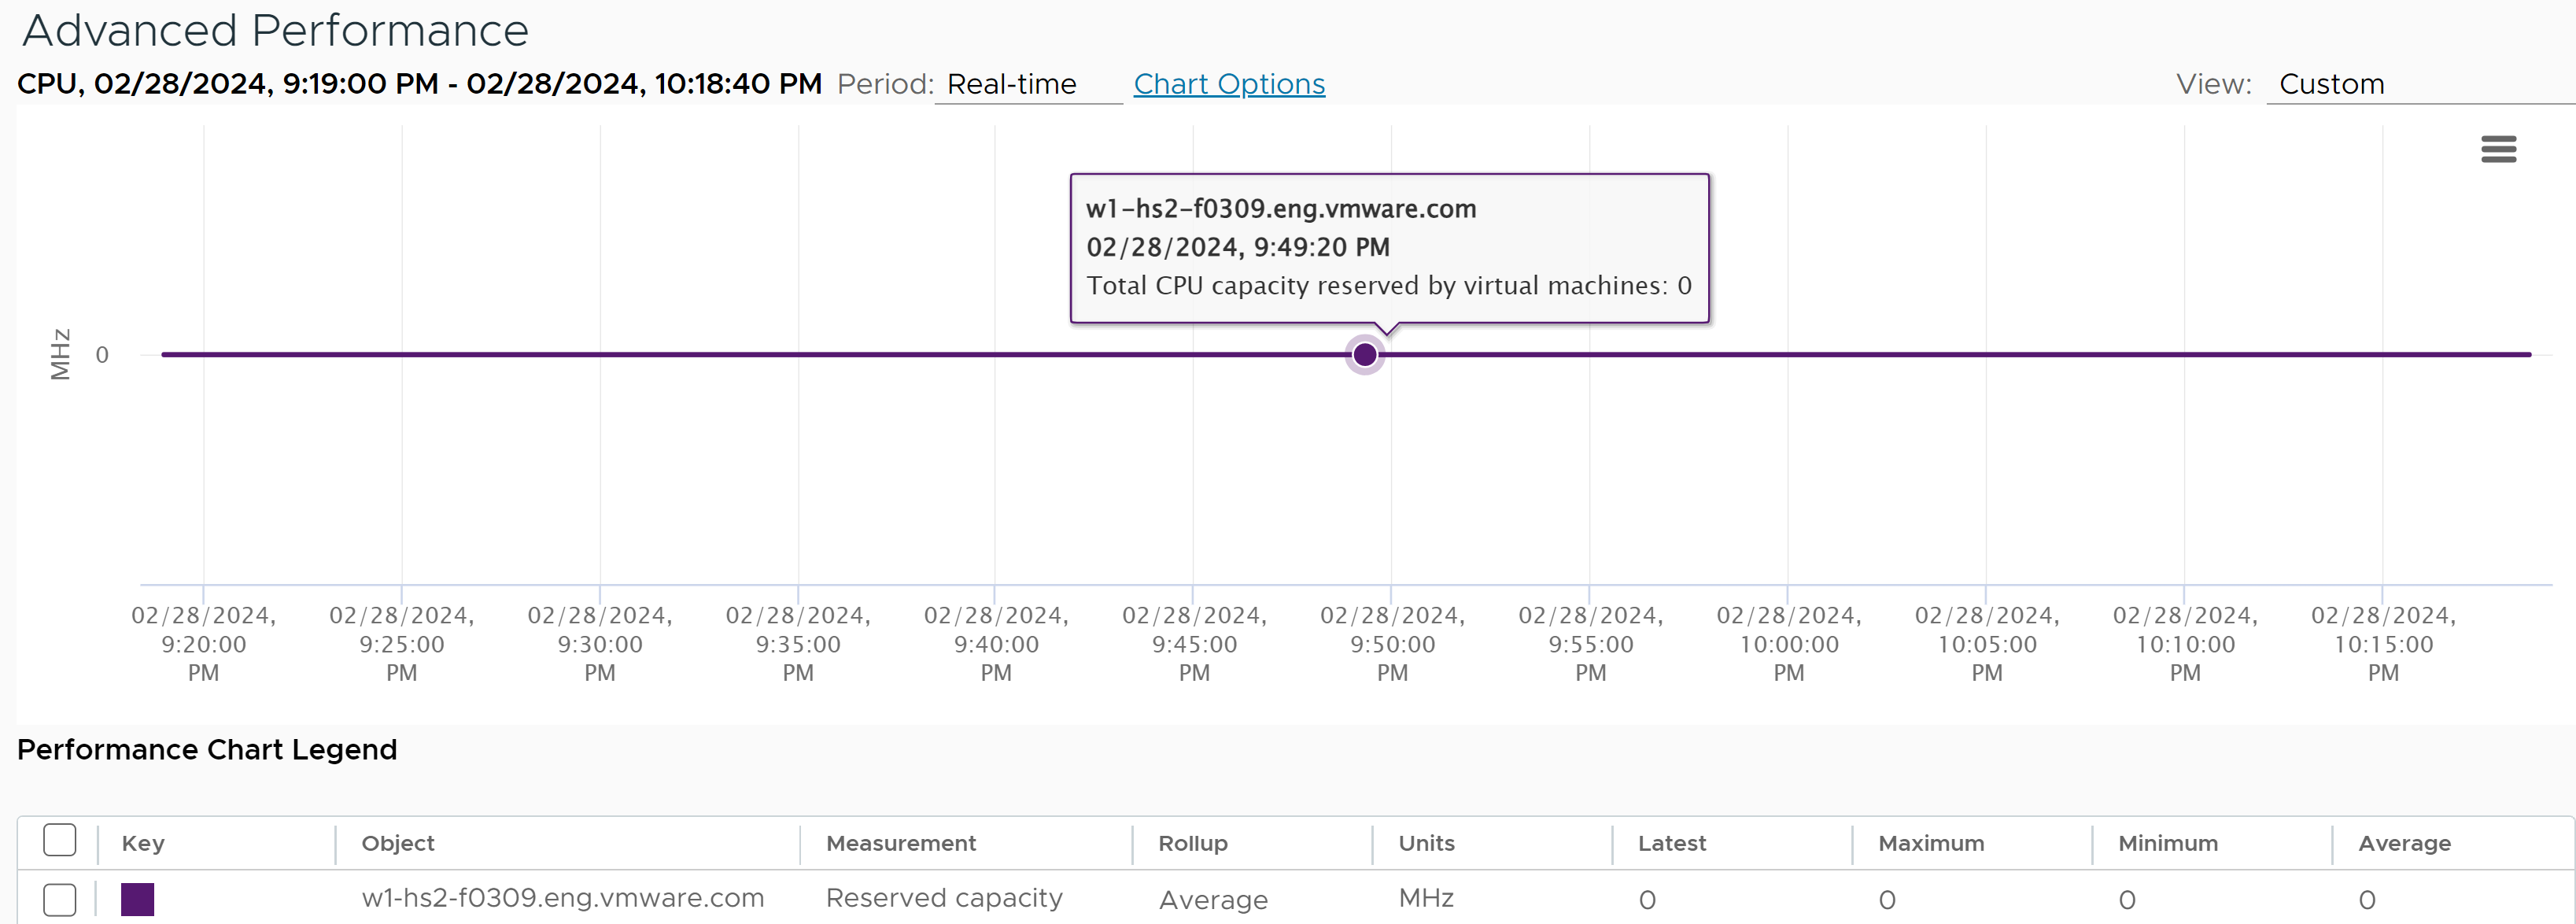
Metrics to Avoid
Do not use the following metrics. Use the recommended metric instead.
CPU Utilization for Resources
Under the System metric group, you will see 17 metrics with names starting with “CPU Utilization for Resources”.
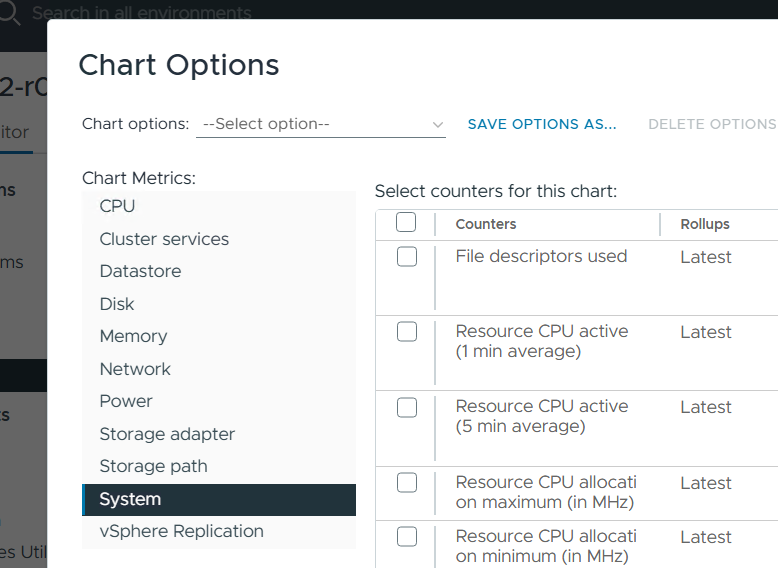
Here is the full list.
| Name in VCF Operations | Name in vSphere Client |
|----|----|
| CPU Utilization for Resources|CPU Active (1 min. average) | rescpu.actav1.latest |
| CPU Utilization for Resources|CPU Active (5 min. average) | rescpu.actav5.latest |
| CPU Utilization for Resources|CPU Active (15 min. average) | rescpu.actav15.latest |
| CPU Utilization for Resources|CPU Active (1 min. peak) | rescpu.actpk1.latest |
| CPU Utilization for Resources|CPU Active (5 min. peak) | rescpu.actpk5.latest |
| CPU Utilization for Resources|CPU Active (15 min. peak) | rescpu.actpk15.latest |
| CPU Utilization for Resources|CPU Running (1 min. average) | rescpu.runav1.latest |
| CPU Utilization for Resources|CPU Running (5 min. average) | rescpu.runav5.latest |
| CPU Utilization for Resources|CPU Running (15 min. average) | rescpu.runav15.latest |
| CPU Utilization for Resources|CPU Running (1 min. peak) | rescpu.runpk1.latest |
| CPU Utilization for Resources|CPU Running (5 min. peak) | rescpu.runpk5.latest |
| CPU Utilization for Resources|CPU Running (15 min. peak) | rescpu.runpk15.latest |
| CPU Utilization for Resources|CPU Throttled (1 min. average) | rescpu.maxLimited1.latest |
| CPU Utilization for Resources|CPU Throttled (5 min. average) | rescpu.maxLimited5.latest |
| CPU Utilization for Resources|CPU Throttled (15 min. average) | rescpu.maxLimited15.latest |
| CPU Utilization for Resources|Group CPU Sample Count | rescpu.sampleCount.latest |
| CPU Utilization for Resources|Group CPU Sample Period | rescpu.samplePeriod.latest |
When the hypervisor says "for resources," it means "from the perspective of the Resource Scheduler's allocation buckets." To the ESXi kernel (VMkernel), a "resource" isn't just a virtual machine—it's any node in the allocation hierarchy that can have Shares, Reservations, or Limits applied to it.
Do not use them. They are legacy metrics.
Instead, use the following:
-
For CPU Active, use CPU Demand as they are the same. The 1-minute average results in the same value as the 20-second metric and the 5-minute metric, as VCF Operations averages all of them into a 5-minute value (or whatever default interval you set). So there is no need for a separate 1-minute. The 15-minute does not have a use case as you already have the 5-minute and can always roll up.
-
For CPU Running, use CPU Usage.
-
For CPU Throttled, use Effective Limit.
Wait Metric
You can ignore it as it’s the sum of the VM Wait, which mixes idle time.
The following ESXi host has 2 VM. You can see the Wait metric is the sum of the 2 VM wait metrics.
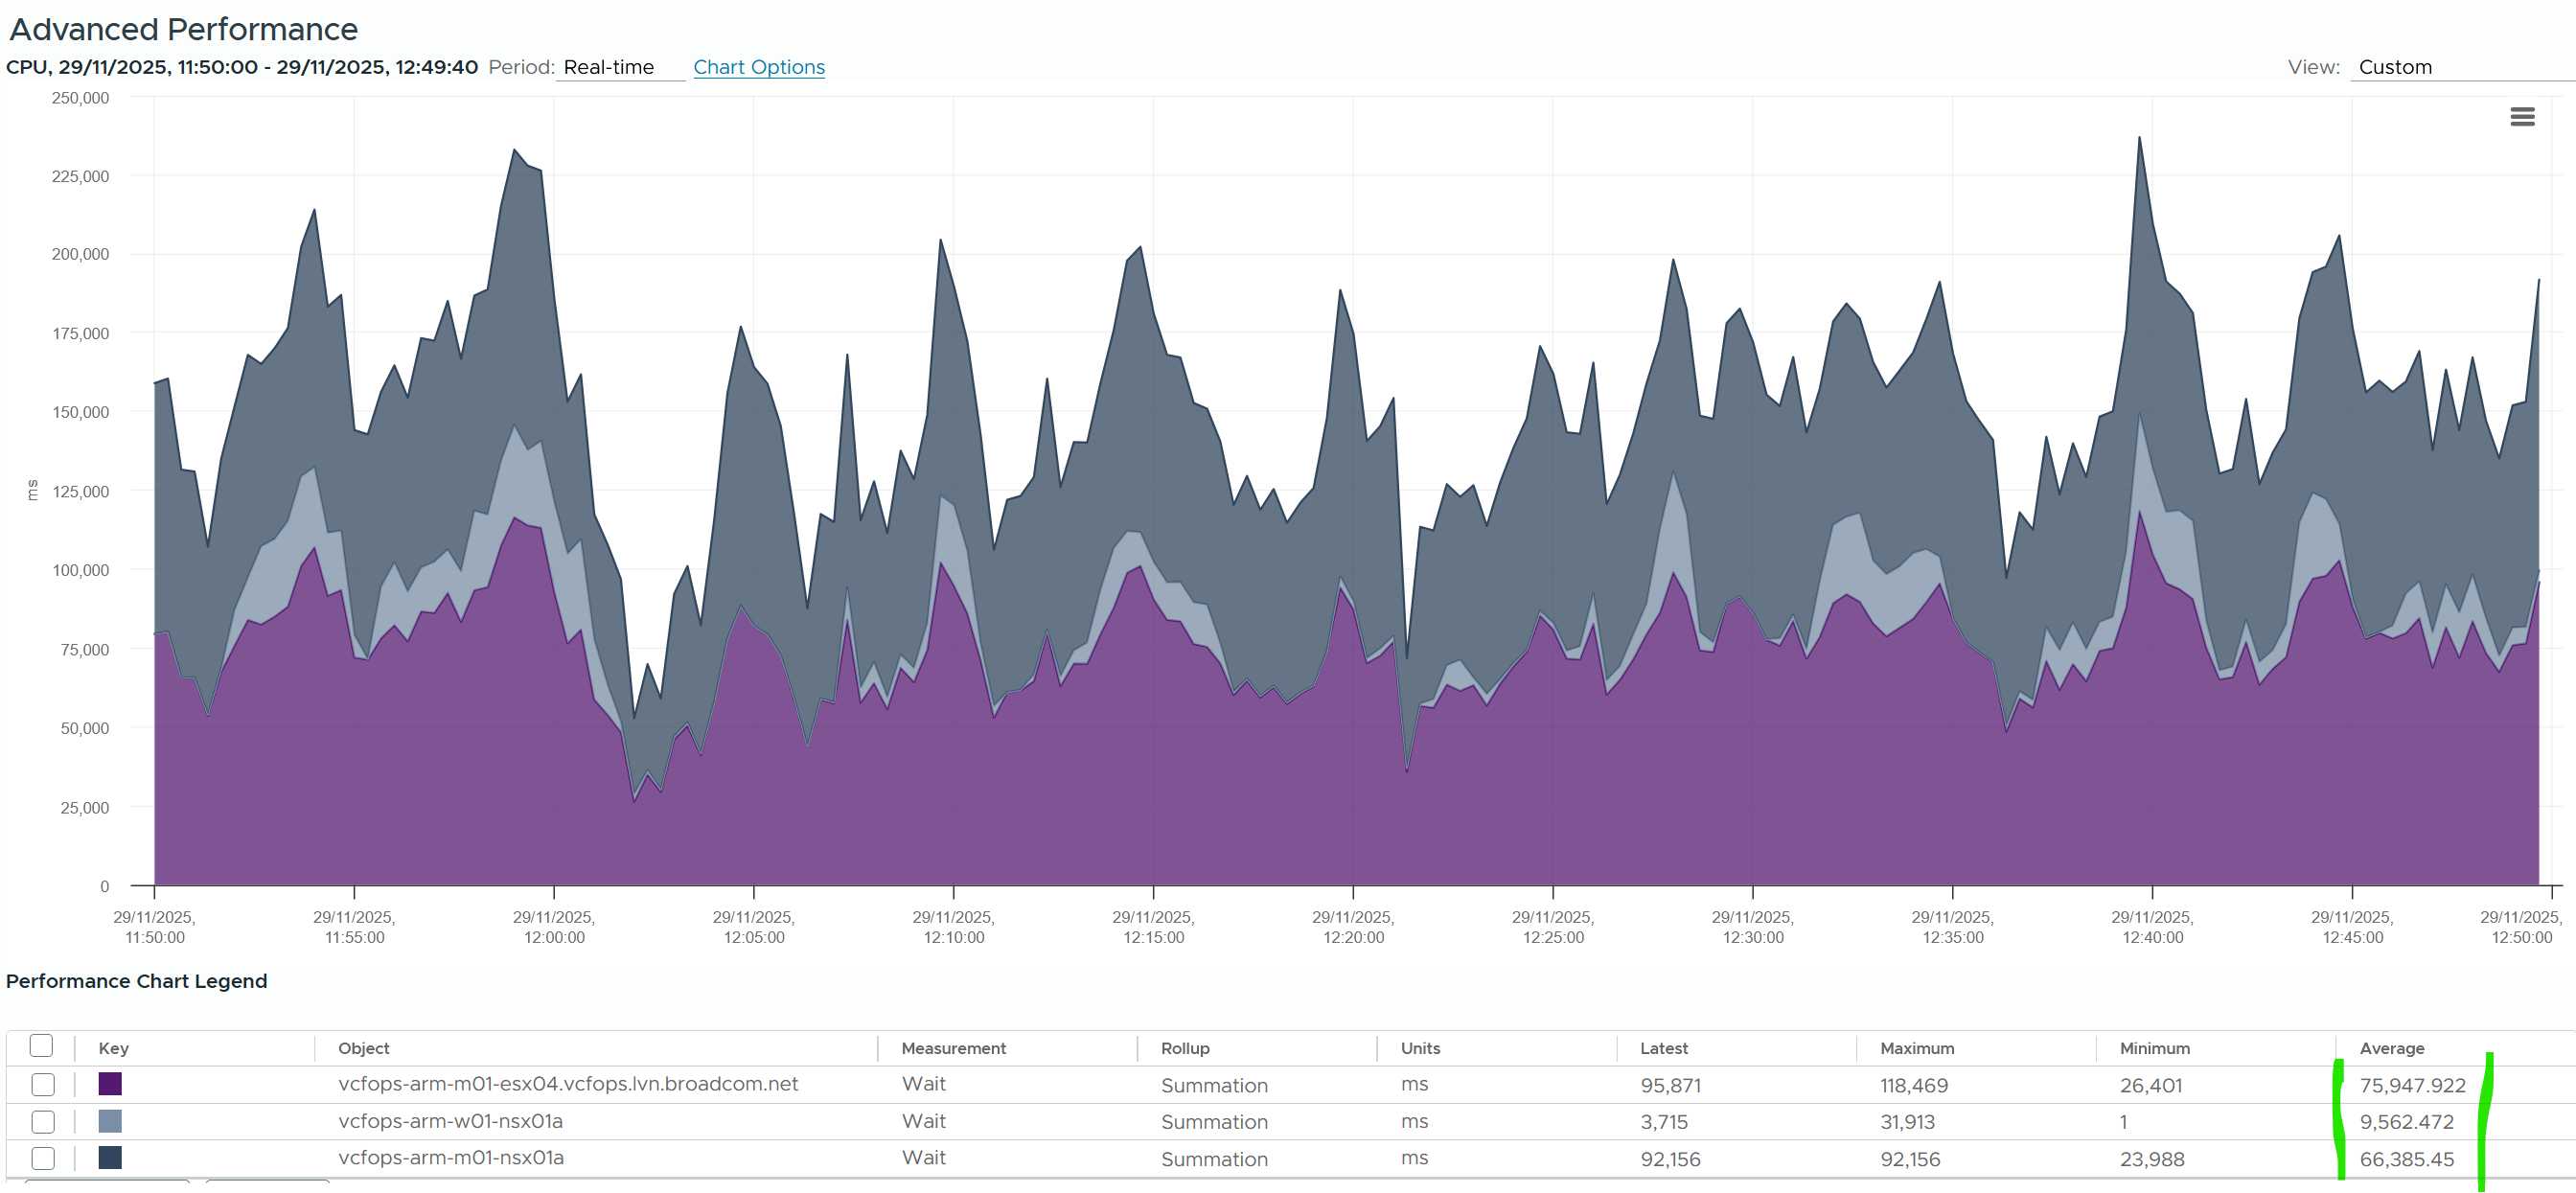
Idle
Before we cover more advance consumption metrics, we need to cover Idle. The reason is idle + non idle should add up to 100%. Knowing what defines 100% is crucial.
If HT is enabled, Idle is capped at 10000 ms at a thread level. The following example shows an ESXi with 64 threads that is basically idle. Notice none of the threads passes 10000 ms. The table shows maximum value of 9998, not exactly 10000. I suppose the 2 ms is the kernel just humming along.
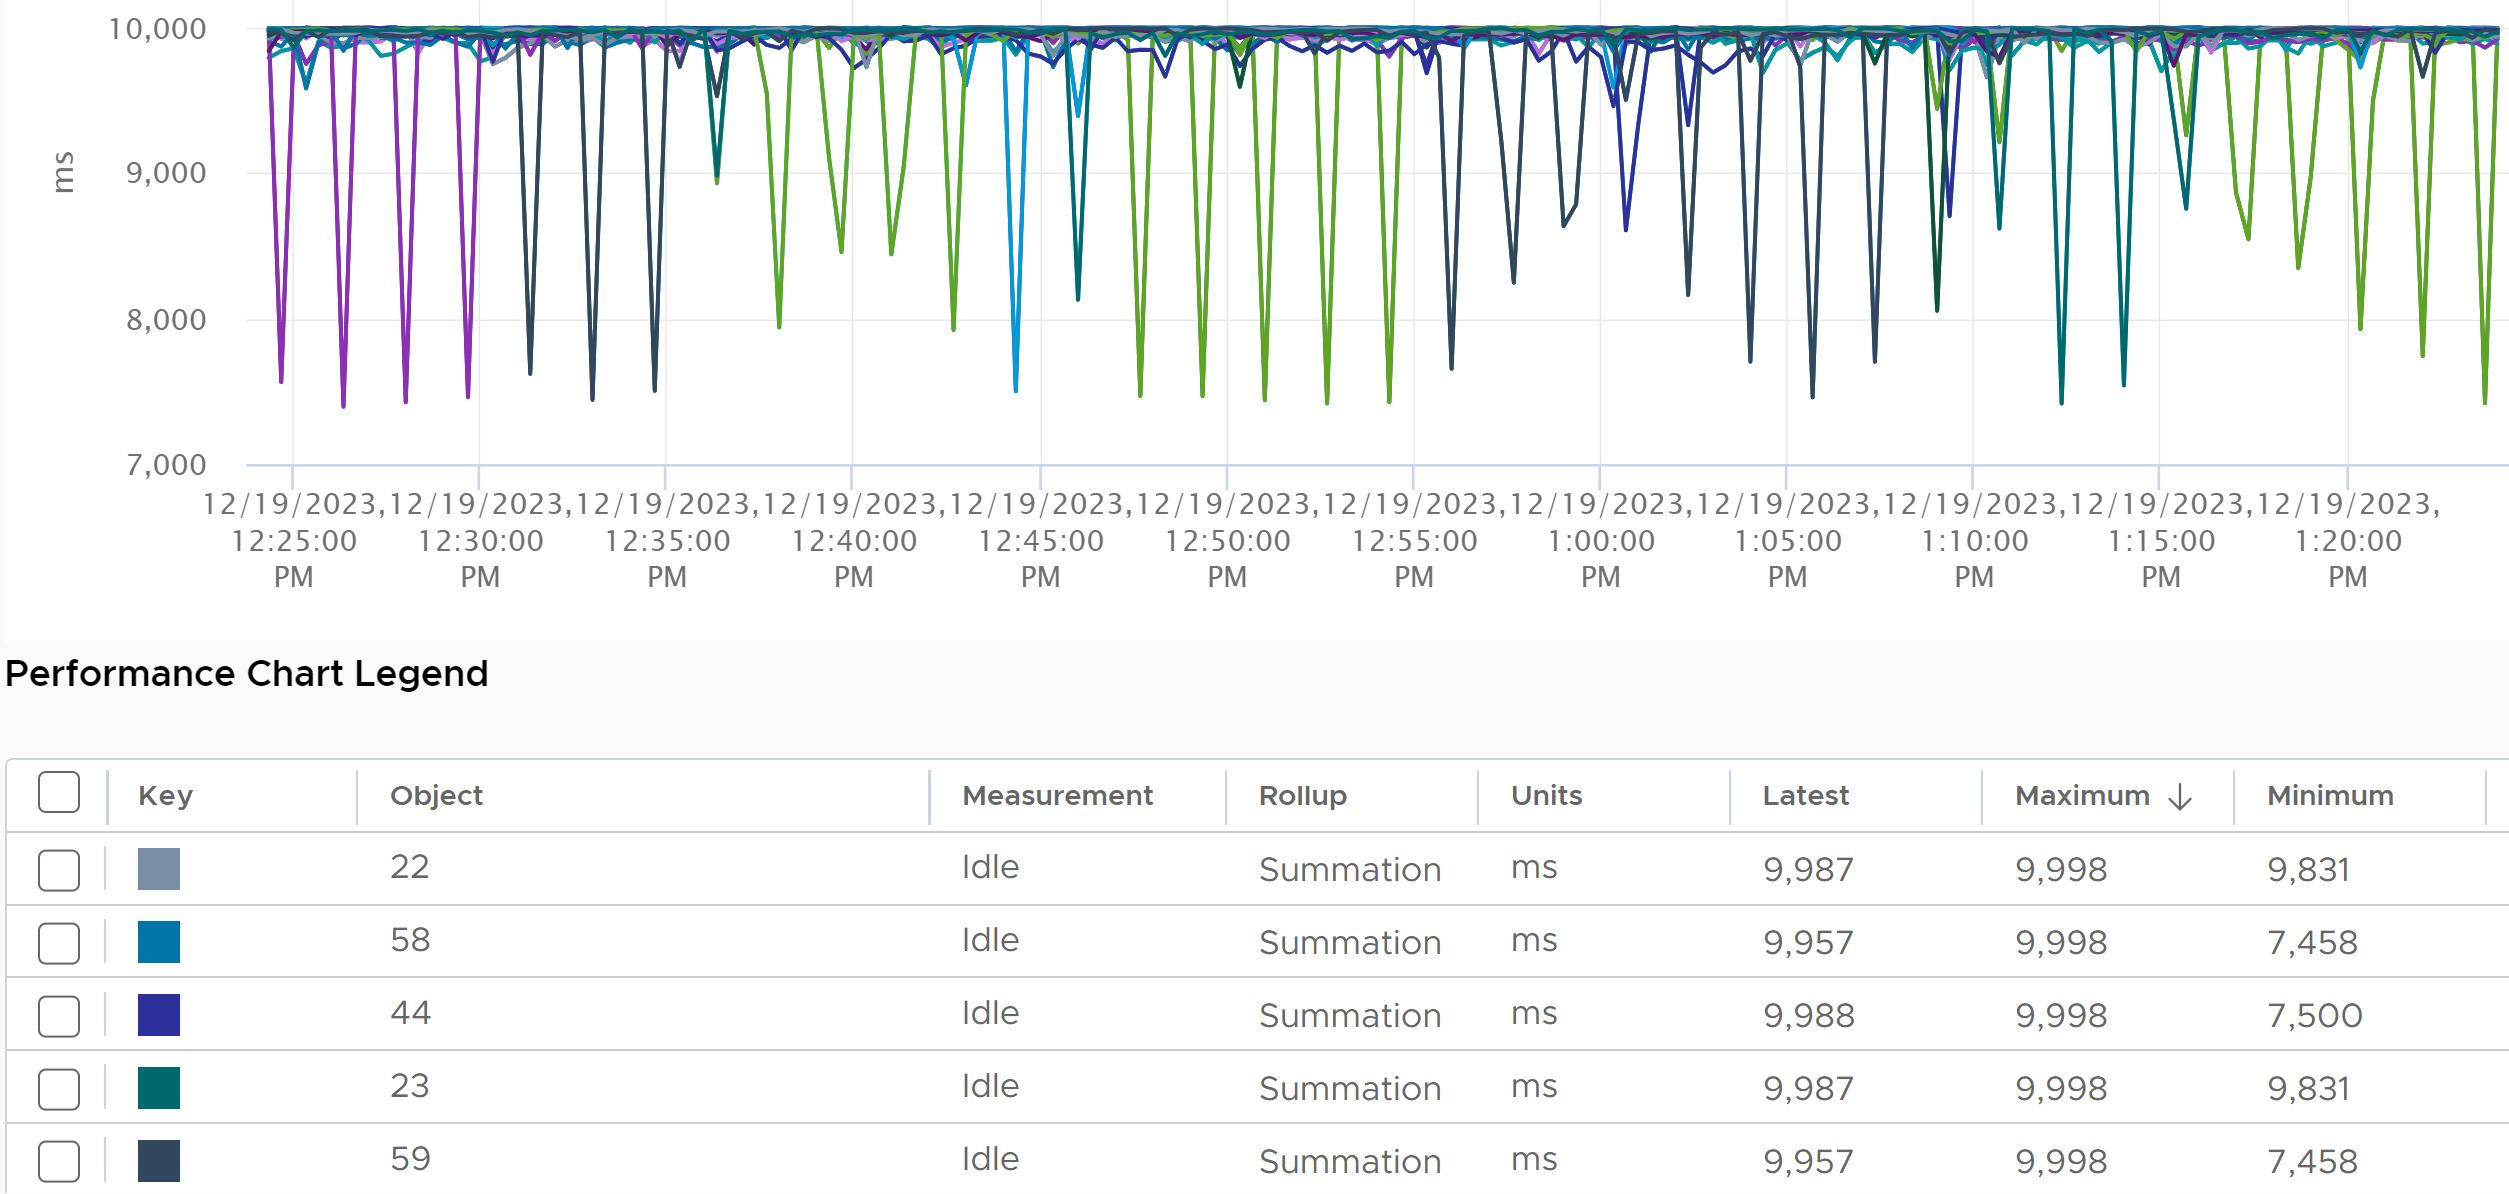
The above translates that the total per core should be 20000, since there are 2 threads per core.
You can confirm the above ESXi is idle by plotting idle at the host level. The sum is near 640000 ms.
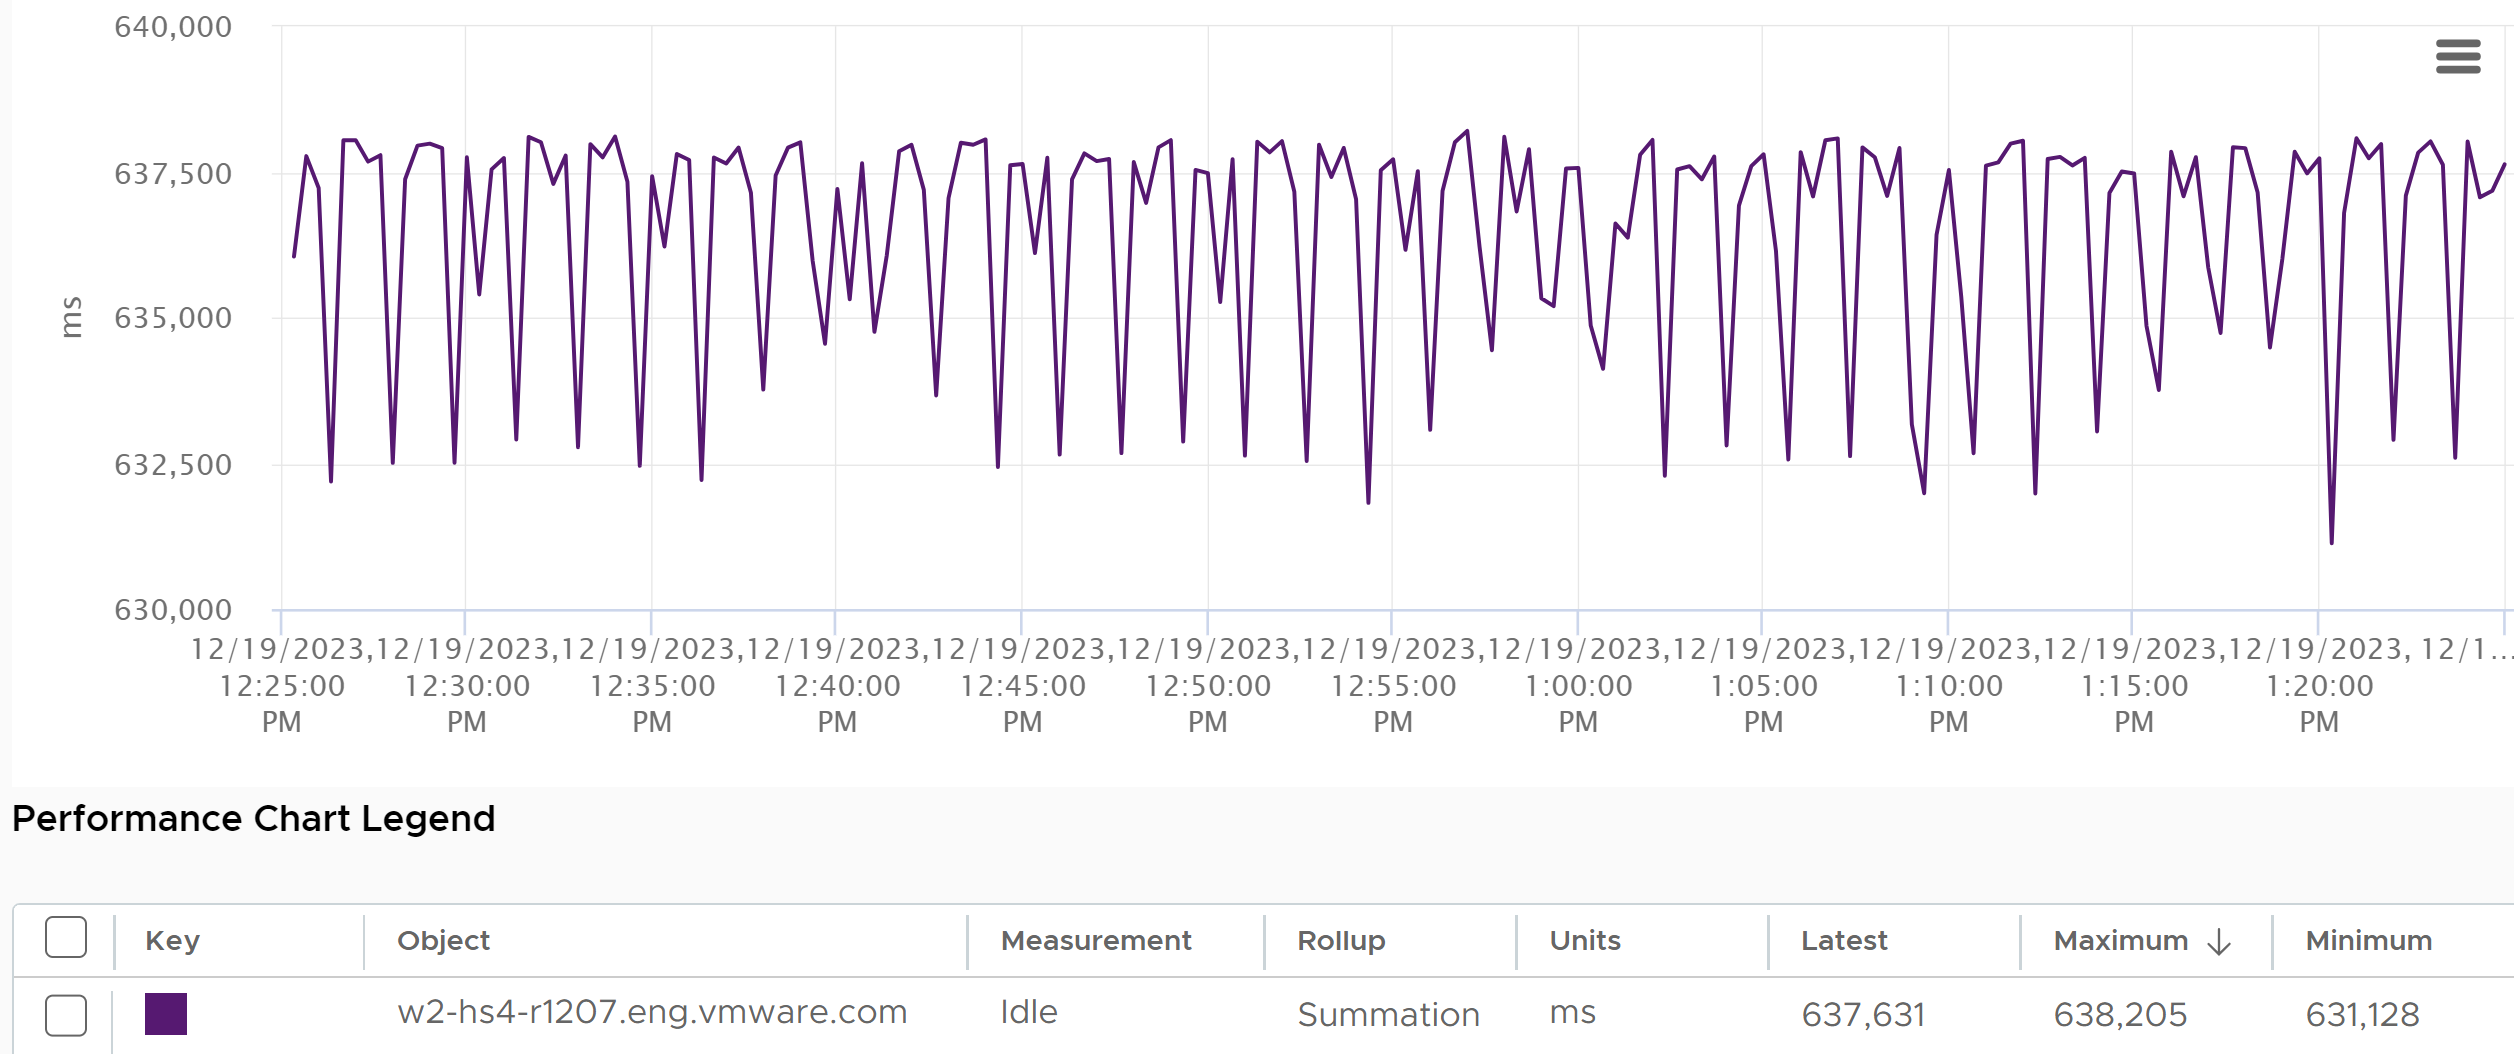
If HT is not available, then there is no counter at thread level. The counter at the core level adds up to 20000 ms.
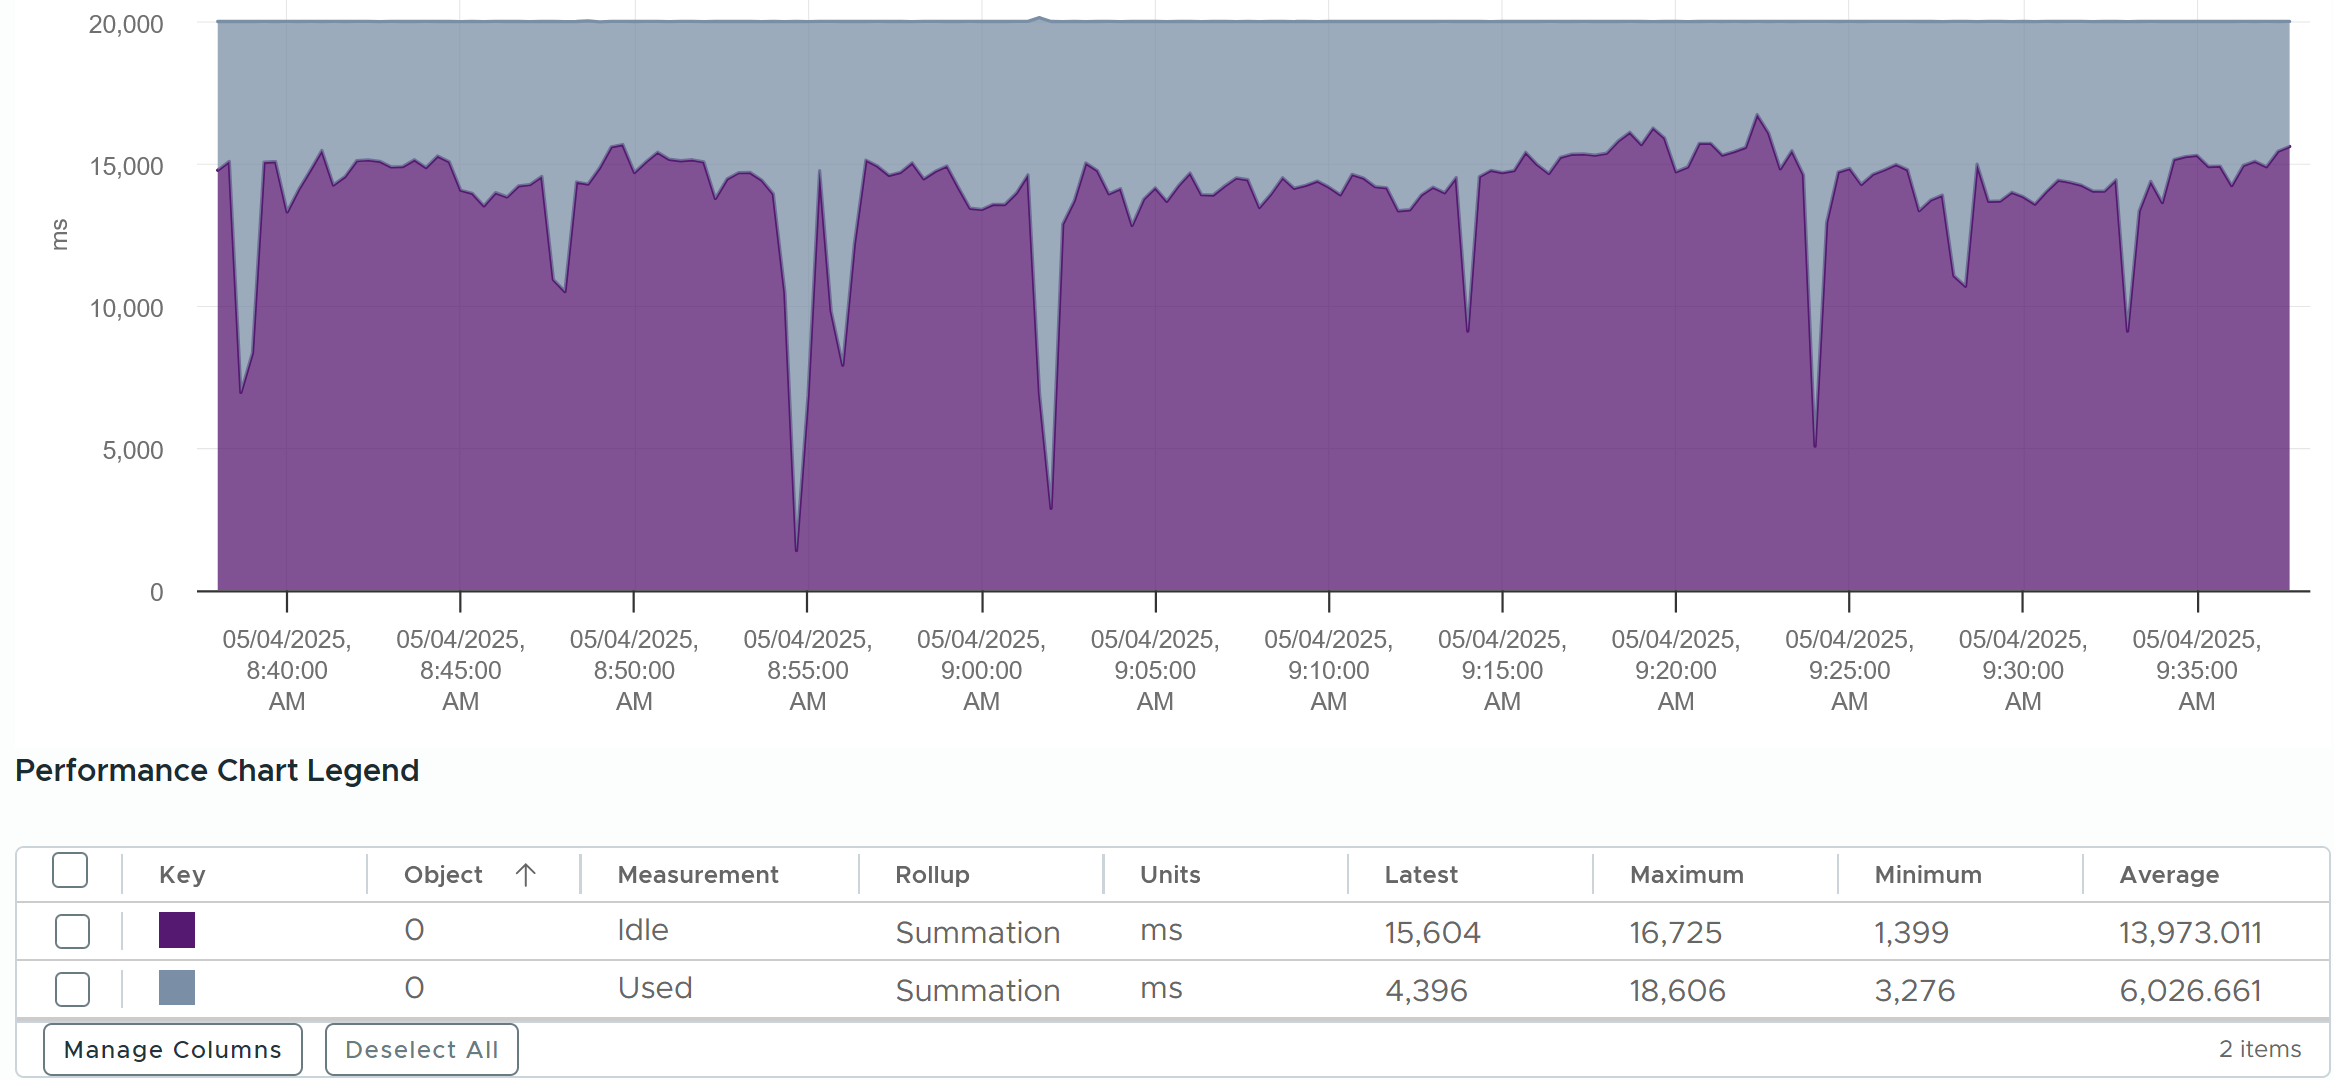
Contention Metrics
The nature of average is also one reason why ESXi “consumption” does not correlate to ESXi “contention”. The 4 highlighted area are examples where the metrics don’t correlate, even go the opposite way in some of them. Can you guess why?
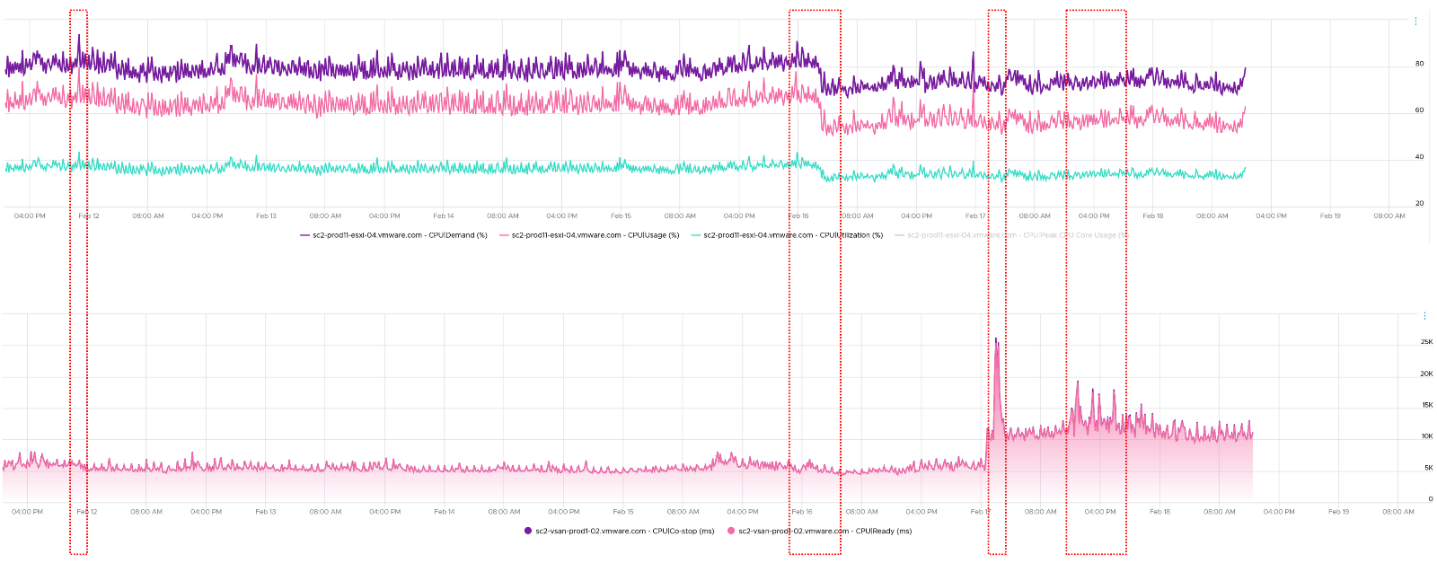
The above picture is a little too small. The following ESXi has total capacity of 111 GHz. So Demand hit 315%! Sum of VM CPU Usage also unbelievably high at 143%. Sure, Ready + CoStop were high at that moment, but how do you explain these 2 exceed Total Capacity?
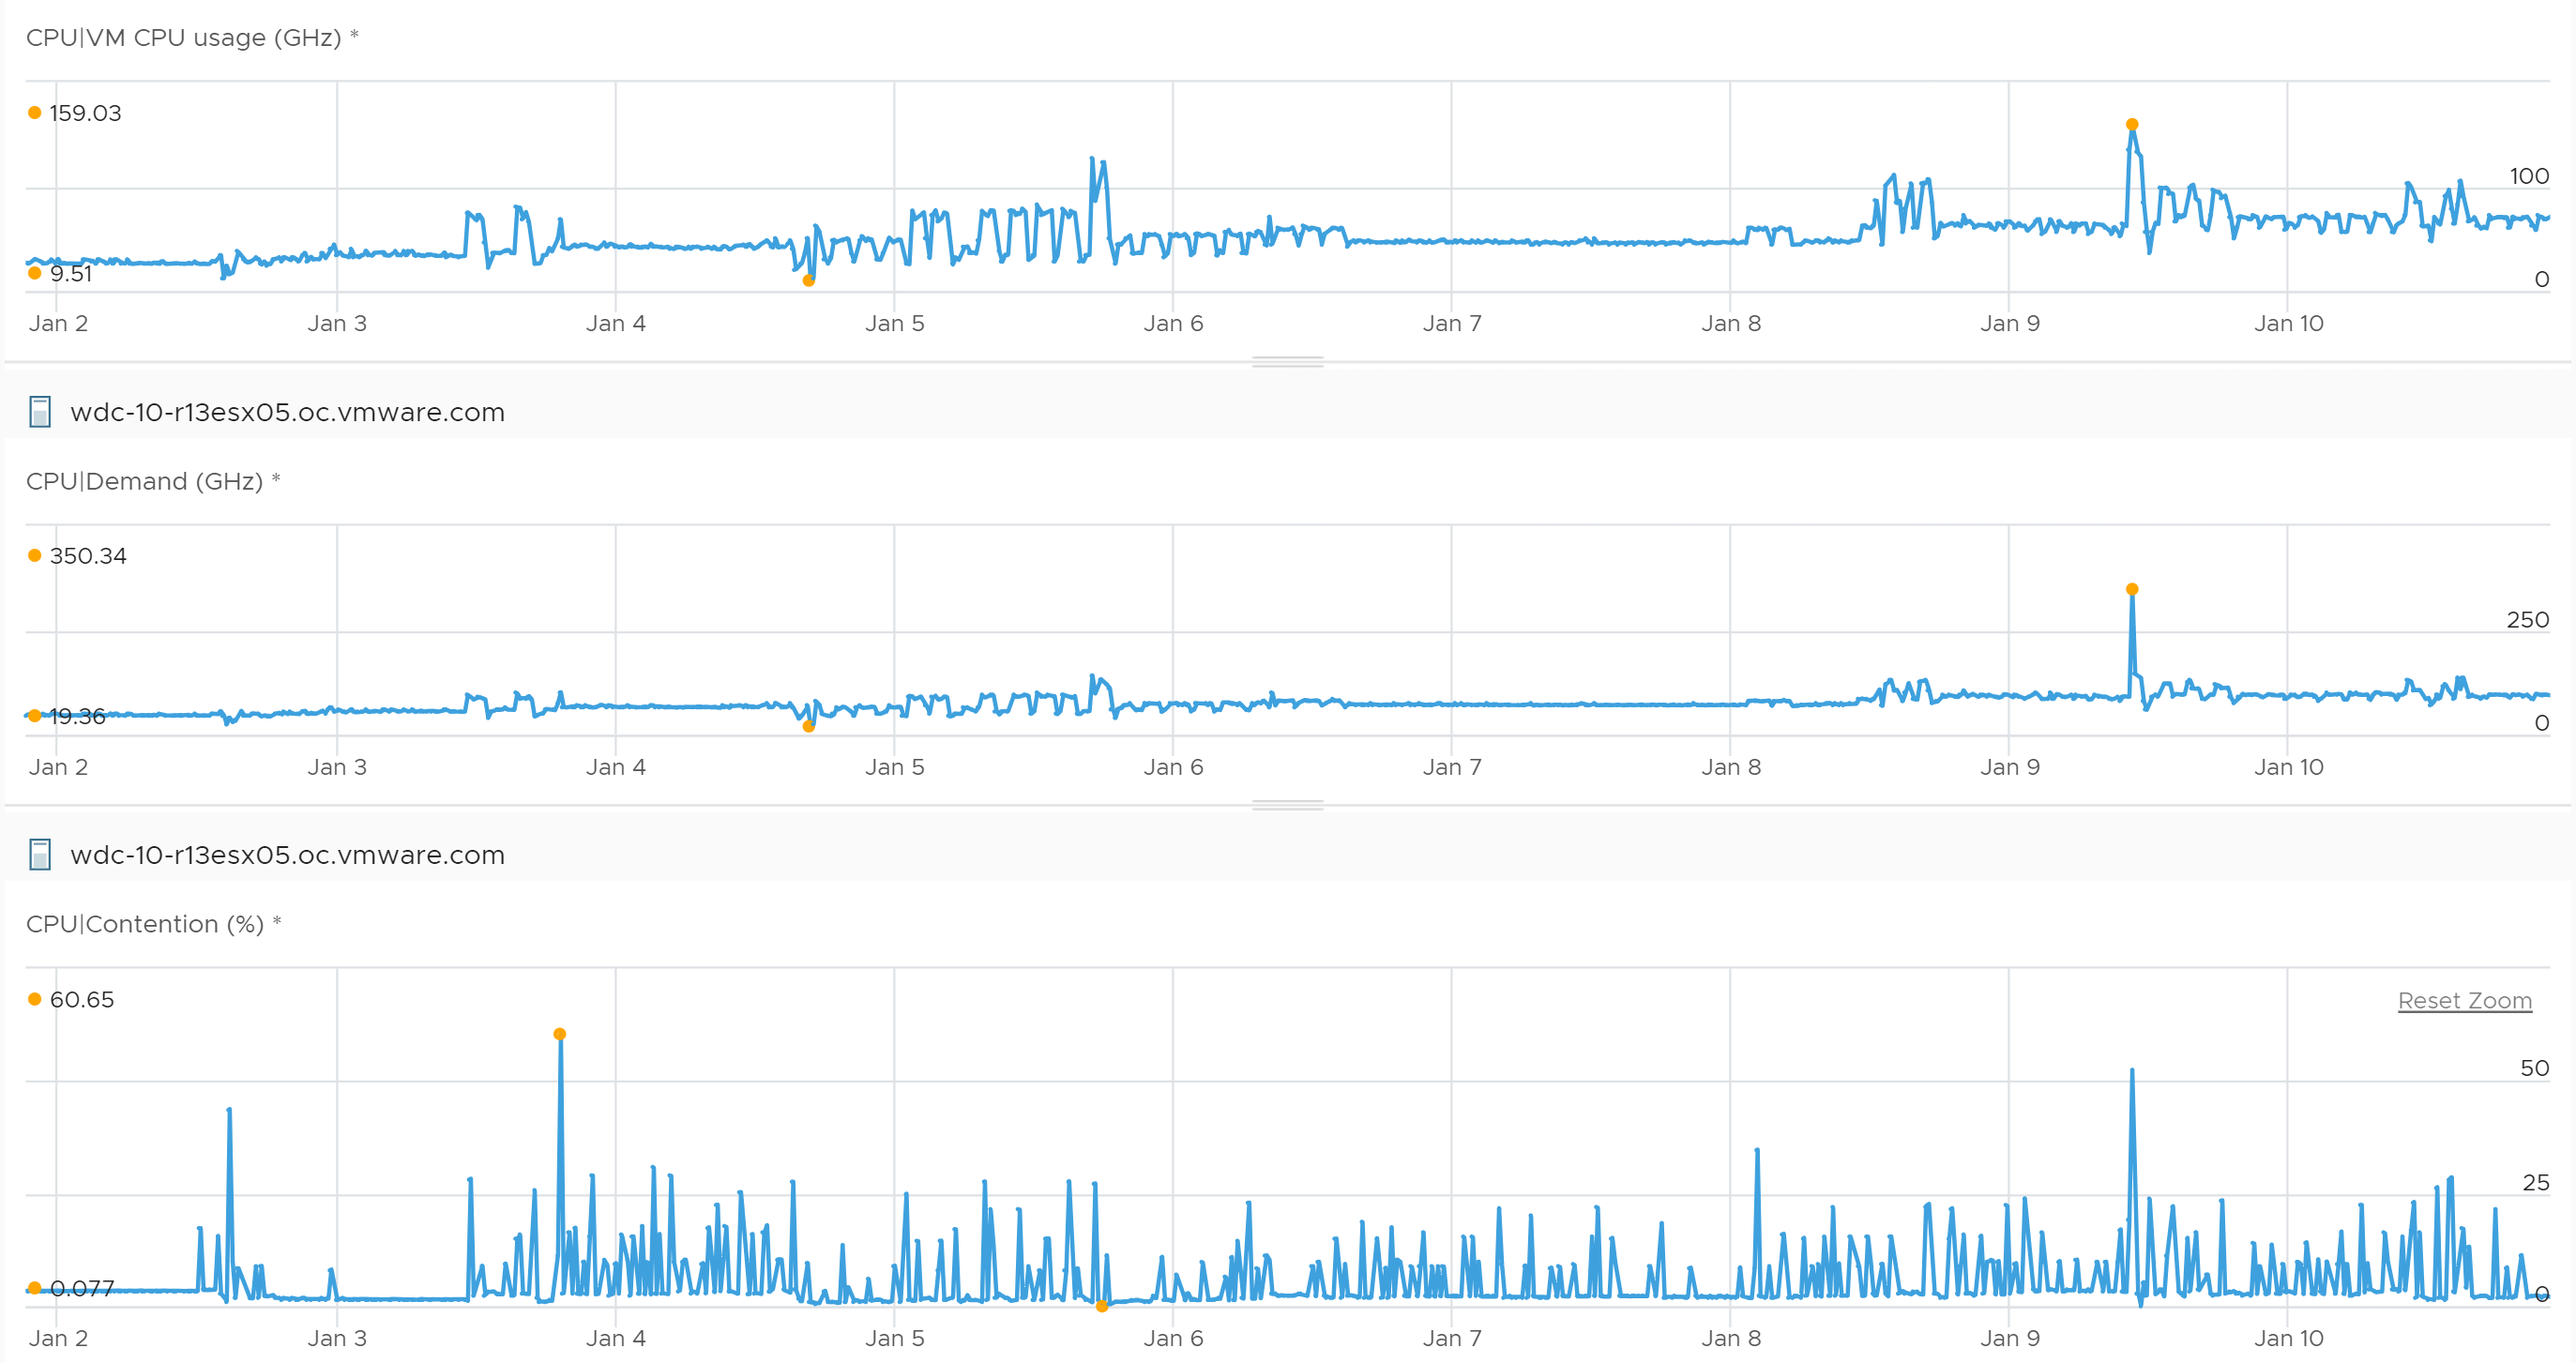
These are the reasons why they don’t match:
-
One looks at physical CPU, the other the virtual CPU. One looks at ESXi, while the other looks at VM.
-
Hyperthreading and Power Management.
-
Imbalance utilization. There are many VMs in this host. Their experience will not be identical.
-
Limit may impact the VM, either directly or via resource pool.
-
CPU pinning, although this rarely happens.
So what metrics should you use?
Here are the latency metrics provided by vSphere Client.
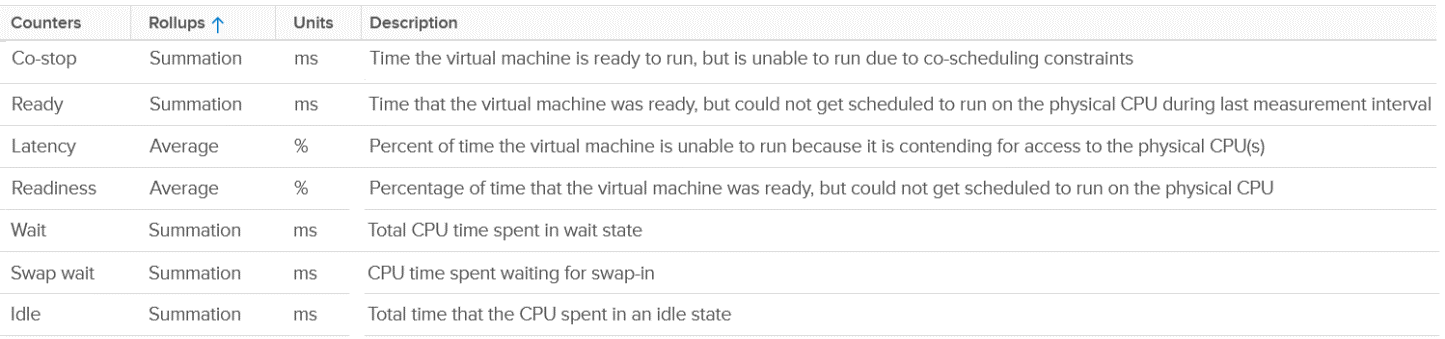
For Co-stop and Ready, the counter does not include contention faced by non VM worlds[^13].
Your operations can’t wait until problem become serious. All the built-in metrics are averaged of all the running VMs. So by the time they are high, it’s time to prepare your resume, not start troubleshooting 😉.
I’d provide a set of leading indicators to replace these lagging indicators. As performance management is best done holistically, I’d cover it as a whole. Find them under vSphere Cluster chapter as an ESXi is typically part of a cluster.
Chapter 3