Network
Architecture
Network monitoring is complex, especially in large data centers. Adding network virtualization takes the complexity of performance troubleshooting even higher.
Just like CPU, Memory and Disk, there is also a new layer introduced by virtualization. There are virtual network cards on each VM, and software-based switch on each ESXi bridging the VM card to the physical NIC card. The various ESXi kernel modules also do not “talk” directly to the physical card. Basically, what used to be the top of rack switch are now living inside each ESXi as a software switch.
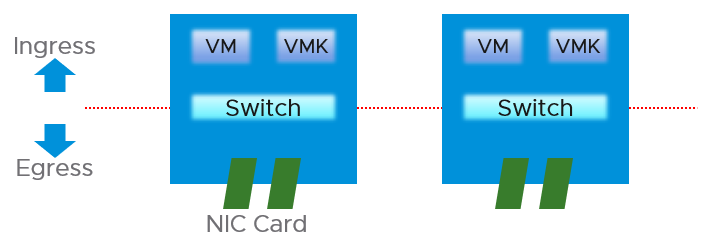
vSphere Client shows the 2 layers side by side (personally I prefer up and down, with the physical layer placed below).
| Virtual Network | There are 2 types:
They do not mix, for security reason. The kernel port group runs specific traffic, such as vMotion and vSAN. The VM port group runs VM. If the traffic is just a VM-to-VM traffic, within the same ESXi, the packets does not reach the physical network, hence the metrics do not register it. This is why the values in virtual do not always match physical. The virtual network does not have the limit that physical network does, if the traffic remains in the box. This makes it harder to troubleshoot as the total capacity is not statically defined. So instead of just monitoring the throughput metric, you should also check the packet per second metric. |
|---|---|
| Physical Network | They are called vmnic instead of pNIC Metrics at this level do not have per-VM breakdown, or per kernel interface breakdown |
Unique Characteristics
From performance and capacity management point of view, network has different fundamental characteristics to compute or storage. The key differences are summarized below.
| | Compute or Storage | Network |
|---------------------------------|--------------------|-----------------|
| Nature | A node | An interconnect |
| Hardware | Single purpose | Multi-purpose |
| Location | Fewer | Many |
| Upper Limit | Yes | No |
| Net available resource to VM | Relatively high | Low |
| Resource allocation at VM level | Granular | Coarse |
| Monitoring | Simpler | Harder |
| Workload Type | 1 | Many |
| Primary Unit | Byte | Bit |
Nature of Network
Compute and storage are nodes. They are dots, while network are lines.
When you have a CPU or RAM performance issue on one host, it doesn't typically impact another host on a different cluster. The same thing happens with storage. When a physical array has a performance issue, generally speaking it does not impact other arrays in the data center.
Network is different. A local performance issue can easily be a data center-wide problem. Here is a good read by shared Ivan Pepelnjak. To give a recent example (H2 2021), here is one from a world-class network operator[^19]:
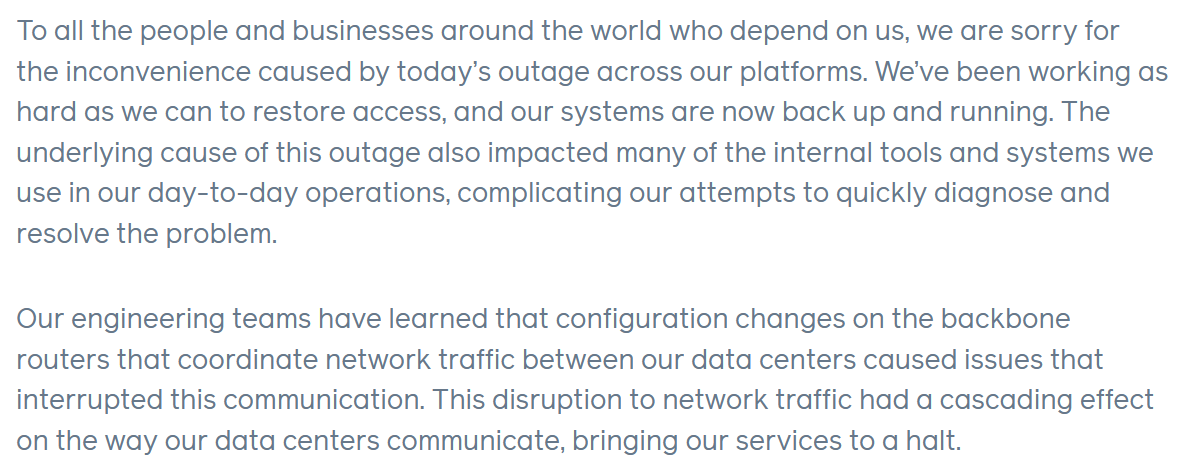
Being an interconnect, it also connects users and servers to the Internet. If you have a global operation, you likely have multiple entry points, provided by different providers. These connectivity needs to be secured and protected with HA, preferably from 2 different ISPs.
There are typically many paths and routes in your network. You need to ensure they are available by testing the connectivity from specific points.
Hardware
The networking hardware itself can provide different functionalities.
For compute, you have servers. While they may have different form factors or specifications, they all serve the same purpose—to provide processing power and a set of working memory for hypervisor or VM.
For network, you have a variety of network services (firewall and load balancer) in addition to the basic network functionalities (switch, router, and gateway). You need to monitor all of them to get a complete picture. These functionalities can take the form of software or hardware.
Unlike storage, network has concept of duplex. A full duplex means it has 100% on both directions. For example, an ESXi with a 25 Gb port can theoretically handle 25 Gb TX + 25 Gb RX as its full duplex.
Blade servers and other HCI form factors blur the line between server and network.
Location
Server and storage tend to be located fewer places. Even in the ROBO office, they are typically located in a rack, with proper cooling and physical security. Network switch, especially Wireless Access Points, need to be placed in multiple places within the building, if that’s required to provide enough network coverage.
Solution such as SDWAN even requires a network device to be deployed at employee home. I actually have the Dell edge device at my home.
Total Capacity
CPU or RAM workload have a per VM physical limit. This makes capacity management possible, and aids in performance troubleshooting.
While network has a physical limit, it can be misleading to assume it is available to all VMs all the time. Because the physical capacity of the network is shared, you have a dynamic upper limit for each workload. The VM Network port group will have more bandwidth when there is no vMotion happening. Furthermore, each VM has a dynamic upper limit as it shares the VM Network port group with other VMs.
The resource available to VM also varies from host to host. Within the same host, the limit changes as time progresses. Unlike Storage I/O Control, Network I/O Control does not provide any metrics that tell you that it has capped the bandwidth.
In many situations, the bandwidth within the ESXi host may not be the smallest pipe between the originating VM and its destination. Within the data center, there could be firewalls, load balancers, routers, and other hops that the packet has to go through. Once it leaves the data center, the WAN and Internet are likely to be a bottleneck. This dynamic nature means every VM has its own practical limit.
Net Available Resource
At the end of the day, the net available resources to the VMs are what we care about. What the IaaS platform used is considered an overhead. The more ESXi kernel, NSX, vSAN, vSphere Replication use, the lesser you have left for the business workload.
An ESXi host has a fixed specification (for example, 2 CPUs, 60 cores, 1 TB RAM, 2 x 50 GE NIC). This means we know the upper physical limit. How much of that is available to the VMs? Another word, what is the usable capacity for the business workload?
For compute, the hypervisor consumes a relatively low proportion of resources. Even if you add a software-defined storage such as vSAN, you are looking at around 10% total utilization but depends on many factors.
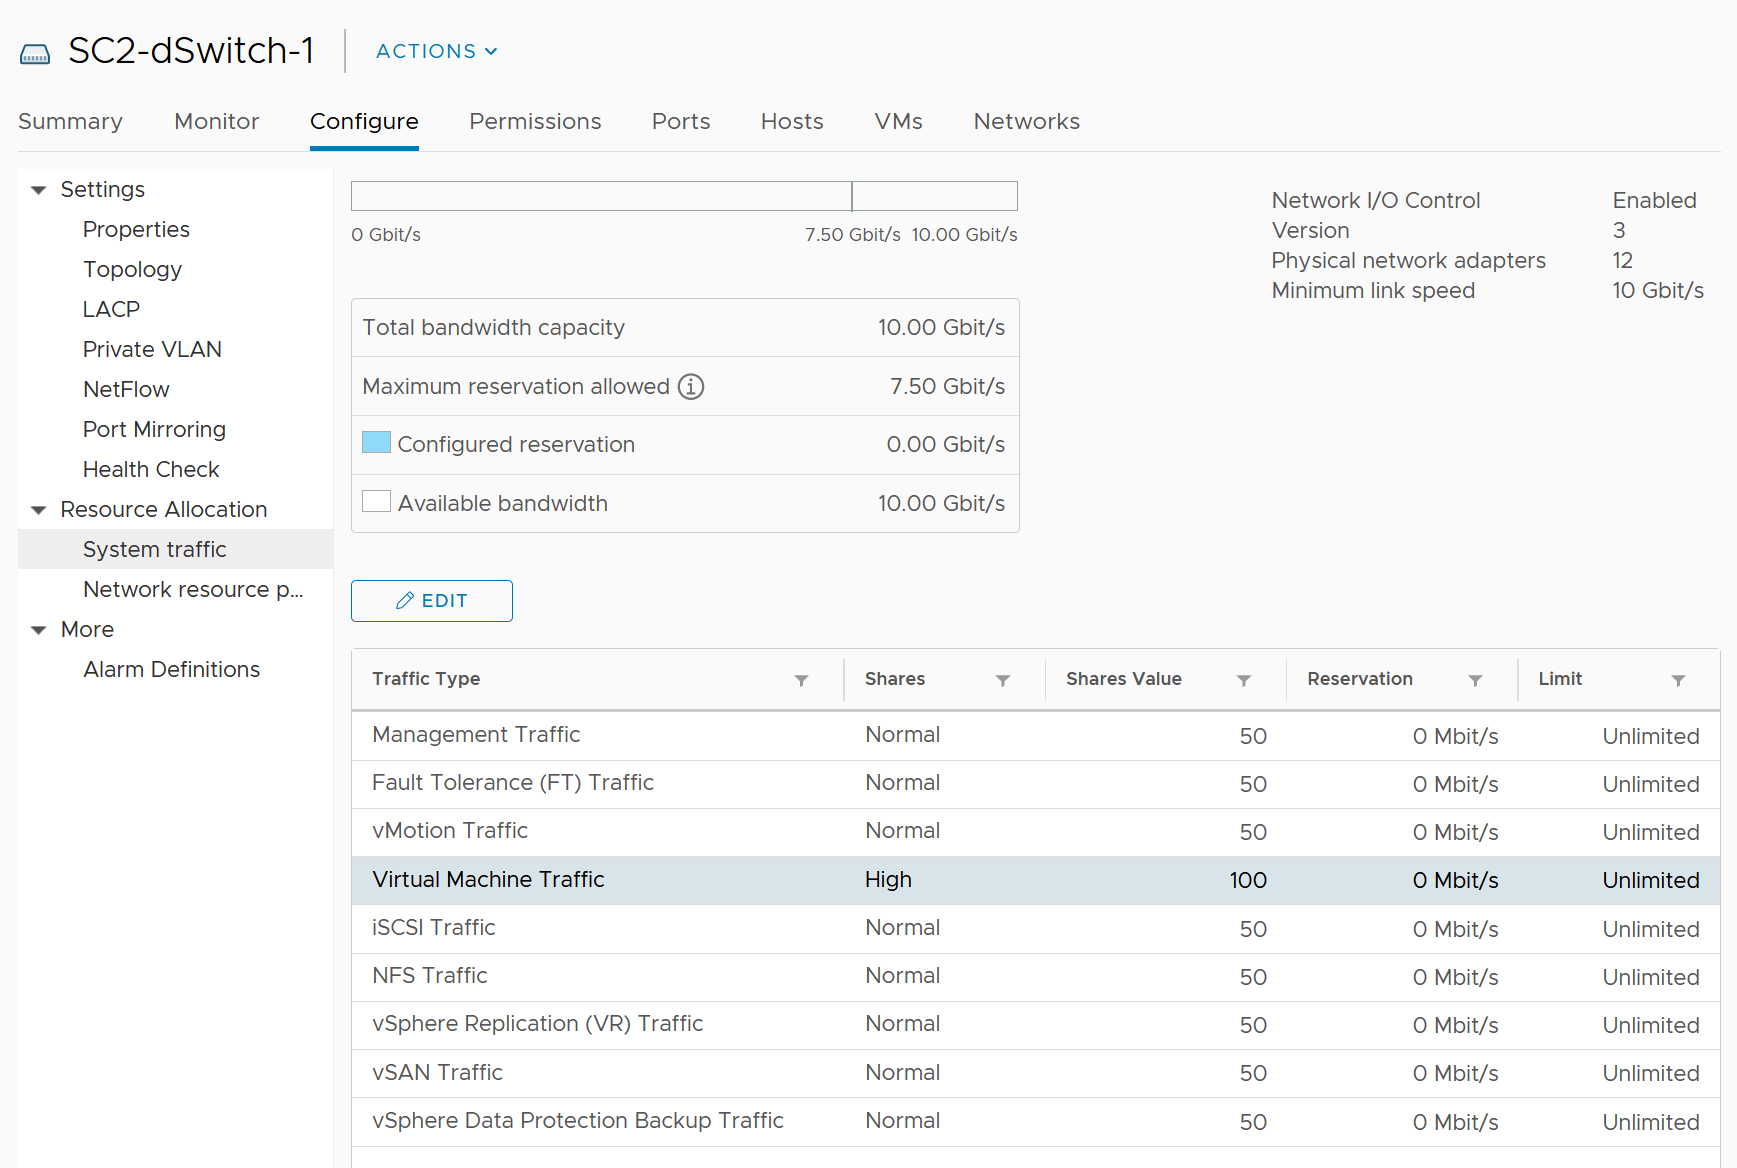
The same cannot be said about network. Mass vMotion (for example, when the host enters maintenance mode), storage vMotion (in IP storage case), VM provisioning or cloning (for IP storage), and vSAN all take up significant network bandwidth. In fact, the non-VM network takes up the majority of the ESXi resources. If you have 2 x 25 GE NIC, majority of it is not used by VM. The following screenshot shows that VM only gets 100 shares out of 500 shares. So the overhead can be as high as 80%.
Resource Allocation
This means the resource that is given to a single VM itself. For compute, we can configure a granular size of CPU and RAM. For the CPU, we can assign one, two, three, four, etc. vCPUs.
With network, we cannot specify the vNIC speed. It takes the speed of the ESXi vmnic assigned to the VM port group. So each VM will either see 1 GE or 10 GE or 25 GE (you need to have the right vNIC driver, obviously). You cannot allocate another amount, such as 500 Mbps or 250 Mbps in the Guest OS. In the physical world, we tend to assume that each server has 10 GE and the network has sufficient bandwidth. You cannot assume this in a virtual data center as you no longer have 10 GE for every VM at the physical level. It is shared and typically oversubscribed.
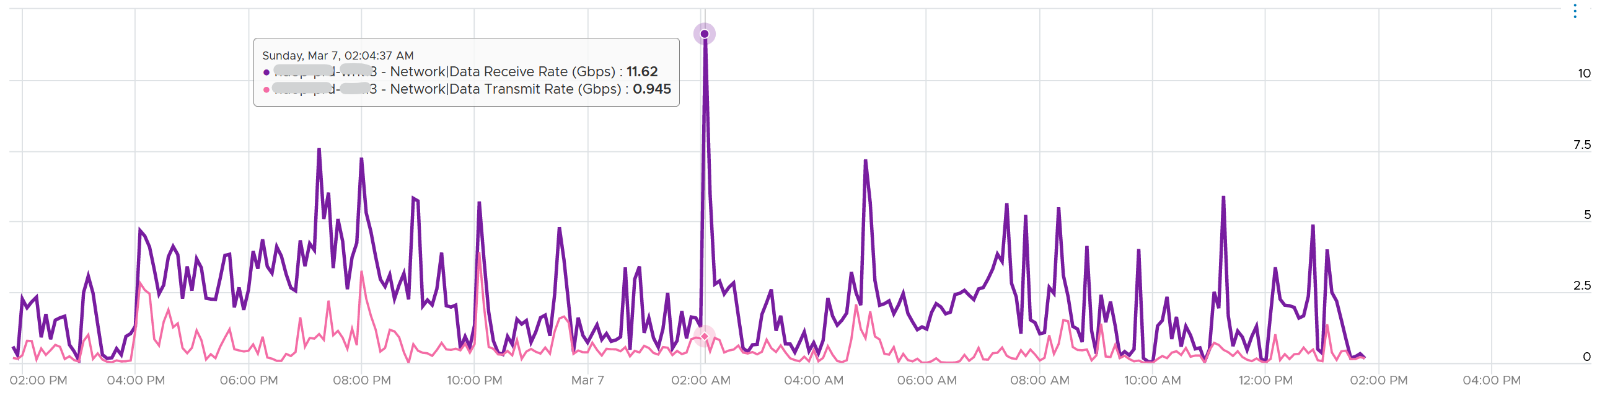
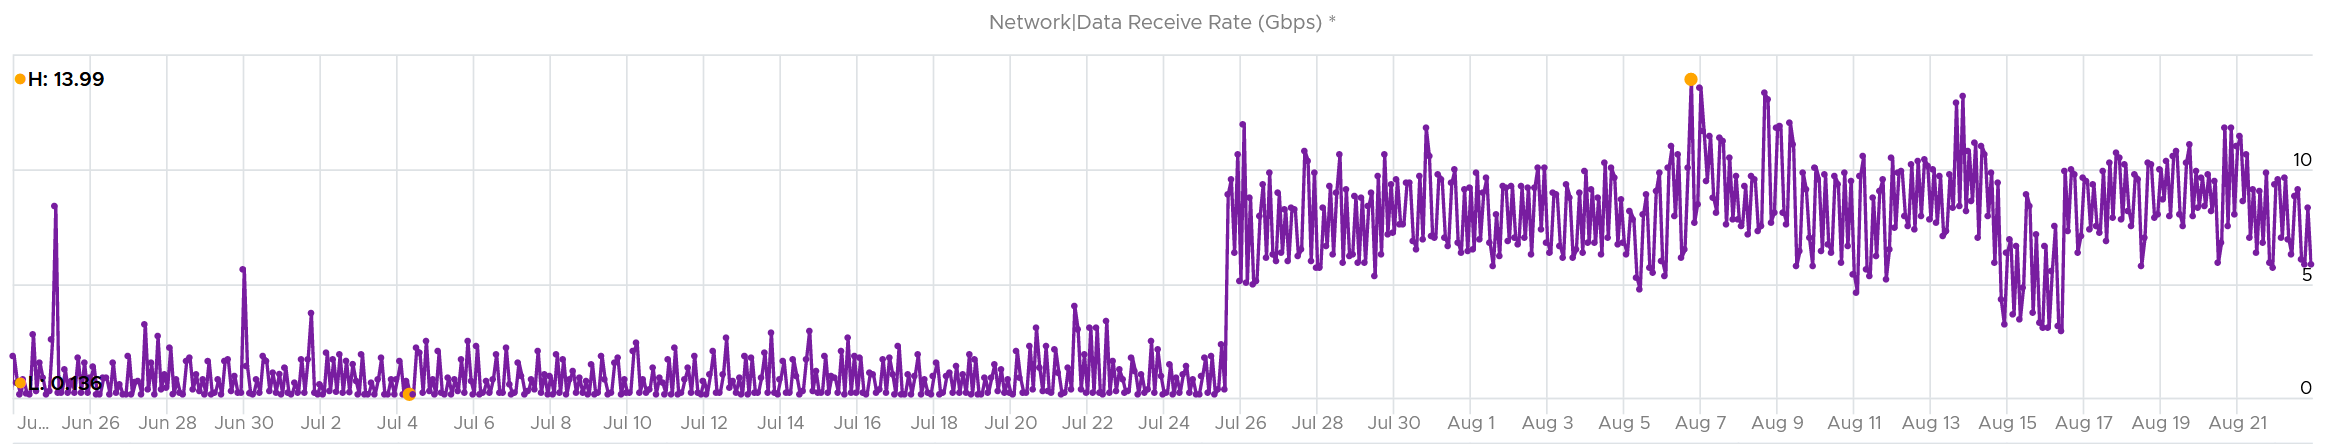
A network intensive VM can easily hit 1 Gbps for both egress and ingress traffic. The following chart shows a Hadoop worker node receiving more than 5 Gbps worth traffic multiple times. You need to be careful in sizing the underlying ESXi if you want to run multiple VMs. While you can use Network I/O Control and vSphere Traffic Shaping, they are not configuration property of a VM.
Monitoring and Troubleshooting
A distributed system is harder to monitor than a single node, especially if workload varies among the components that make up the system.
The network resource available to VM also varies from host to host. Within the same host, the limit changes as time progresses. Unlike Storage I/O Control, Network I/O Control (NIOC) does not provide any metrics that tell you that it has capped the bandwidth.
NIOC can help to limit the network throughput for a particular workload or VM. If you are using 10 GE, enable NIOC so that a burst in one network workload does not impact your VM. For example, a mass vMotion operation can saturate the 10 Gb link if you do not implement NIOC. In vCenter 7, there is no counter that tracks when NIOC caps the network throughput. You may need to check the log for that.
The primary contention metrics are
-
Latency.
-
Dropped Packets
-
Retransmit Packets. For TCP, dropped packets will be retransmitted.
-
Jitter. This measures the inconsistency of the latency. An application may tolerate poor latency better than variable latency.
Note there is no latency and retransmit metrics in vSphere.
Remember that Storage has 2 metrics (IOPS and Throughput) for consumption? Network also has these 2 types, except the more popular one is the throughput. The PPS (packet per second) is less popular although they are useful in gaining insight into your network. It takes up a significant CPU time to process high number of packets with low latency, as you can see in NSX edge VM.
Workload Type
In network, not all packets are of the same type. You can have unicast, multicast and broadcast.
Majority of traffic should be unicast, as ESXi or VM should not be broadcasting to all IP addresses in the network or multicasting to many destinations. The challenge is there are purposes for each type so you need to monitor if the broadcast and multicast happen at the wrong time in the wrong network.
Storage and Server only have 1 type of workload. From operations management viewpoint, for almost all customers, A CPU instruction is a CPU instruction. You do not care what it is. The same goes with memory access and disk IO commands.
Conclusion
Because of all these differences, the primary unit is bit, not byte. Storage uses byte as it focuses on the amount of disk space consumed by the data.
The way you approach network monitoring should also be different. If you are not the network expert in your data center, the first step is to partner with experts.
BTW, there are other things which I did not cover. For example, in network there are basic services such as DNS and NTP. All these services need to be monitored, typically for availability and reliability.
Network Observability
The arrival of software-defined infrastructure services also changes the way you monitor your network. The following diagram shows a simplified setup of an ESXi host.
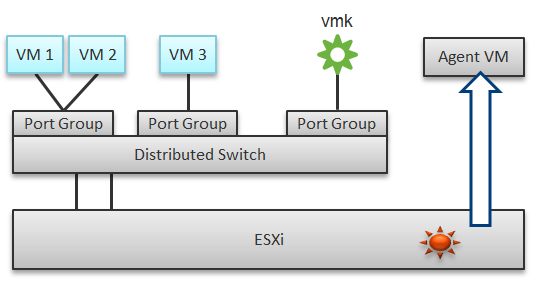
In a single ESXi host, there are 4 areas that need to be monitored for a complete network monitoring:
-
VM network
-
The kernel network
-
ESXi kernel modules
-
Agent VMs
There are 2 layers of networking.
-
The virtual network consists of VM and the kernel (e.g. vMotion). If the traffic is a VM to VM traffic within the same ESXi, the packets does not reach the physical network, hence the vmnic metrics do not register it. The virtual network does not have the limit that physical network does, if the traffic remains in the box. This makes it harder to use this metric as the 100% is not statically defined. So instead of just monitoring the throughput metric, you should also check the packet per second metric.
-
The physical network means traffic going through the physical network card. At this level it’s no longer aware of VM and the kernel.
In the preceding example, we have 3 VMs running in the host. VM 1 and VM 2 are connected to the same VXLAN (or VLAN). VM 3 is on a different VXLAN (or VLAN), hence it is on a different port group. Monitoring at port group level complements monitoring at VM level and ESXi level.
Traffic at Distributed Switch level carries more than VM traffic. It also carries the kernel traffic, such as vMotion and VSAN. Both the kernel network and VM network tend to share the same physical uplinks (ESXi vmnic). As a result, it’s easier to monitor at port group level.
Sounds good so far. What is the limitation of monitoring at distributed port group level?
The hint is at the word distributed.
Yes, the data is the aggregate of all the ESXi hosts using that distributed port group!
By default, VM 1 and VM 2 can talk to each other. The traffic will not leave the ESXi. Network monitoring tools that are not aware of this will miss it. Traffic from VM 3 can also reach VM 1 or VM 2 if NSX Distributed Logical Router is in place. It is a kernel module, just like the NSX Distributed Firewall. As a result, monitoring these kernel modules, and the host overall performance, becomes an integral part of network monitoring.
The 4th area we need to monitor is Agent VM. An Agent VM is mapped to 1 ESXi Host. It does not need HA protection as every ESXi host has one, hence it typically resides on the host local datastore.
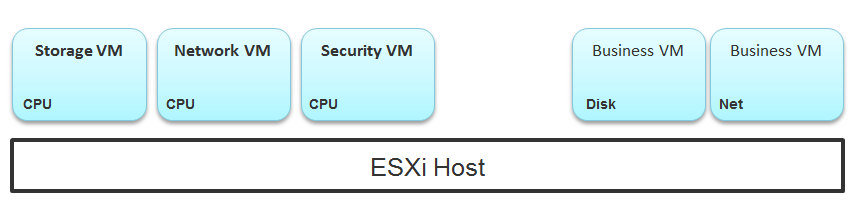
The above example shows an ESXi host with 3 agent VMs. The first VM provides a storage service (an example is Nutanix CVM), the second VM provides Network service, and the 3rd VM provides a Security VM.
Let’s use the Security service as an example. A popular example here is Trend Micro Deep Security virtual appliance. It is in the data path. If the Business VMs are accessing files on a fileserver on another network, the files have to be checked by the security virtual appliance first. If the agent VM is slow (and it could be due to factor that is not network related), it will look like a network or storage issue as far as the business VMs are concerned. The Business VMs do not know that their files have been intercepted for security clearance, as it is not done at the network level. It is done at the hypervisor level.
Source of Data
A complete network monitoring requires you to get the data from 5 different sources, not just from vSphere. In SDDC, you should also get data from the application, Guest OS, NSX and NetFlow/sFlow/IPFIX from VDS and physical network devices. For VDI, you need to get data at application level. We have seen packet loss at application-layer (Horizon Blast protocol) when Windows sees no dropped packet. The reason was the packet arrives out of order and hence unusable from protocol viewpoint.
The following shows a simplified stack. It shows the five sources of data and the 4 tools to get the data. It includes a physical switch as we can no longer ignore physical network once you move from just vSphere to complete SDDC.
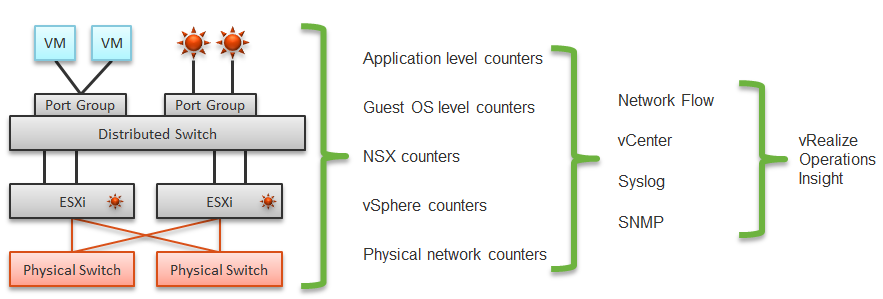
The network packet analysis comes in 2 main approaches: Header analysis and full packet analysis. The header analysis is certainly much lighter but lack the depth of full analysis. You use this to provide overall visibility as it does not impose heavy load on your environment.
The impact of virtualization on network monitoring goes beyond what we have covered. Let’s add NSX Edge into the above, so you can see the traffic flow when the edge services are also virtualized. You will see that a network problem experienced by a VM on one ESXi could be caused by another VM running on another ESXi. The following diagram is a simplified setup, showing a single NSX Edge residing on another cluster.
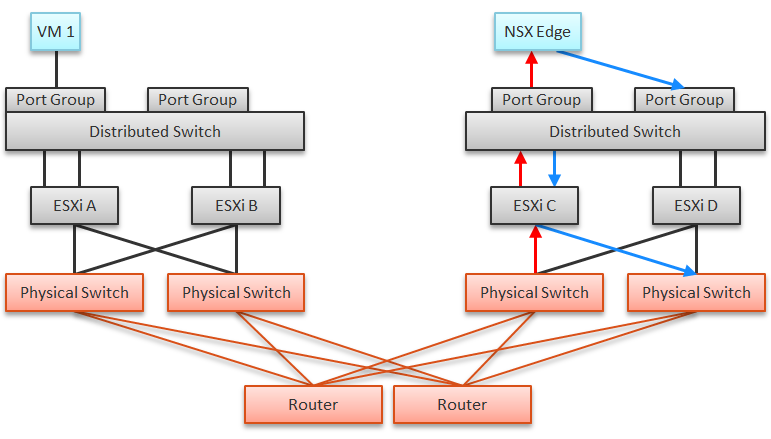
In the above example, let’s say VM 1 needs to talk to outside world. An NSX Edge VM provides that connectivity, so every TCP/IP packet has to go through it. The Edge VM has 2 virtual NICs, one for each network. If the NSX Edge VM has CPU issue, or the underlying ESXi has RAM issue, it can impact the network performance of VM 1.
| Type | Guest OS Metric | VM Equivalent |
|---|---|---|
| Contention | Dropped Packet | None, as the dropped packet at VM is a different level. |
| Latency | None, no such metric available in vSphere | |
| Utilization | Throughput | They should match with the metrics at VM level. If not, there is dropped packets. They should be reported based on traffic type: unicast, multicast, broadcast. |
| Packet/second |
Traffic Flow
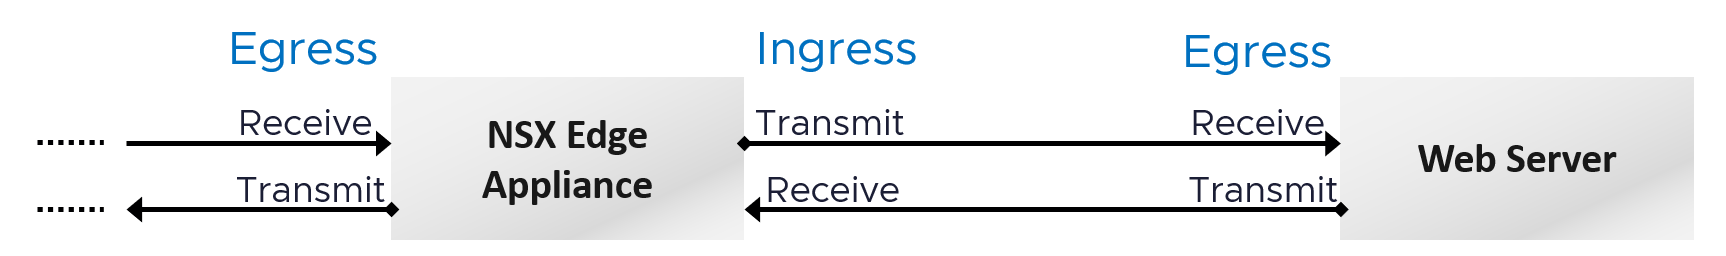
The terminology Egress and Ingress are used in context of an environment. For example, the flow from a VM to the Internet, where it will hop through different types of network devices. Typically, going further “inside” is considered ingress. That’s why a VM does not have ingress traffic.
The terminology receive/RX and transmit/TX/send are used in context of a single port. A port has both incoming and outgoing traffic.
The following shows a simple example:
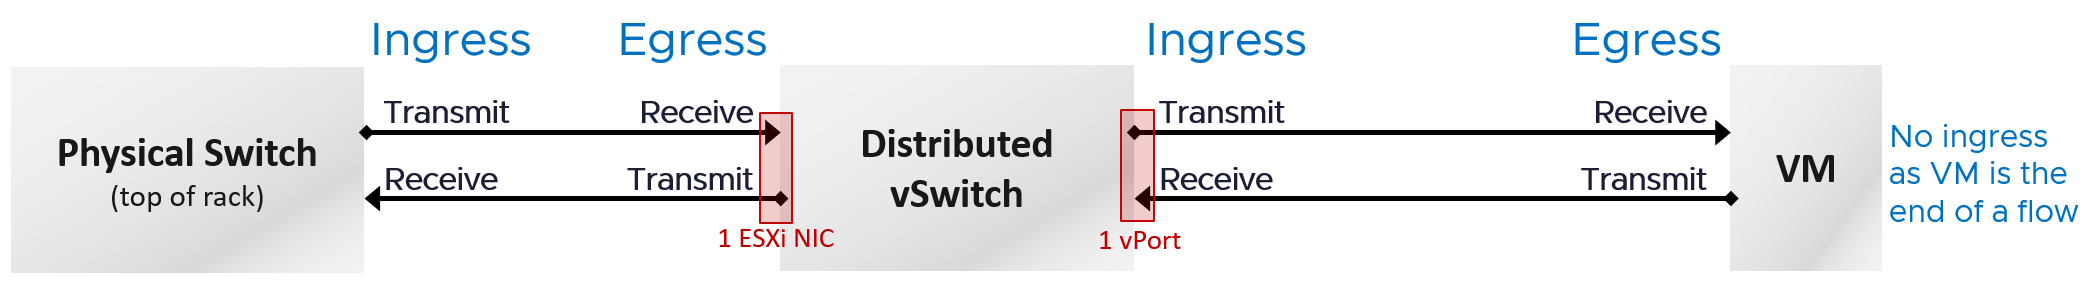
The following applies that to vSphere distributed vSwitch. Notice the ESXi host is not shown as it’s not part of the hop. The ESXi host physical NIC card is the distributed vSwitch uplink.
Traffic Type
VCF Operations provides these metrics at VM, ESXi, Distributed Port Group and Distributed Switch level. As vSphere Tanzu Pod is basically a VM, it also has the metric.
BTW, one way to check what objects in what adapter have the specific metric is in the VCF Operations policy. Open any policy, and search the metric using its name. The list of matching metrics will be shown, grouped by the objects.
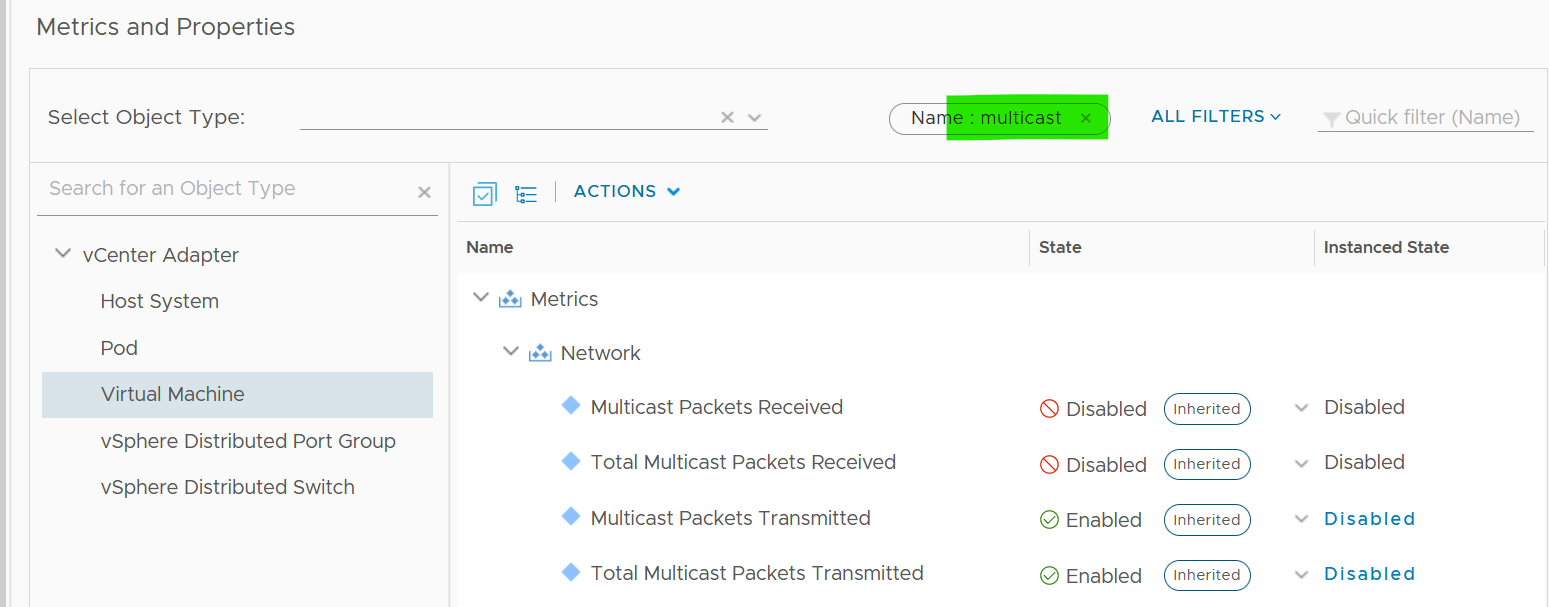
As you can see from above, there is no aggregation at higher level, so create super metric for the time being. I have not created those metric out of the box as I’m yet to use them in dashboard or alert.
Packet Size
It’s typically 1600 byte with NSX, or 9000 bytes if you enable jumbo frames).
Special purpose packet such as ping test is smaller. But they should be a small percentage of your network.
Track the packet sizes and compare them with your expectation.
VM
VM is not an Operating System, so it has far less networking metric than Windows or Linux.
Overview
We will cover each metric in-depth, so let’s do an overview first.
As usual, we start with contention. All we have is the dropped packet metrics.
Next, you check if there are unusual traffic. Your network should be mostly unicast, so it’s good to track the broadcast and multicast packets. They might explain why you have many dropped packets. If packets are broadcast packets, it might be dropped by the network.
Next you check utilization. There are 6 metrics, but I think they are triplicate.
Each packet takes up CPU for processing, so it’s good to check if the packet per second becomes too high

The metrics are available at each individual vNIC level and at the VM level. Most VMs should only have 1 vNIC, so the data at VM level and vNIC level will be identical.
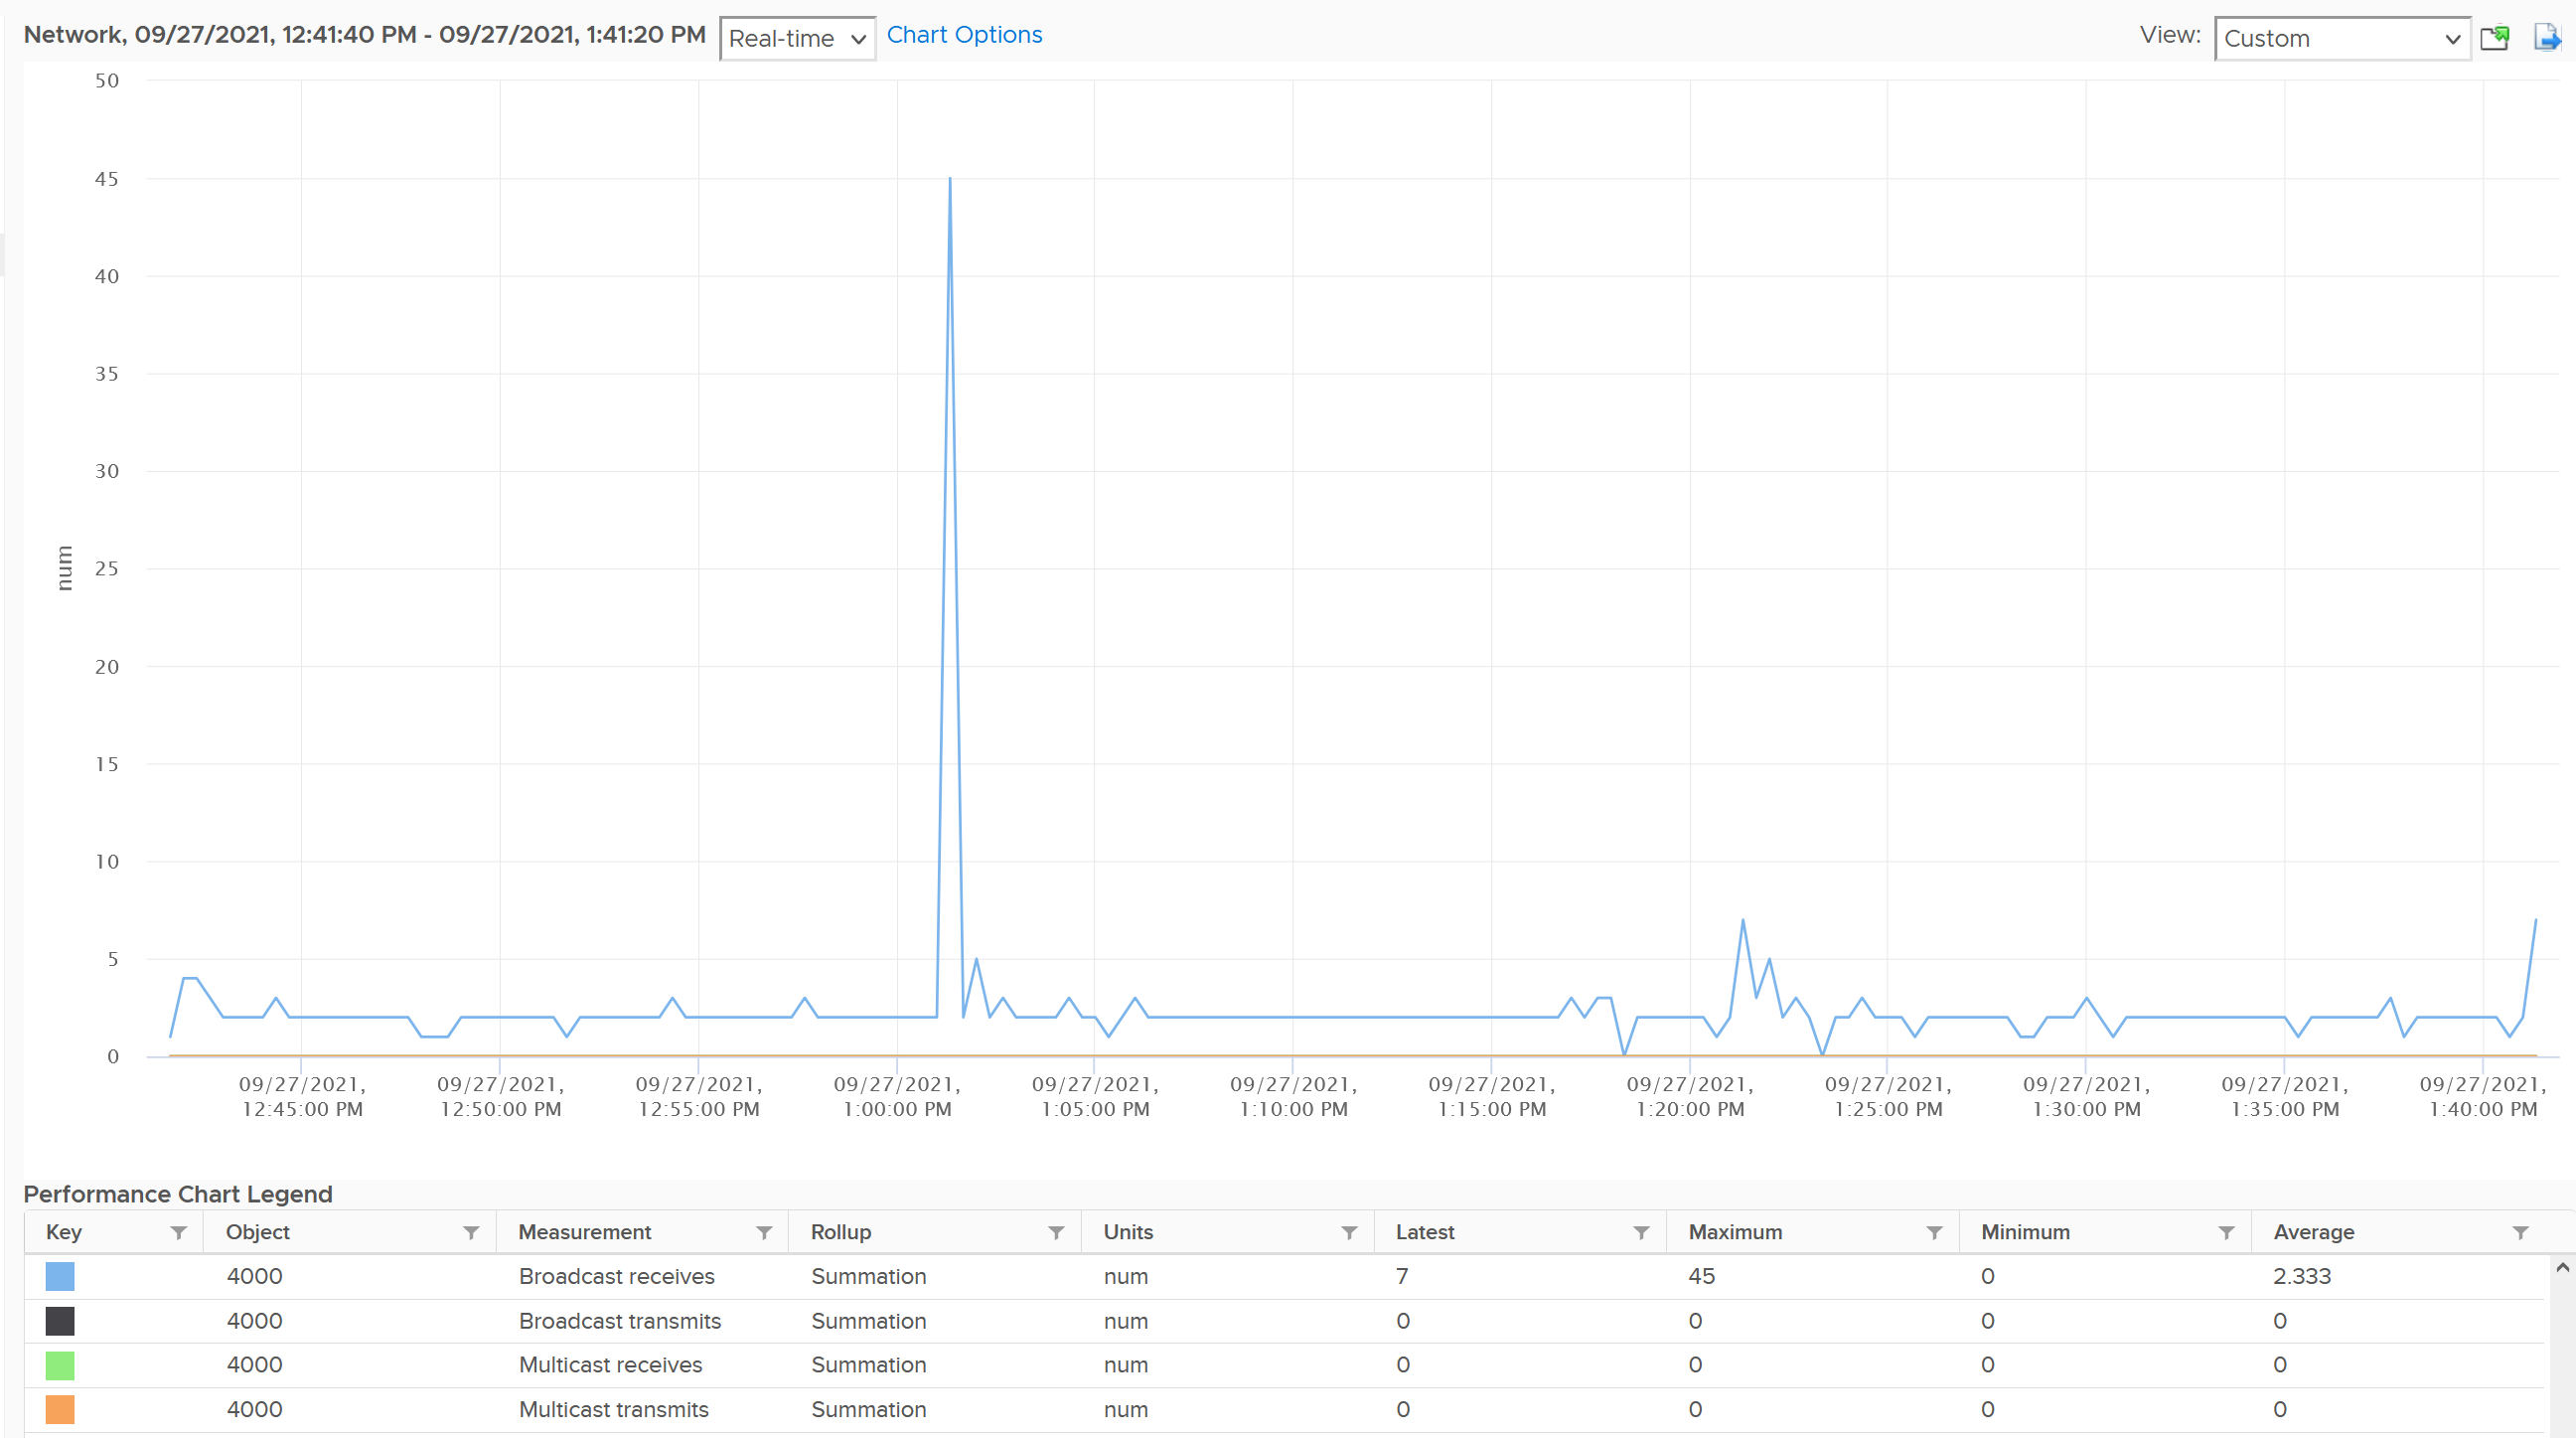
The vNICs are named using the convention "400x". That means the first vNIC is 4000, the second vNIC is 4001, and so on. The following is a vCenter VM. Notice it receives a few broadcast packets, but it’s not broadcasting (which is what you expect). It also does not participate in multicast, which is again expected.
The metrics are grouped into 2:
-
Transmit for outgoing
-
Receive for incoming.
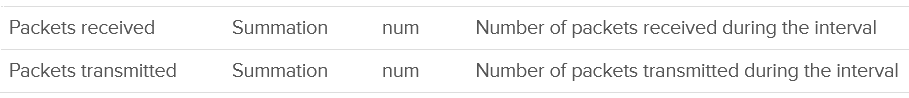
For each group, the following metrics are provided:
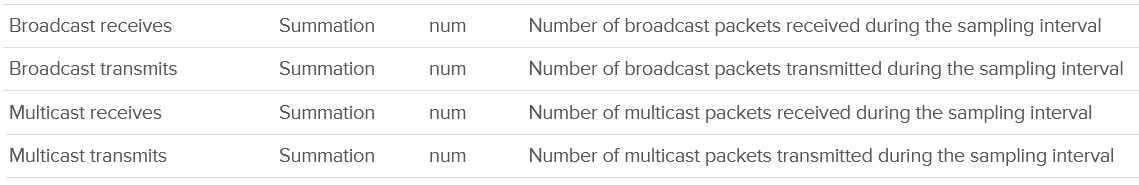
| Broadcast packets | Count of packets. It is the sum during the sampling window, not the rate (which is packet/second). Multicast packet and broadcast packet are listed separately. This is handy as they are supposed to low for most VM. Understand the nature of the applications so you can check if the behaviour is normal or not. |
| Multicast packets | |
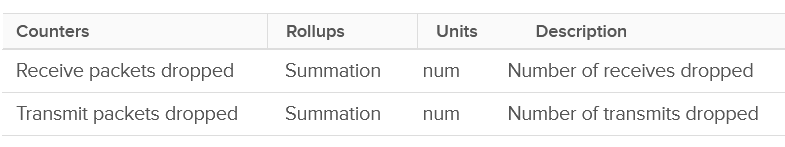
| Packet dropped | |
| Total packets | The total includes the broadcast and multicast, but not the dropped ones. |
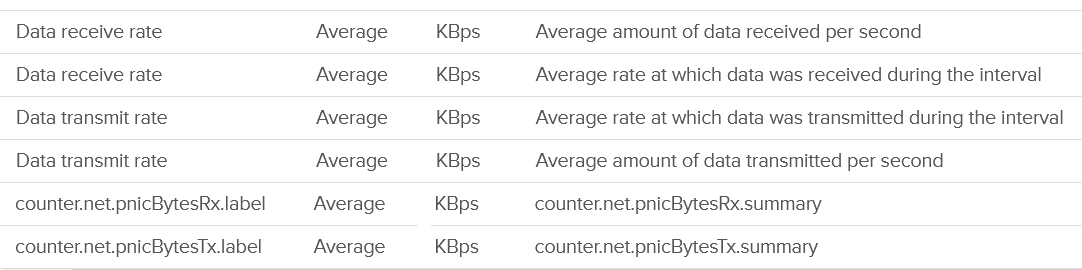
| Throughput per second | This is measured in kilobyte, as packet length is typically measured in bytes. While there are other packet sizes, the standard packet is 1500 bytes. BTW, esxtop measures in megabit. I assume this includes broadcast and multicast, but not the dropped packet. |
Guess what metrics are missing?
-
Retransmit. This can be useful in troubleshooting TCP packet. It naturally does not apply to UDP traffic.
-
Latency.\
A normalized latency would help, especially if it’s broken into internal network and external network. Network latency could be impacted by CPU. CPU might not fast enough to process the packet. In VM, this could also be due to the VM having CPU contention.\
If the latency is caused by too many hops and firewall, optimize the traffic using tools such as vRealize Network Insight.
-
Packets per second. This can be derived by packet count / sampling window. If you have 200 packets in 20 seconds, that means 10 packets per second.
-
Packet size. This can be computed by throughput / packet count. Expect this to be around 1500 byte.
BTW, if you see a pair of metrics with identical name, but one of them is prefixed with “Total”, avoid the one without “Total.” They are averaged over 15 data points, so their value is 15x lower.
Contention Metrics
As usual, let’s approach the metrics starting with Contention. We covered earlier that the only contention metric is packet loss.
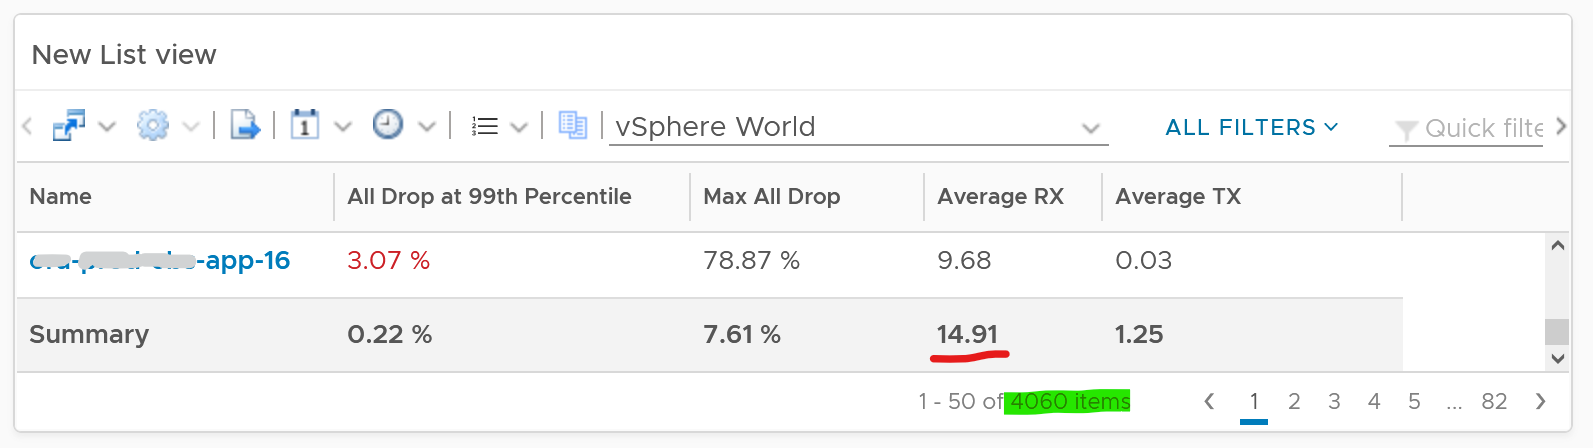
For TCP connection, dropped packet needs to be retransmitted and therefore increases network latency from application point of view. The counter will not match the values from Guest OS level. RX packets are dropped before it’s handed into Guest OS, and TX packets are dropped after it left the Guest OS. ESXi dropped the packet because it’s not for the Guest OS or it violates the security setting you set.
The following summary proves that receive packet gets dropped many more times than transmit packet. This is based on 3938 VMs. Each shows the last 1 month, so approximately 35 million data points in total. The average of 35 million data points show that dropped RX is significantly higher than dropped TX. This is why it’s not in the SLA.
The following table shows that the drop is short and spiky, which is a good thing. The value at 99th percentile is 35x smaller than the value at 100th percentile.
The high value in receive can impact the overall packet dropped (%) counter, as it’s based on the following formula
dropped = Network|Received Packets Dropped + Network|Transmitted Packets Dropped
delivered = Network|Packets Received + Network|Packets Transmitted
Network|Packets Dropped (%) = dropped / (dropped + delivered) * 100
I’ve seen multiple occurrences where the packet dropped (%) jumps to well over 95%. That’s naturally worrying. They typically do not last beyond 15 minutes.
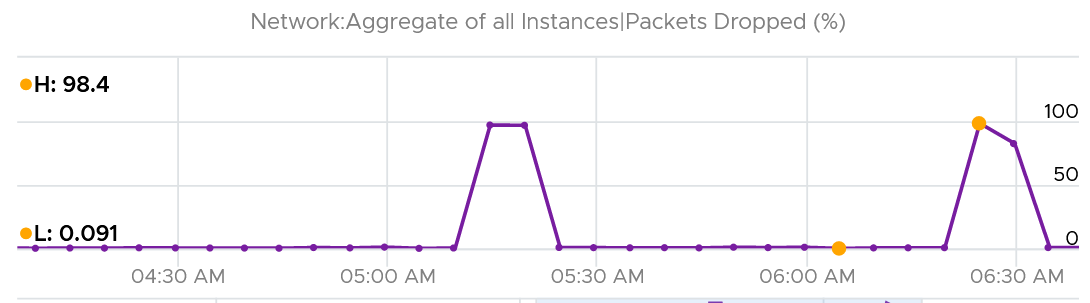
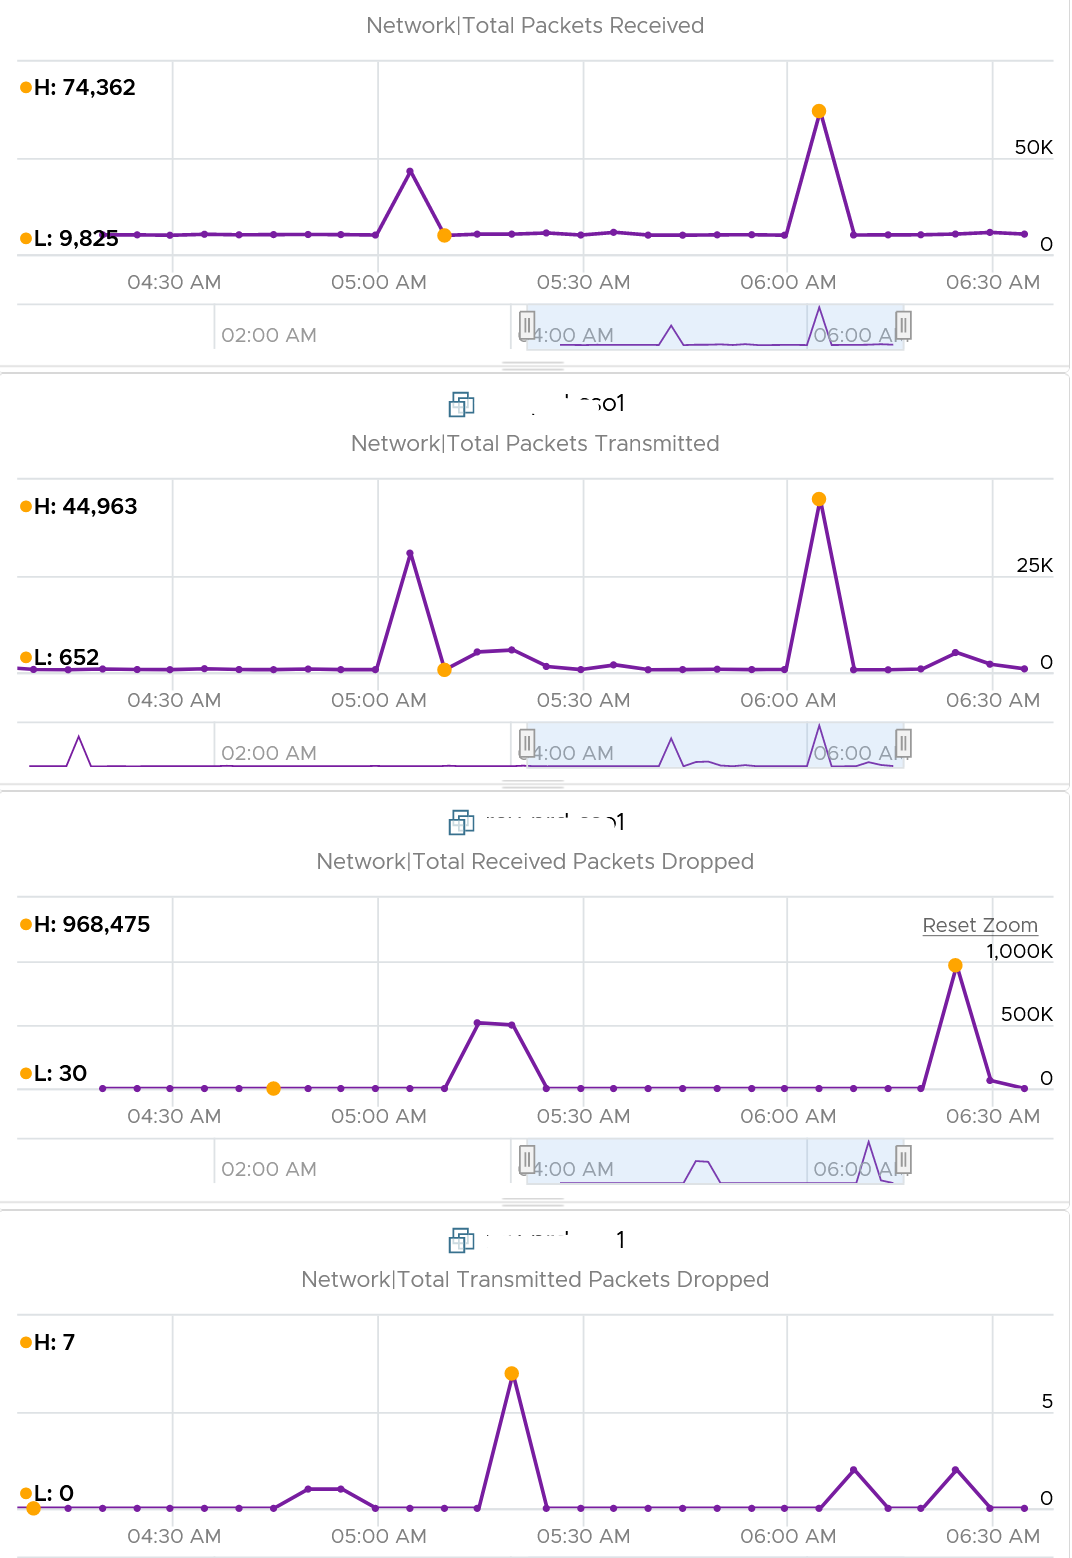
In this, plot the following 4 metrics. You will likely notice that the high spike is driven by low network throughput and high received packet dropped.
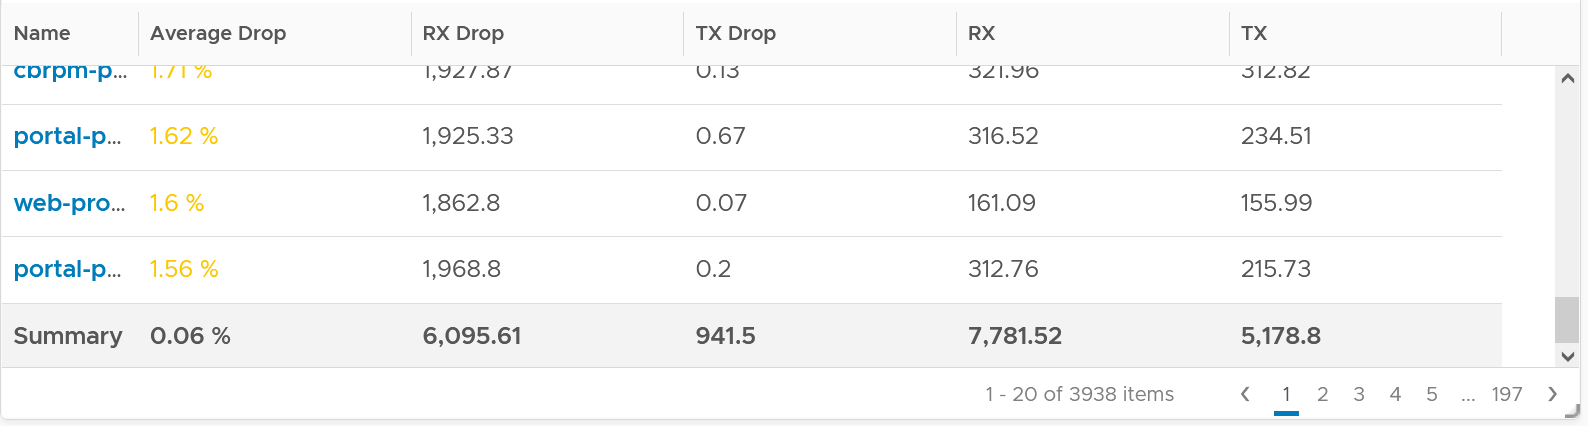
Because of the above problem, profile your VM dropped packets, focusing on the transmit packets. The following is one way to do it, giving surprising results like this:
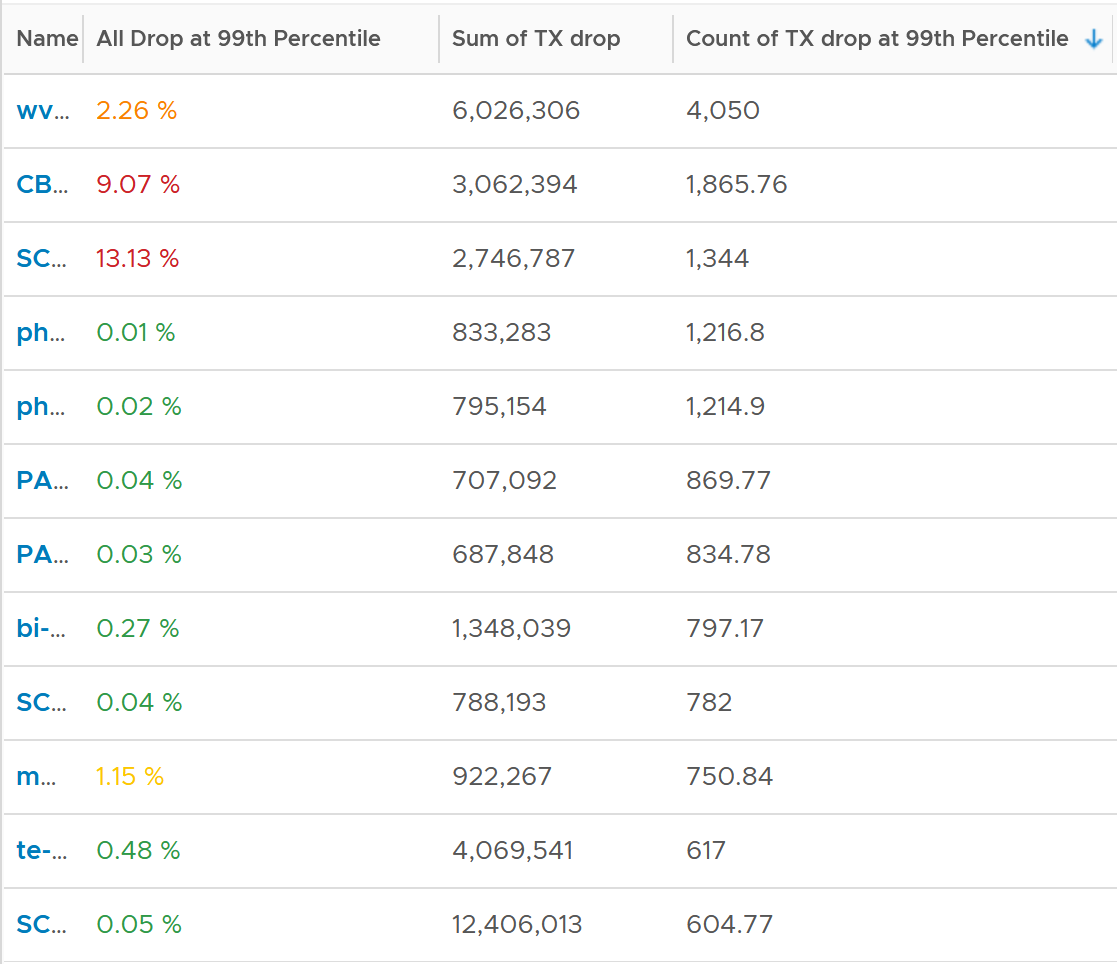
The design of the preceding table is:
-
First column calculates the percentage packets dropped. I took 99th percentile else many of the results will be 100%.
-
Second column sums all the transmitted dropped packets (actual packet counts).
-
Third column takes the 99th percentile maximum of dropped packet within any 300 seconds. Each network packet is typically 1500 bytes. Using 1.5 KB packet size, 1 thousand packets dropped = 1500 MB worth of packets within 300 seconds.
I don’t expect dropped packets in data center network, so to see millions of dropped packets over a month needs further investigation with network team. Moreover, those metrics are Transmit, not Received. So the VM sent them but they got dropped. No one seem to complain, because packets are automatically retransmitted.
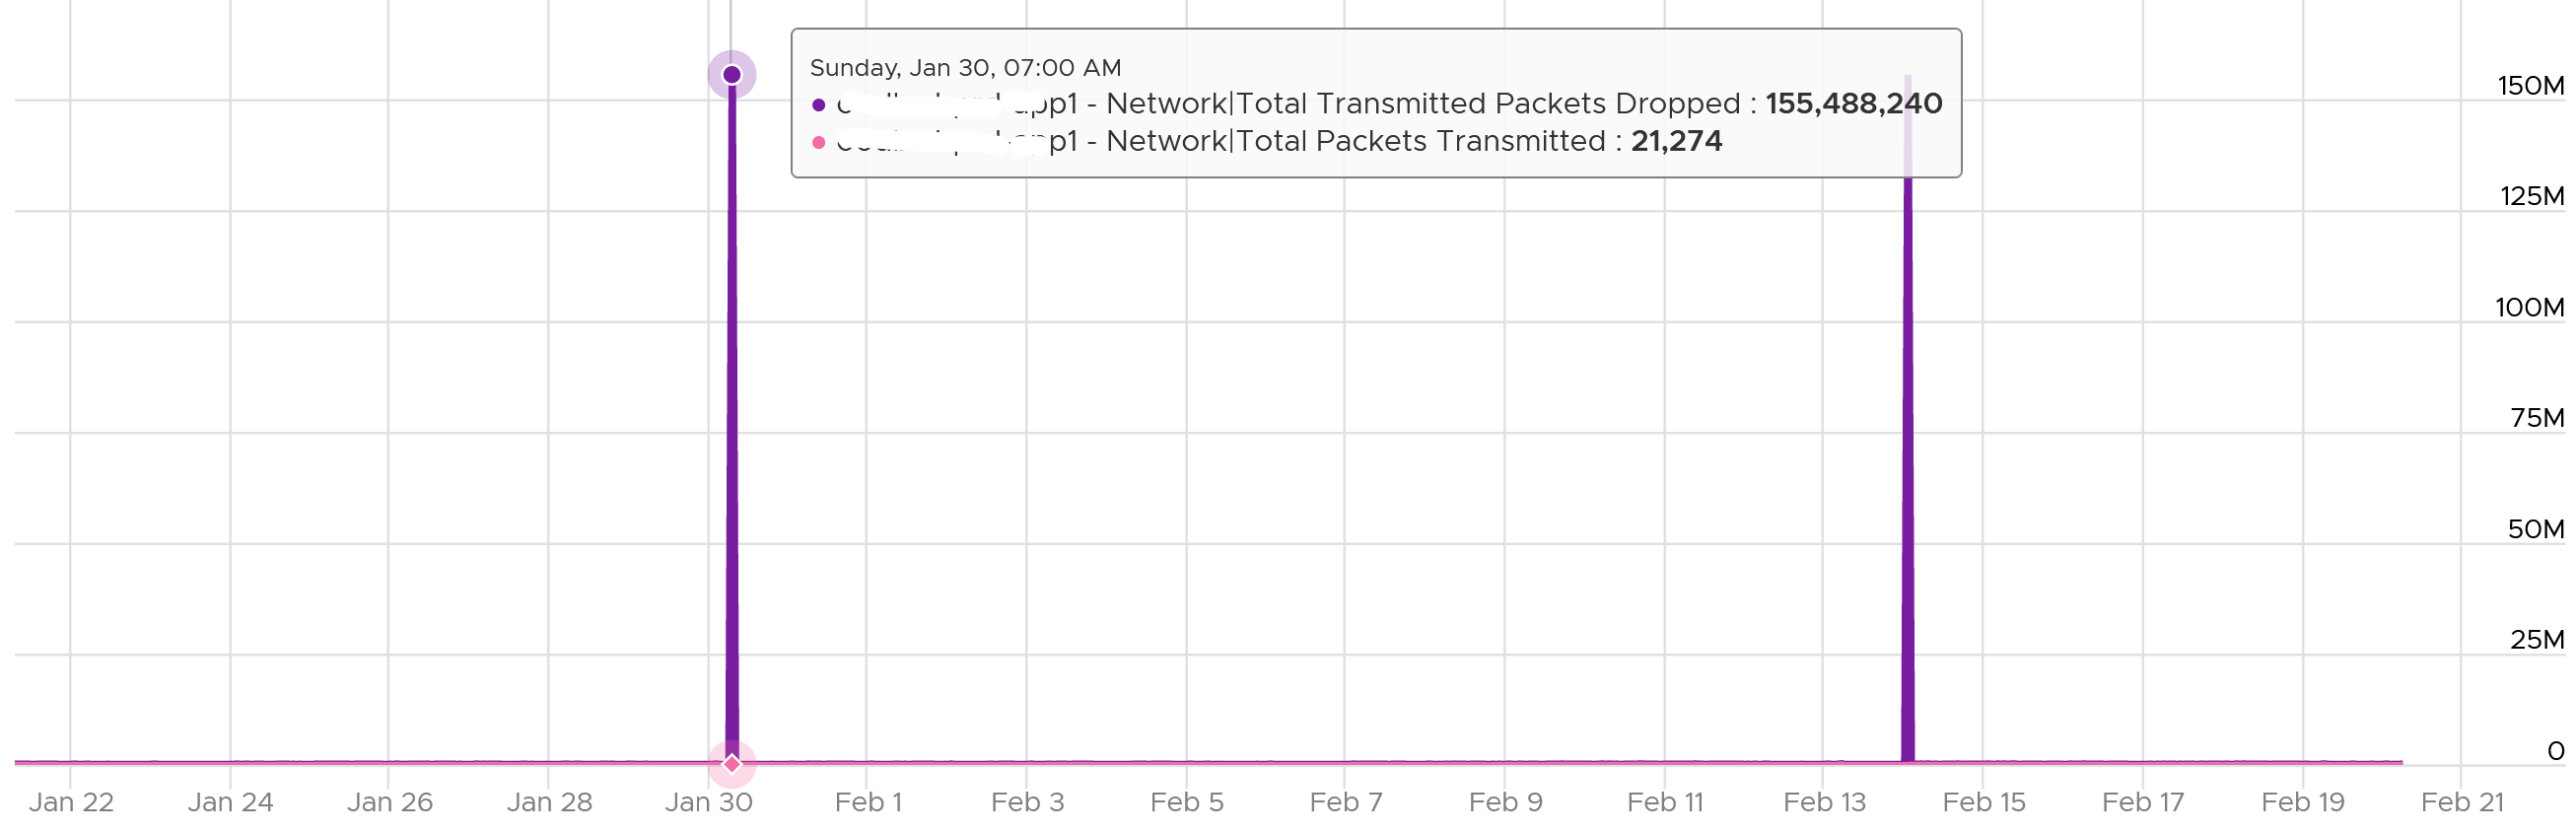
What I typically notice is the spike rarely happens. They look like an outlier, especially when the number is very high. The following is an example. I only showed in the last 1 month as the rest of the 6 months had similar pattern. The jump is well cover 100 million packets, and they were all dropped. Assuming each packet is 1 KB, since VCF Operations reports every 5 minutes, that’s 333 MB per second sustained for 300 seconds.
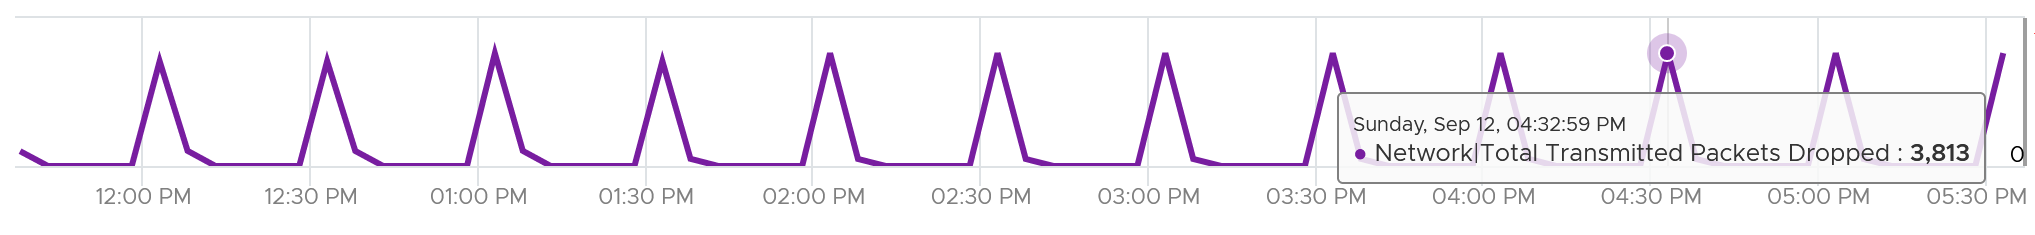
I also notice regular, predictable pattern like this. This is worth discussing with network team. It’s around 3800 packets each 5-minute, so it’s worth finding out.
False positive on TX dropped packet because NSX firewall reject the outgoing packet. See this KB article.
Packet loss in Guest OS using VMXNET3: When using the VMXNET3 driver, you may see significant packet loss during periods of very high traffic bursts. The VM may even freeze entirely. This issue occurs when packets are dropped during high traffic bursts. This can occur due to a lack of receive and transmit buffer space or when receive traffic which is speed constrained.
Consumption Metrics
There are 2 main metrics to measure utilization: throughput and packets.
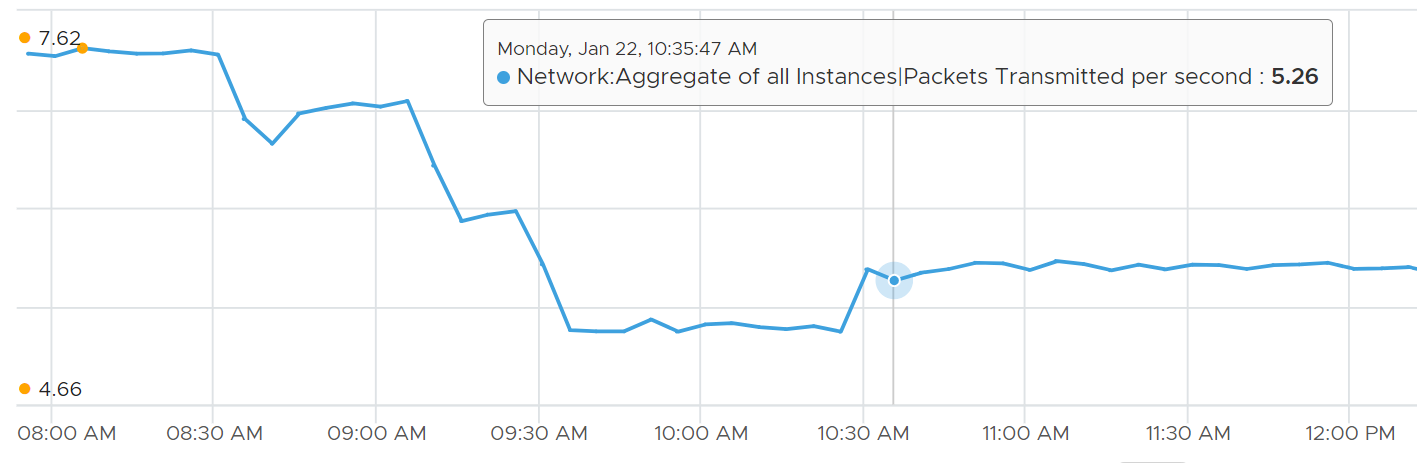
Both metrics matter as you may still have bandwidth but unable to process that many packets per second. This outage shows 700K packets per second that only consumes 800 Mbps as the packet is small. The broadcast packet is only 60 bytes long, instead of the usual 1500 bytes.
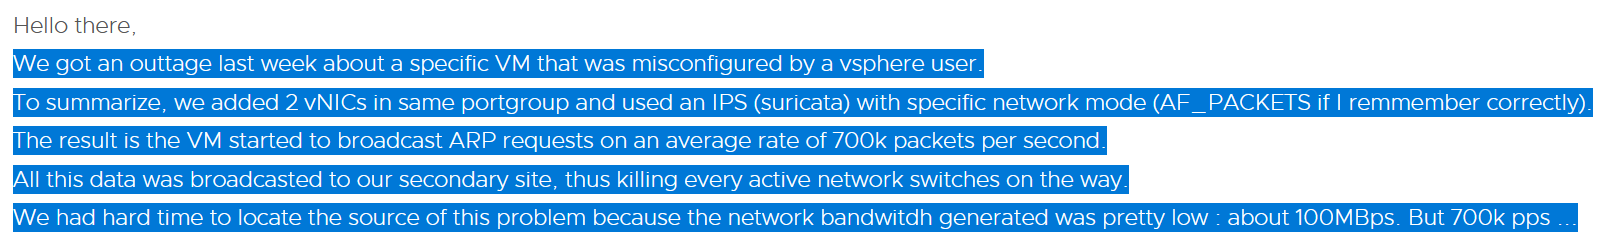
The packets transmitted does not include those dropped packets. Another word, it only counts packets that were successfully transmitted.
The following diagram proves the above relationship.
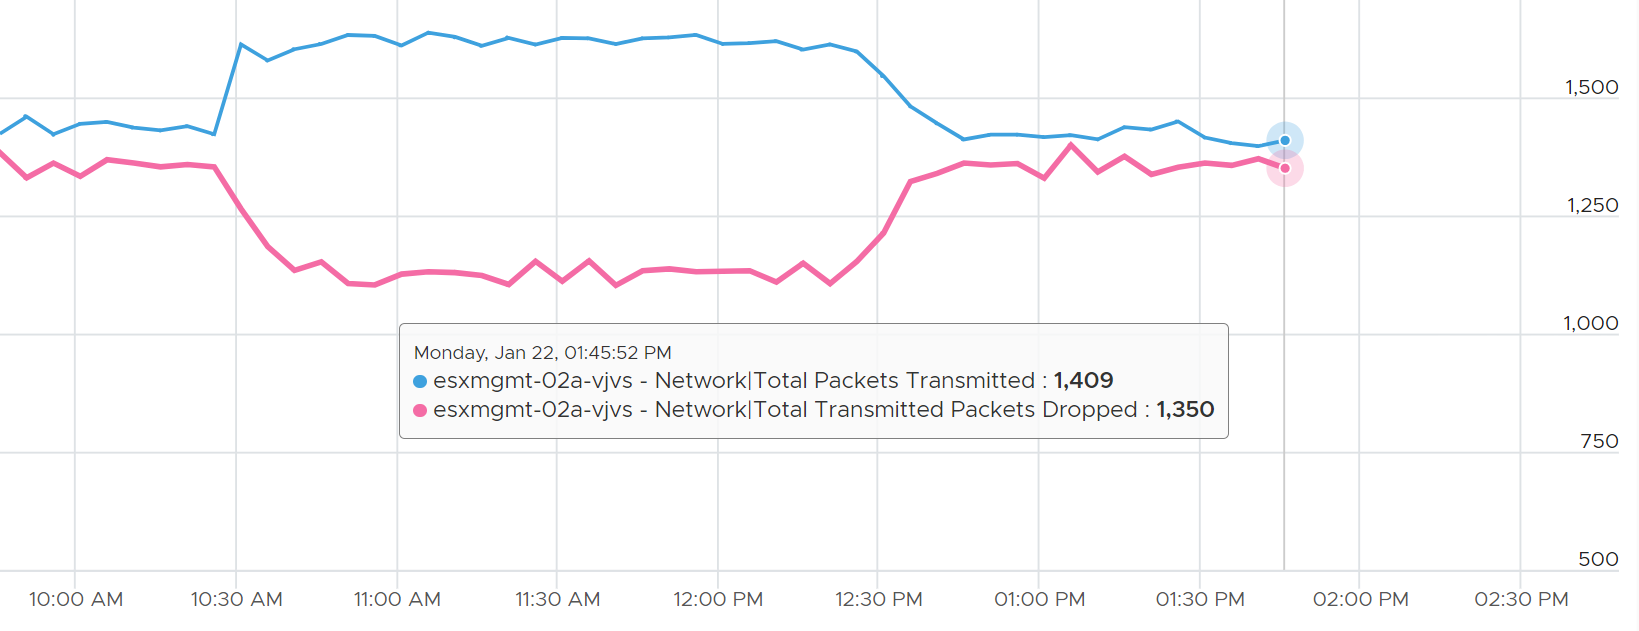
As a consequence, the packets transmitted per second = Total Packets Transmitted / 300 seconds.
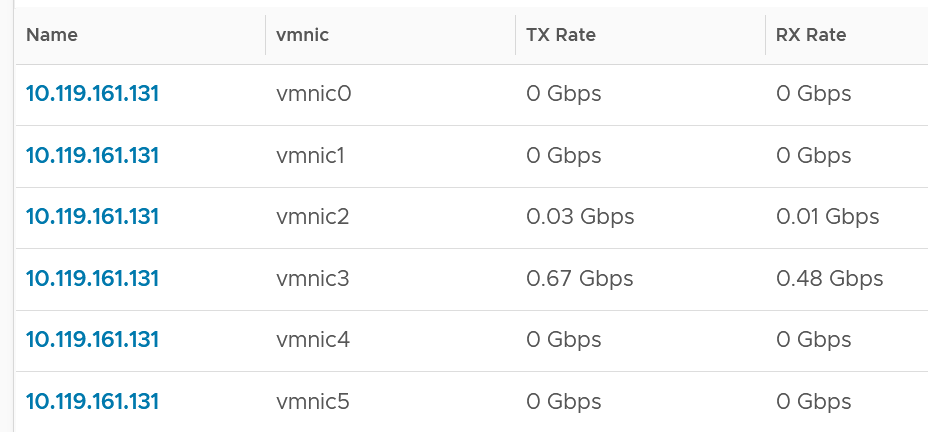
ESXi
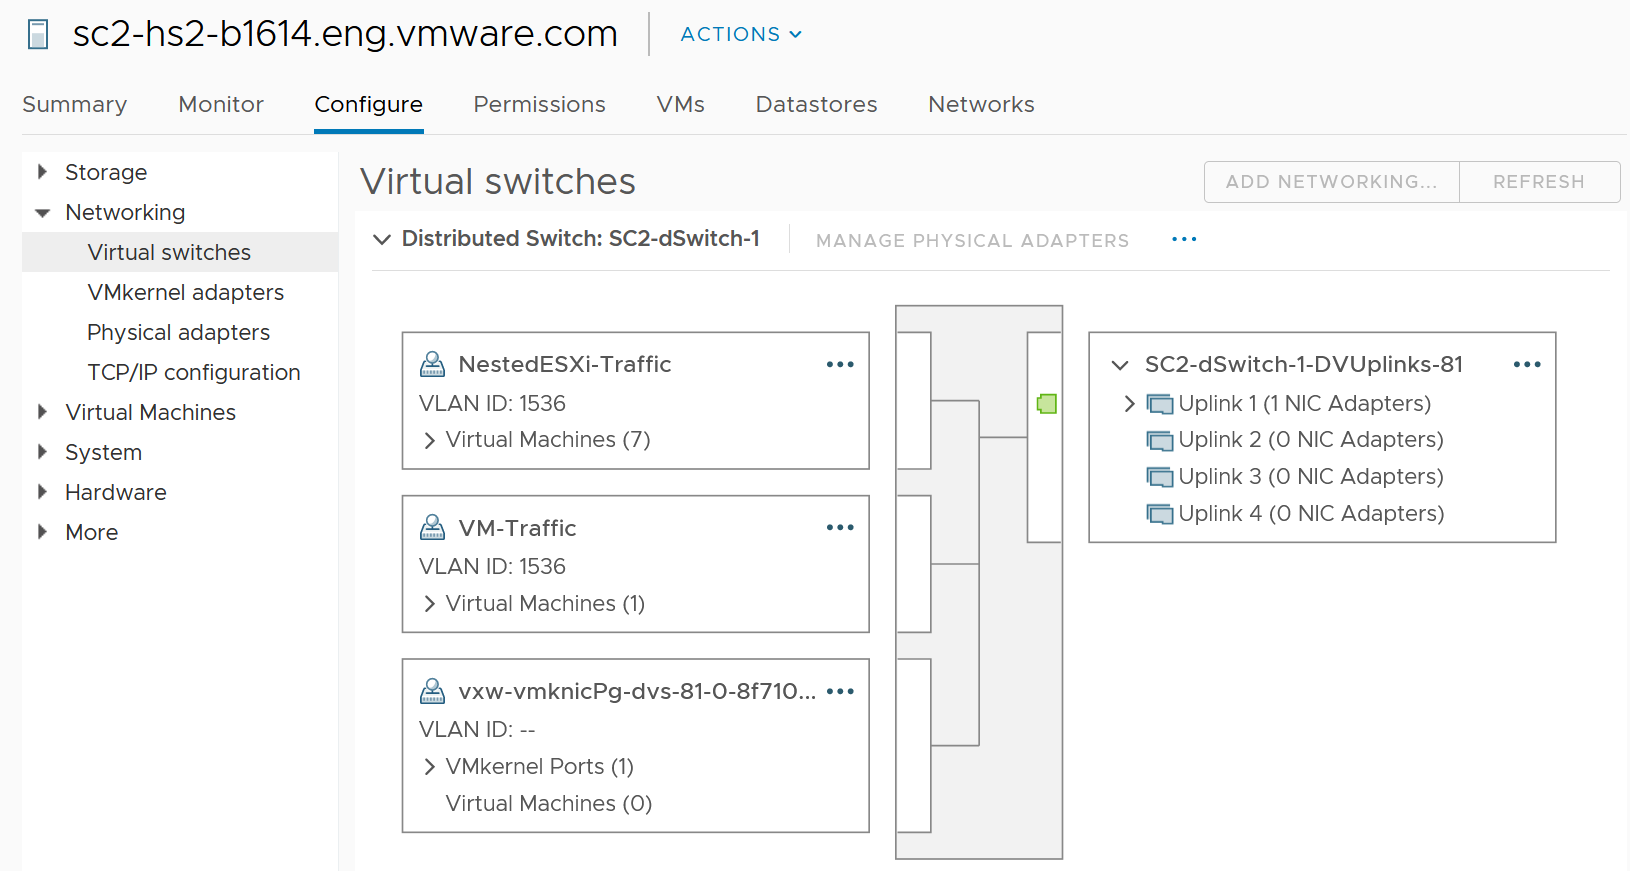
In vSphere Client, you can’t see the virtual network traffic. The following shows that you can only see the physical network card.
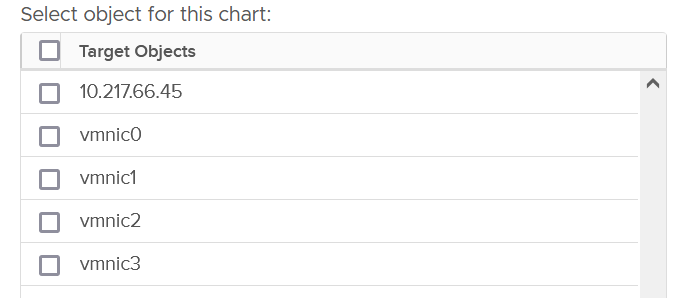
The metrics are provided at both physical NIC card and ESXi level. The counter at host level is basically the sum of all the vmnic instances. There could be small variance, which should be negligible.
Just like vCenter, VCF Operations also does not provide the metrics at the Standard Switch and its port groups. This means you cannot aggregate or analyze the data from these network objects point of view. You need to look at the parent ESXi one by one. Create a dashboard with interaction to cycle through the ESXi hosts.
Contention Metrics
In addition to the dropped packet, there are 2 other metrics tracking contention. They are error packets and unknown protocol frames.
Error Metrics
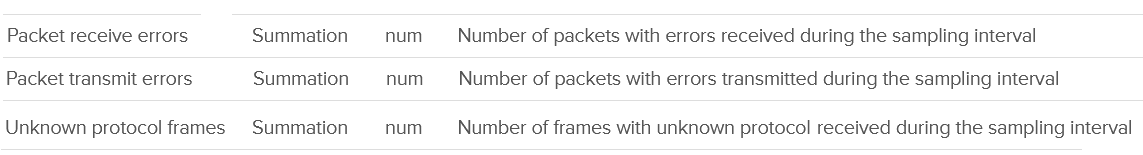
A packet is considered unknown if ESXi is unable to decode it and hence does not know what type of packet it is. You need to enable this metric in VCF Operations as it’s disabled by default.
Expect these error packets, unknown packets and dropped packets to be 0 at all times. The following shows from a single ESX:
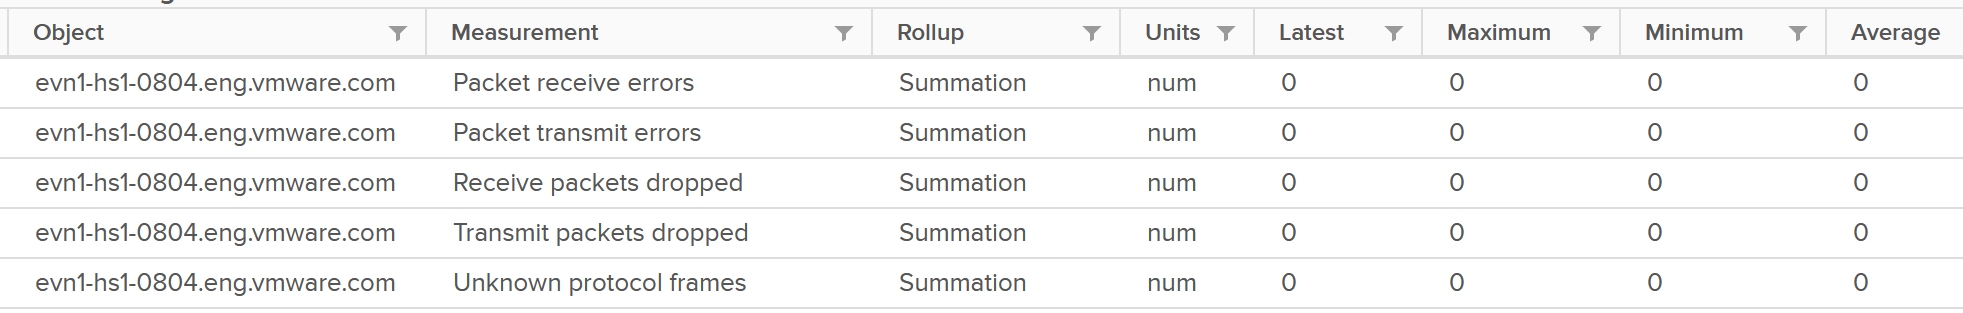
To see from all your ESXi, use the view “vSphere \ ESXi Bad Network Packets”.
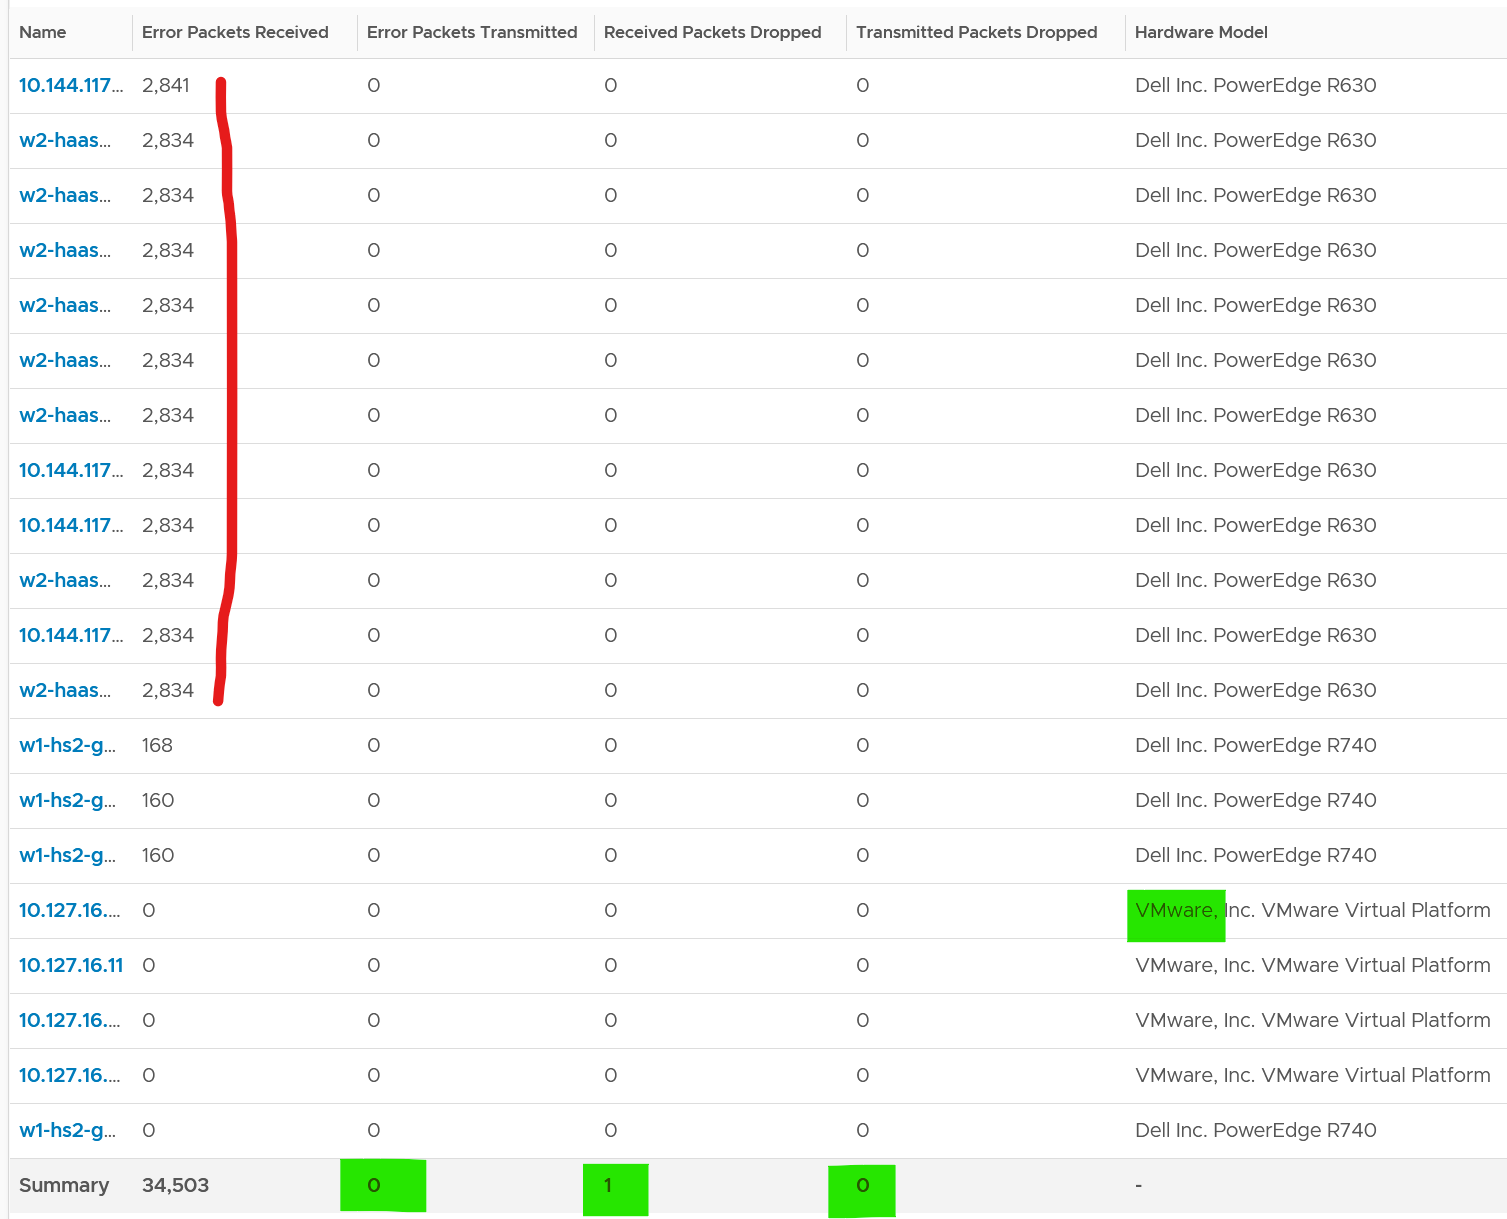
The hosts with error RX spans across different clusters, different hardware models and different ESXi build number. I can’t check if they belong to the same network.
If you see a value, drill down to see if there is any correlation with other types of packets. In the following example, I do not see any correlation.
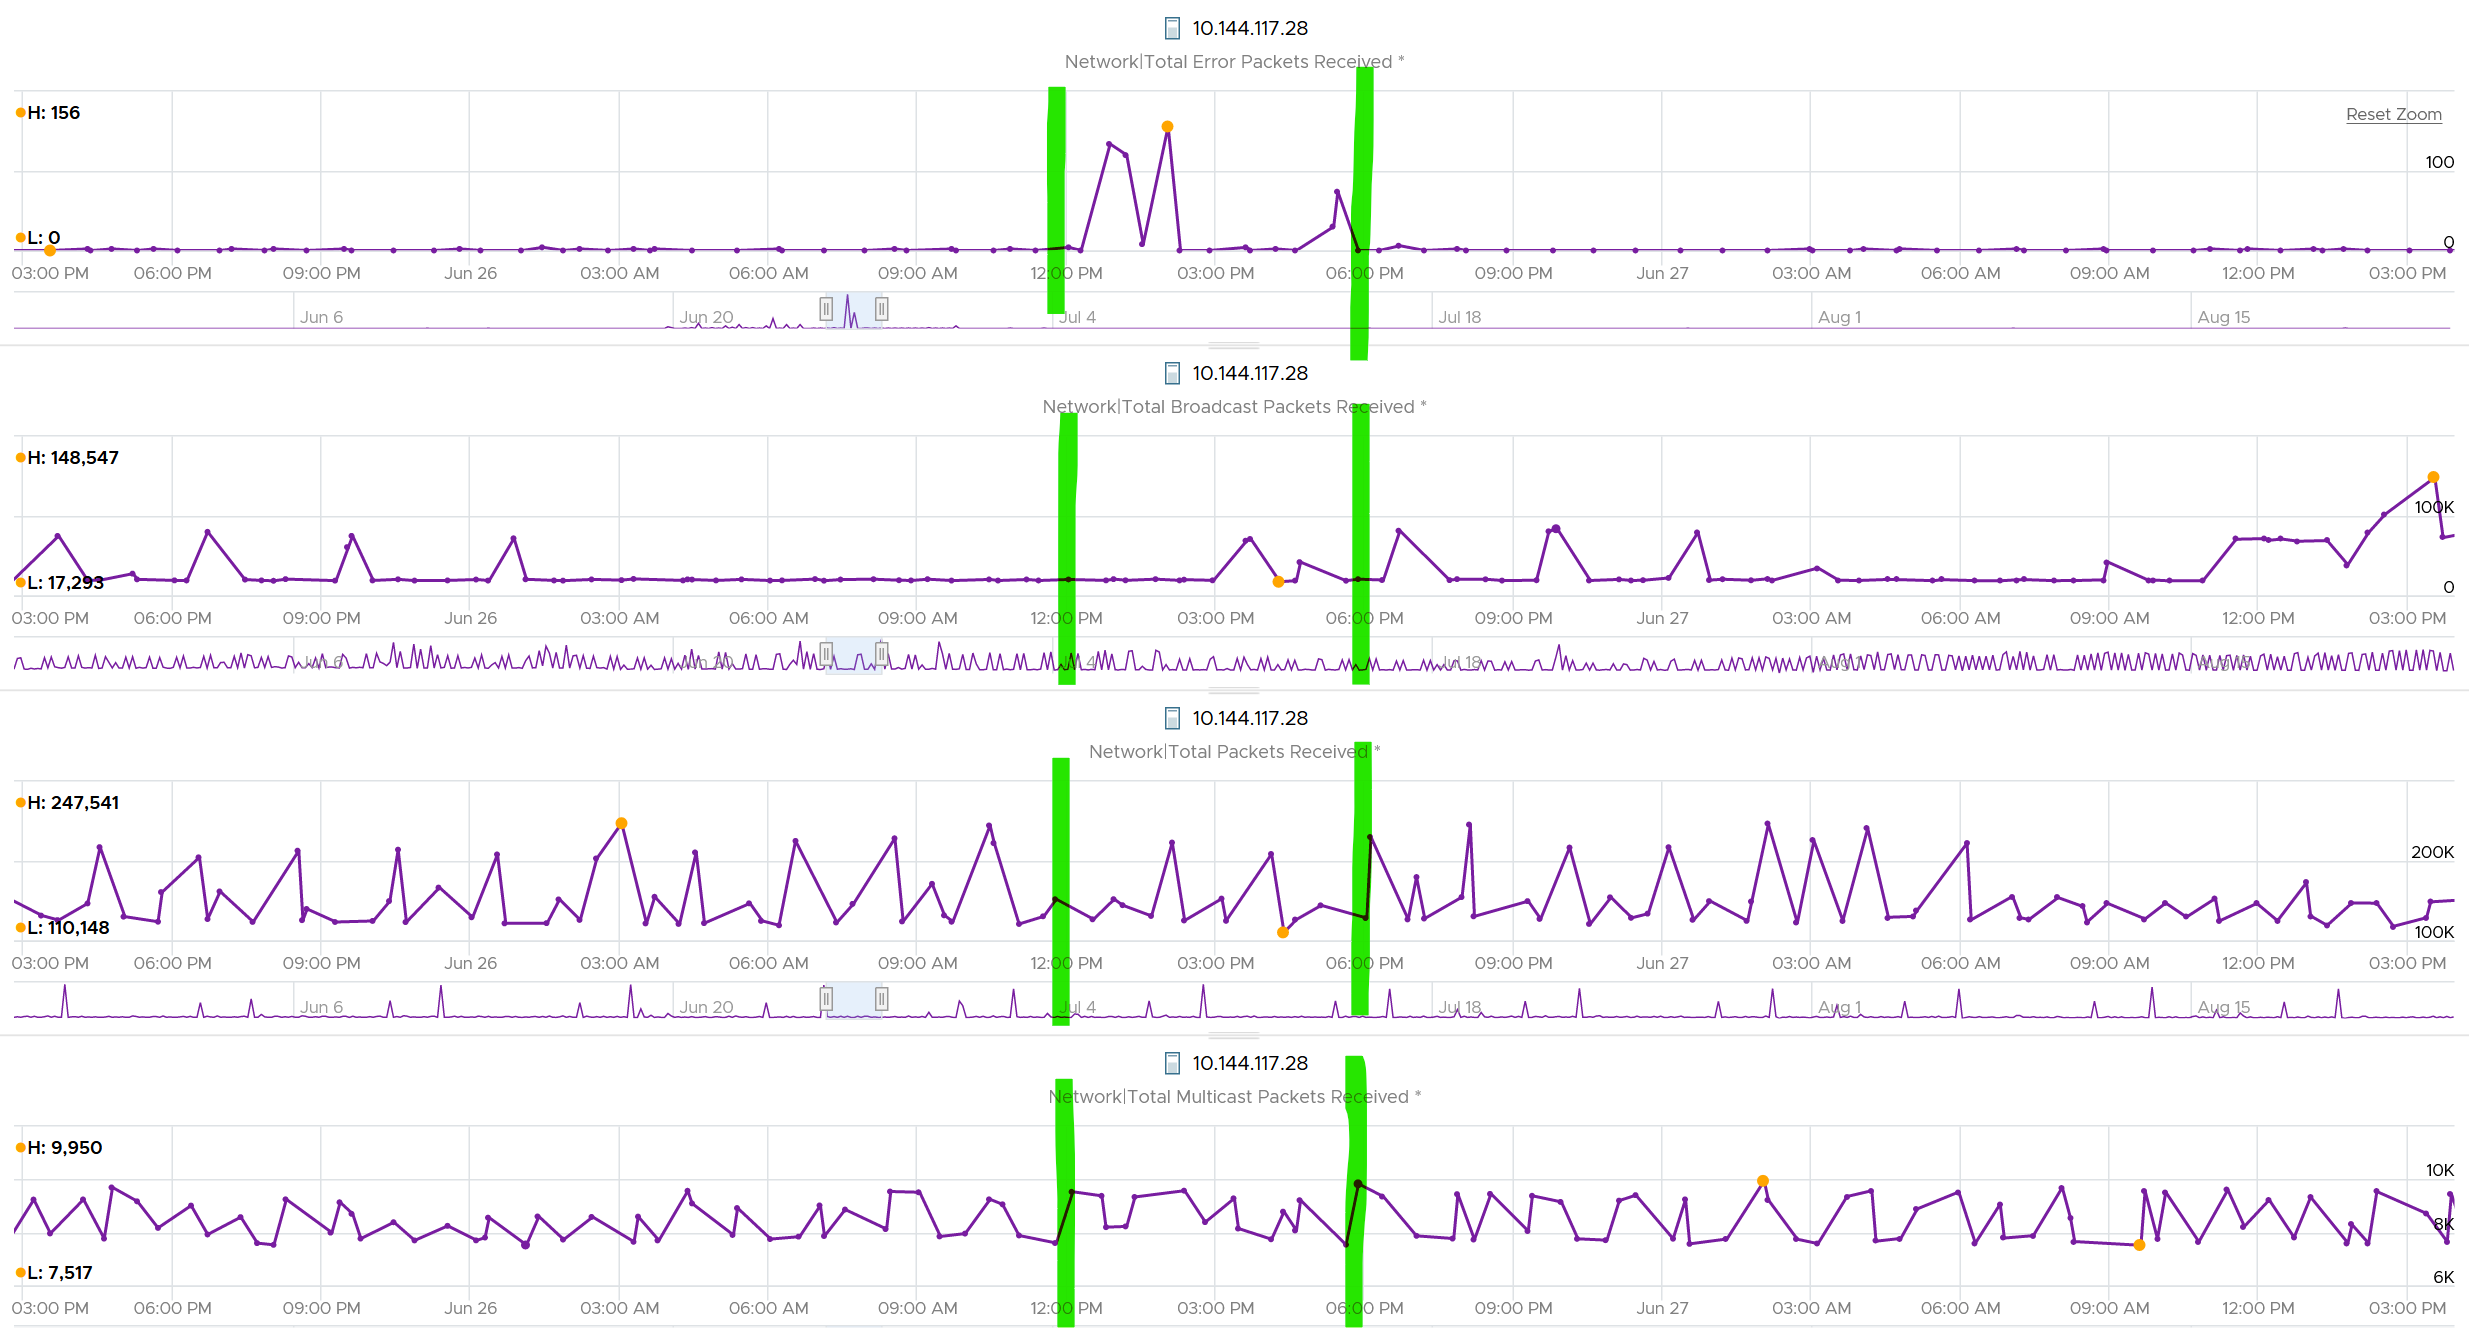
What I see though, is a lot of irregular collection. I marked with red dots some of the data collection.
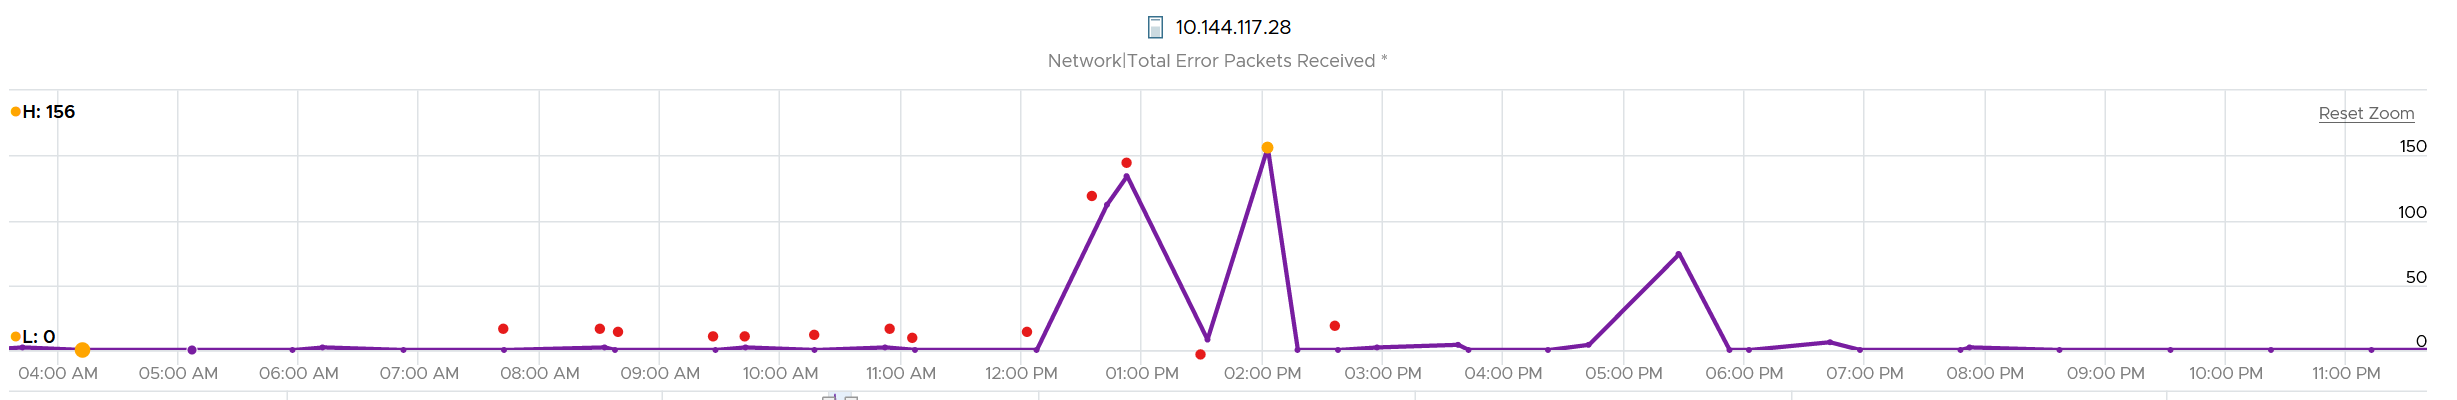
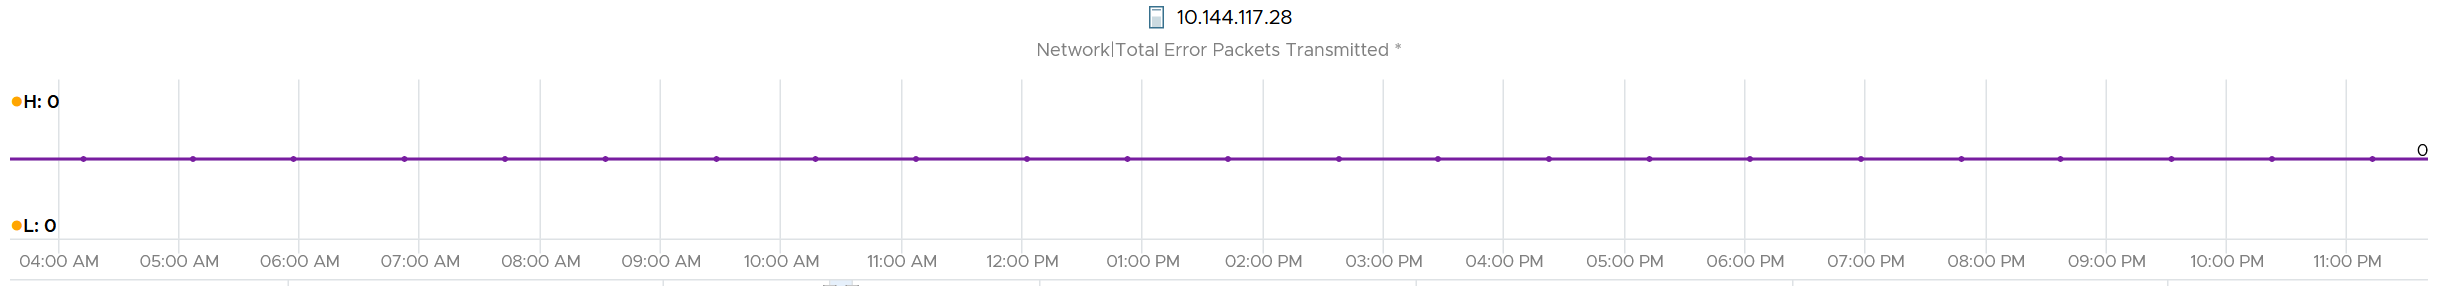
You can see they are irregular. Compare it with the Error Packet Transmit counter, which shows a regular collection.
esxcli
The metrics at vCenter UI only shows the total. If you want to see the details, go to ESXi host console and issue an esxcli command.
The syntax is:
$ watch esxcli network nic stats get -n vmnic#
Take note:
- The counter is accumulative. That means the issue could have happened in the past.
See this KB for details. I’d copy the summary for convenience.
The error counters are:
Total receive errors Total transmit errors | I think these 2 are what you see in the vCenter UI. It’s the summation of all the error below, including checksum error (which is not reported separately). |
Based on this KB article, the csumerr counter, available inside the driver’s private statistics, cover the following:
| |
| Receive length errors | The actual size of the packet does not match with the size of the packet being reported via the packet header |
| Receive over errors | Count the packets that are discarded by the hardware buffer of the card. This includes CRC error. |
| Receive CRC errors | The CRC value calculated by receiving ESXi does not match the value in the FCS field. If you’re unfamiliar with CRC, see this. |
| Receive frame errors | |
| Receive FIFO errors Transmit FIFO errors | The physical network card unable to process due to RX ring buffe size is full |
| Receive missed errors | The physical network card unable to store or process packets due to hardware limitations |
| Transmit aborted errors | |
| Transmit carrier errors | |
| Transmit heartbeat errors | |
| Transmit window errors |
Dropped Packet
You’ve seen the dropped packet situation at VM. That’s a virtual layer, above the ESXi. What do you expect to see at ESXi layer, as it’s physically cabled to the physical top of rack switches? The counter tracks packets that are dropped prior to the packet reaching the ESXi kernel. According to this KB, “quite often this counter is a combination of the values from other counters that can be found in the Private Statistics section of the nicinfo.sh.txt file that is contained in the commands directory of ESXi host log bundles.”
I plotted 319 production ESXi hosts, and here is what I got for Transmit. What do you think?
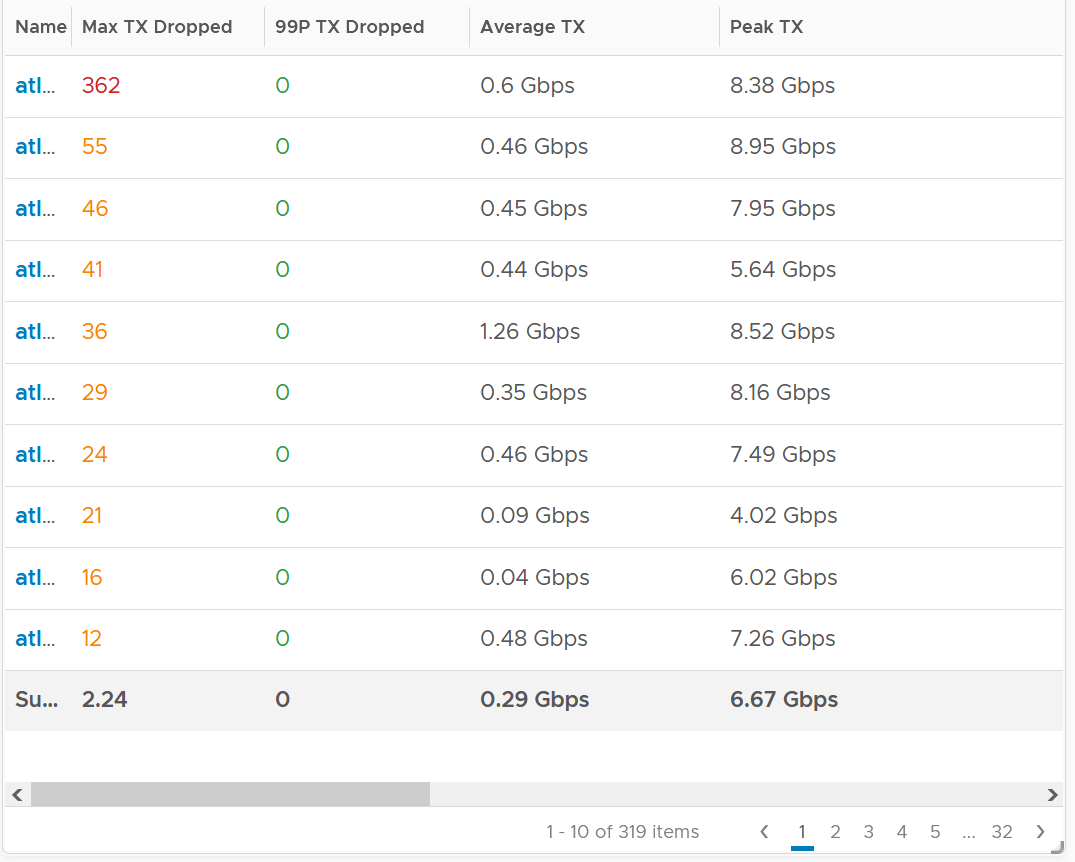
There are packet drops, although they are very minimal. Among 319 hosts, one has 362 dropped transmit packet in the last 3 months. That host was doing 0.6 Gbps on average and peaked at 8.38 Gbps.
As expected, the dropped packet rarely happened. At 99th percentile, the value is perfectly 0.
I tested with another set of ESXi hosts. Out of 123 servers, none of them has any dropped TX packet in the last 6 months. That’s in line with my expectation. However, a few of them experienced rather high dropped RX packets.
The dropped only happened since the ESXi had an increased load
If you see something like this, you should investigate which physical NIC card is dropping packet, and which VMK interface is experiencing it.
While the number is very low, many hosts have packet drops, so my take is I should discuss with network team as I expect data center network should be free of dropped packets.
Received
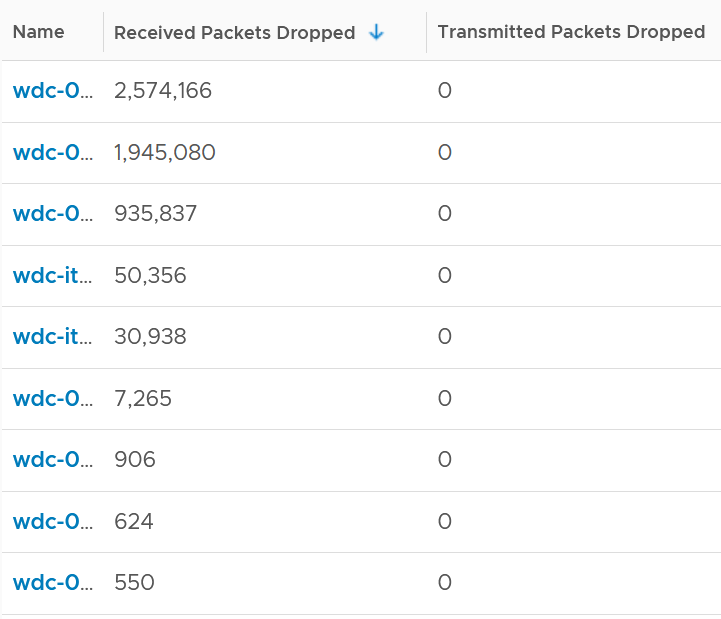
What do you think you will see for Received?
Remember how VM RX is much worse than VM TX? Here is what I got:
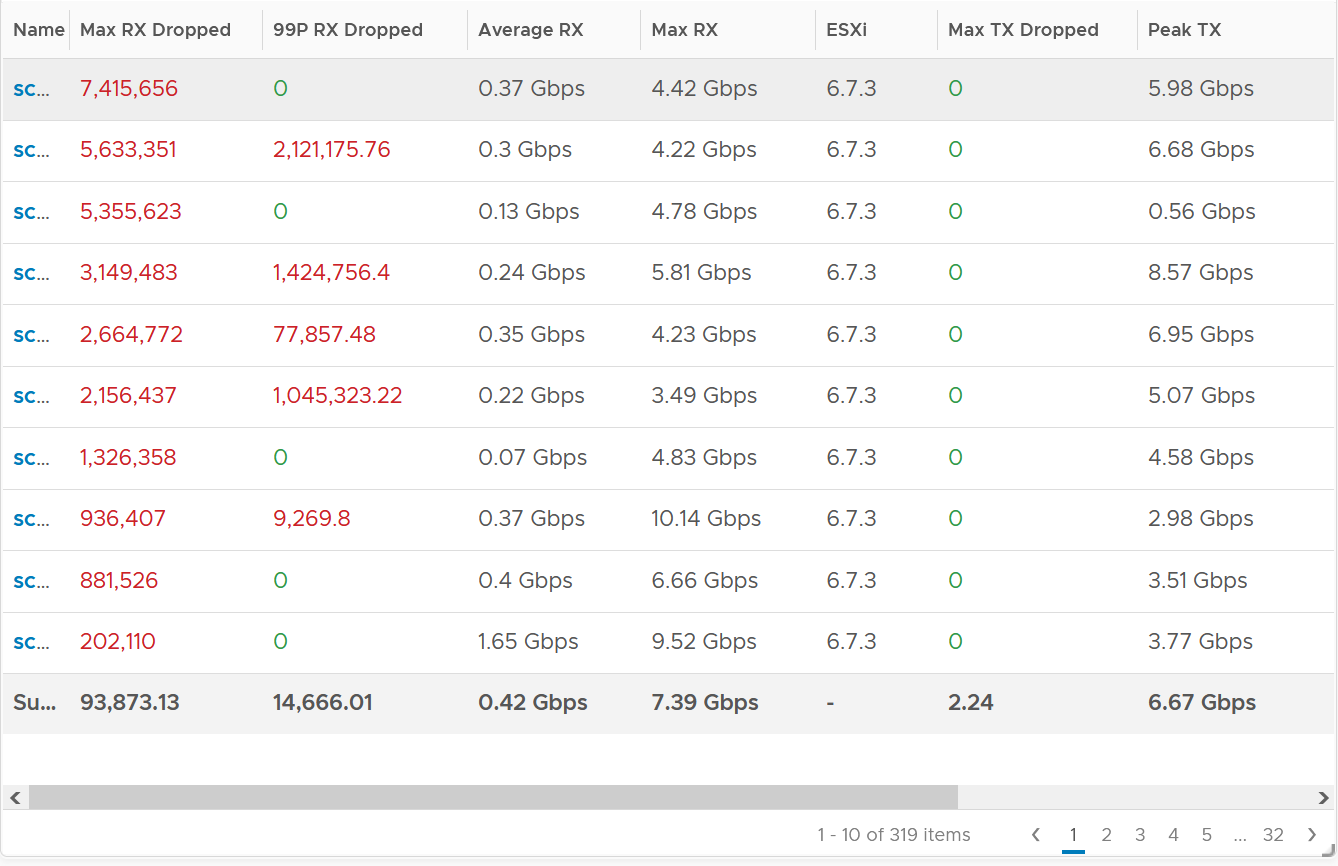
Surprisingly, the situation is the same for ESXi.
Some of them have >1 million packet dropped in 5 minute. Within these set of ESXi, some have regular packet dropped, as the value at 99th percentile is still very high. Notice none of the ESXi is dropping any TX packet.
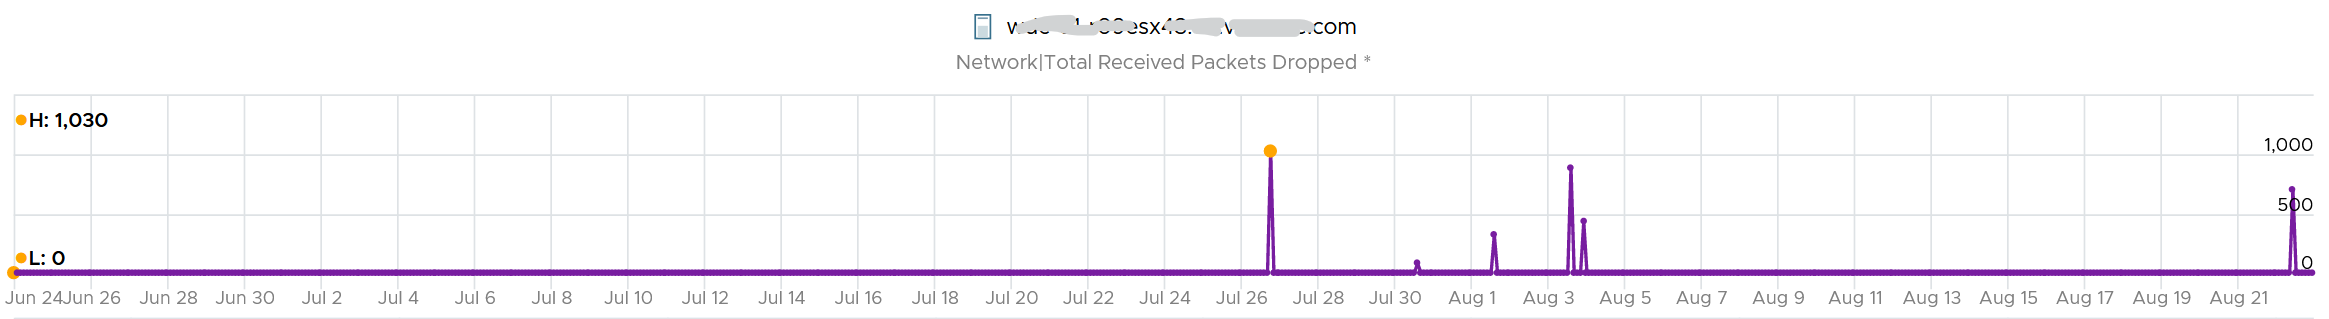
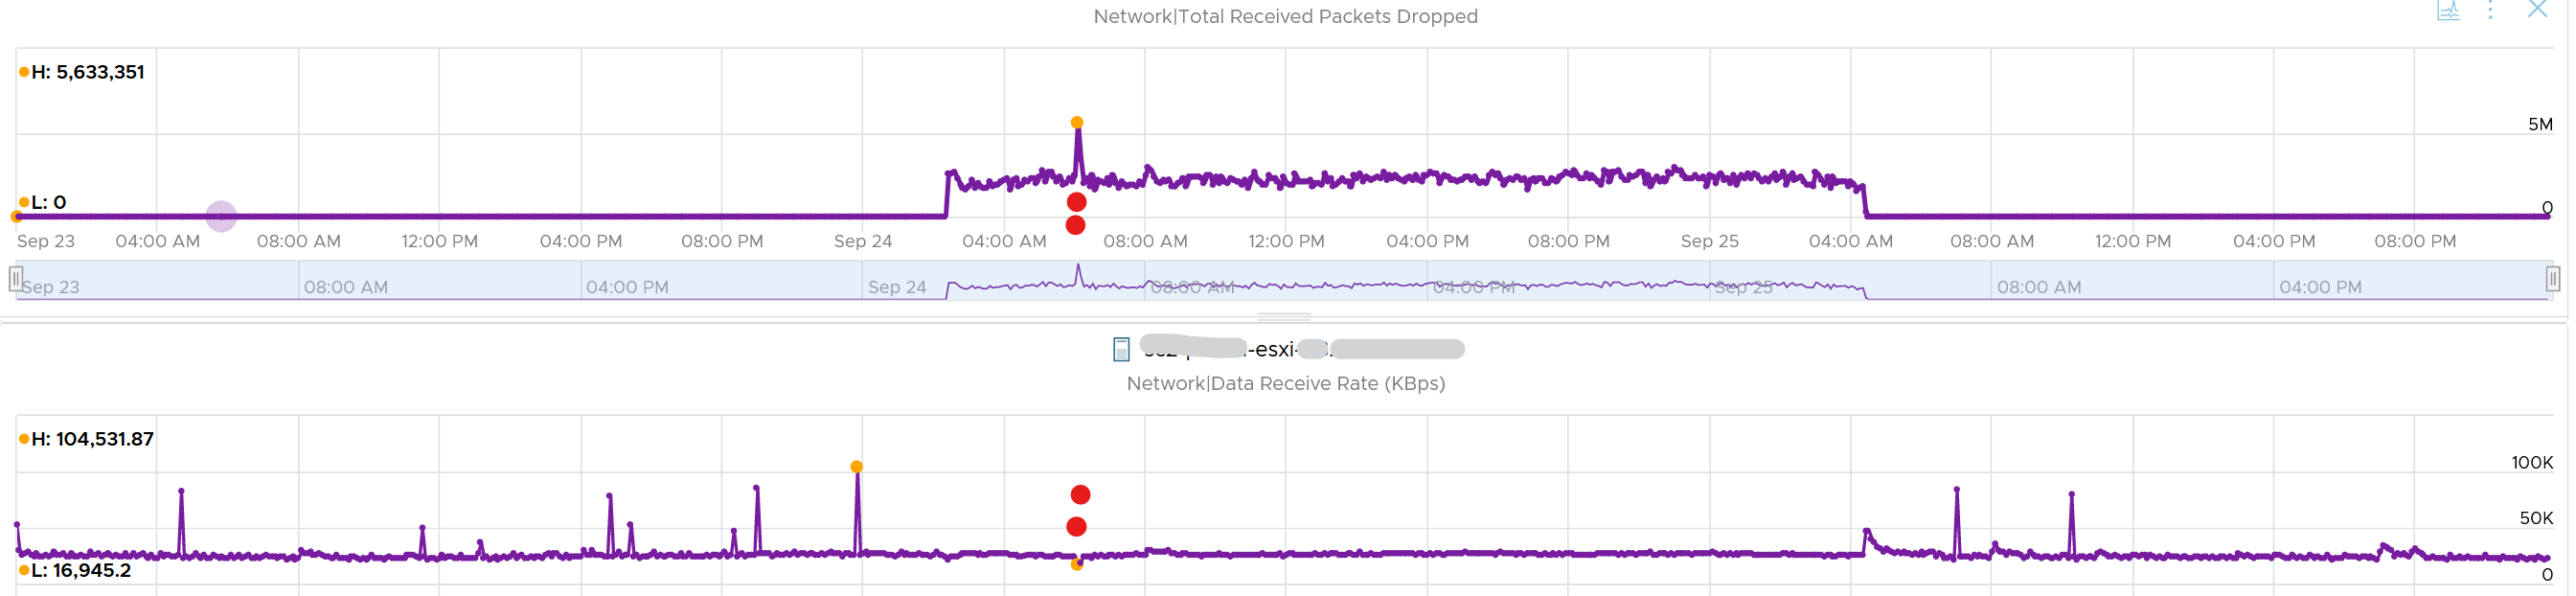
I plotted the 2nd ESXi from the table, as it has high value at 99th percentile. As expected, it has sustained packet dropped lasting 24 hours. I marked the highest packet drop time, as it mapped to the lowest packets received.
vsish
vsish provides more information that is not available in vSphere Client UI and VCF Operations.
vsish -e get /net/portsets/DvsPortset-0/ports/67109026/clientStats
port client stats {
pktsTxOK:154121
bytesTxOK:63326625
droppedTx:0
pktsTsoTxOK:0
bytesTsoTxOK:0
droppedTsoTx:0
pktsSwTsoTx:0
droppedSwTsoTx:0
pktsZerocopyTxOK:45817
droppedTxExceedMTU:0
pktsRxOK:339700
bytesRxOK:257901191
droppedRx:2620 🡨 the reason will appear on the next output below
pktsSwTsoRx:0
droppedSwTsoRx:0
actions:0
uplinkRxPkts:0
clonedRxPkts:0
pksBilled:0
droppedRxDueToPageAbsent:0
droppedTxDueToPageAbsent:0
}
We saw dropped packets, so we probe deeper for the reason
vsish -e get /net/portsets/DvsPortset-0/ports/67109026/vmxnet3/rxSummary
stats of a vmxnet3 vNIC rx queue {
LRO pkts rx ok:0
LRO bytes rx ok:0
pkts rx ok:340093
bytes rx ok:257984247
unicast pkts rx ok:253678
unicast bytes rx ok:245663220
multicast pkts rx ok:42220
multicast bytes rx ok:7497292
broadcast pkts rx ok:44195
broadcast bytes rx ok:4823735
running out of buffers:2620 🡨 the reason for 2620 packets dropped
pkts receive error:0
1st ring size:512
2nd ring size:512 🡨 the ring size is on the small side. I’d say set to 2K.
# of times the 1st ring is full:354 🡨 this line shows the first ring is full 354x
# of times the 2nd ring is full:0
fail to map a rx buffer:0 🡨 other reasons look good
request to page in a buffer:0
# of times rx queue is stopped:0 🡨 other reasons look good
failed when copying into the guest buffer:0 🡨 other reasons look good
# of pkts dropped due to large hdrs:0
# of pkts dropped due to max number of SG limits:0
pkts rx via data ring ok:0
bytes rx via data ring ok:0
Whether rx burst queuing is enabled:0
current backend burst queue length:0
maximum backend burst queue length so far:0
aggregate number of times packets are requeued:0
aggregate number of times packets are dropped by PktAgingList:0
# of pkts dropped due to large inner (encap) hdrs:0
number of times packets are dropped by burst queue:0
number of times packets are dropped by rx try lock queueing:0
number of packets delivered by burst queue:0
number of packets dropped by packet steering:0
number of memory region lookup pass in Rx.:0
number of packets dropped due to pkt length exceeds vNic mtu:0
number of packets dropped due to pkt truncation:0
}
Networking VMs, such as firewall and routers, or any high VMs expecting high packet rates, check if the VM is requesting NetQ RSS.
Consumption Metrics
As expected, you get the 2 types of throughput:
-
bits/second
-
packets/second.
For bits/second, the metrics are:
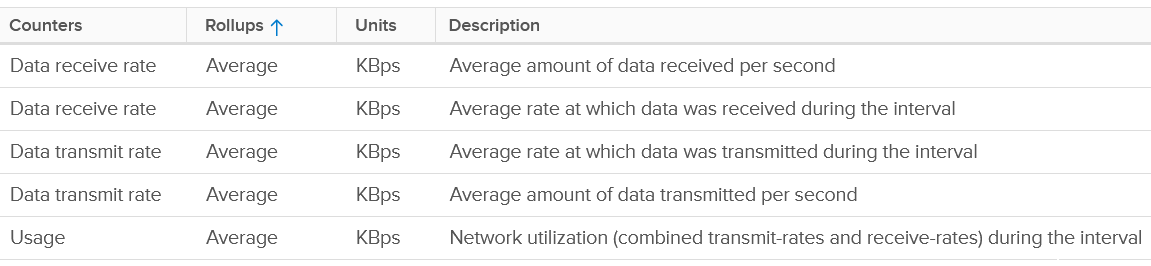
I’m unsure why there are duplicates metrics.
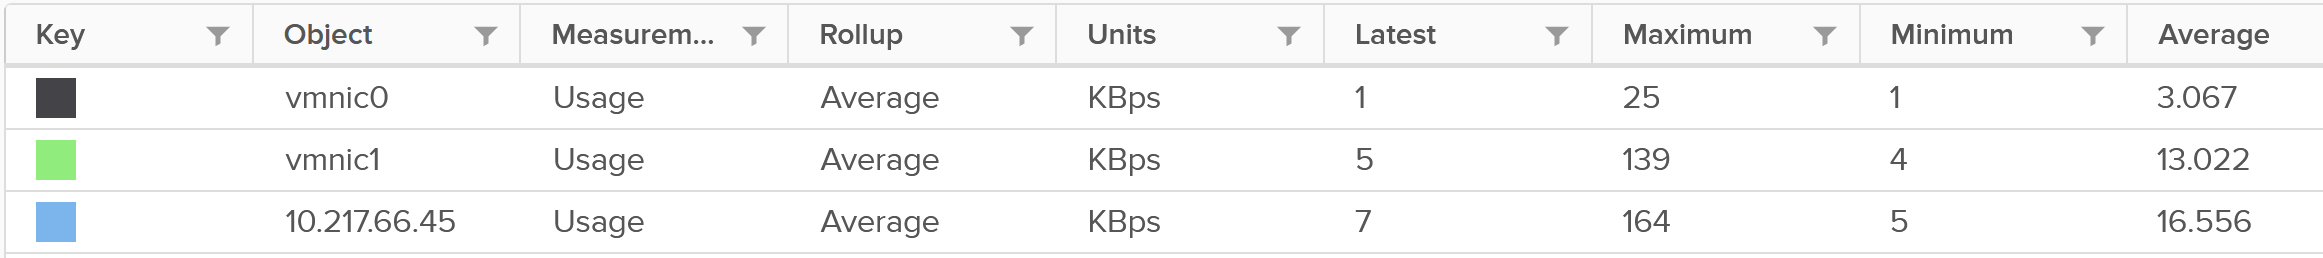
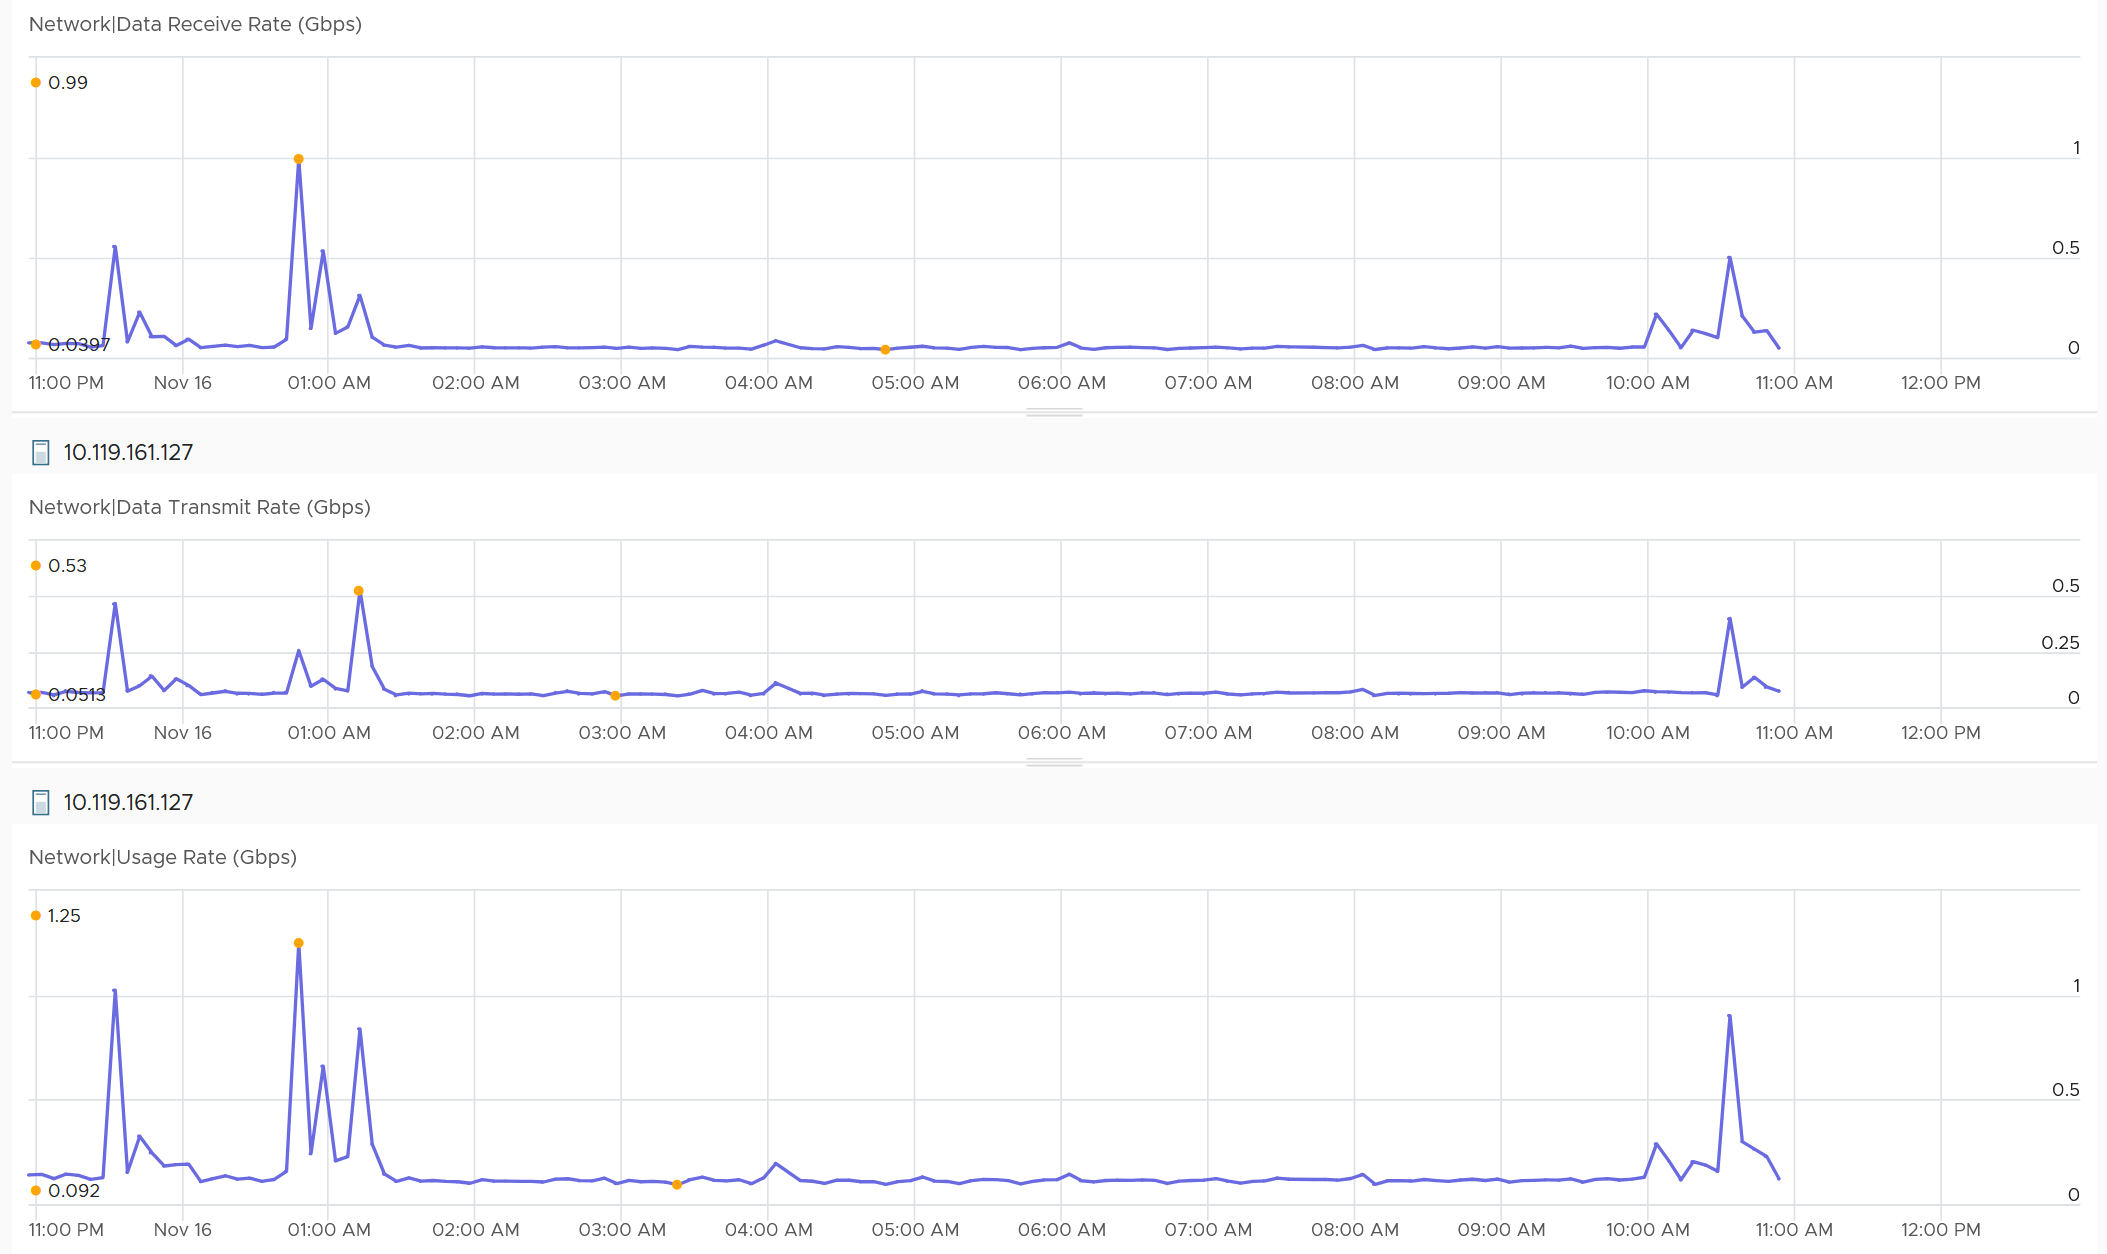
We covered earlier that full duplex means the aggregated metric can exceed the physical speed. Notice the Usage Rate is the sum of Receive and Transmit on the following screenshot.
You can also plot each vmnic one by one. Since you may not know which one to plot for a given ESXi, you can show them all in table first.
For packets/second, the metrics are:
It’s interesting to divide the packet/second with the bits/second, as you get the packet size. If this number change drastically in large environment, it’s something worth investigating.
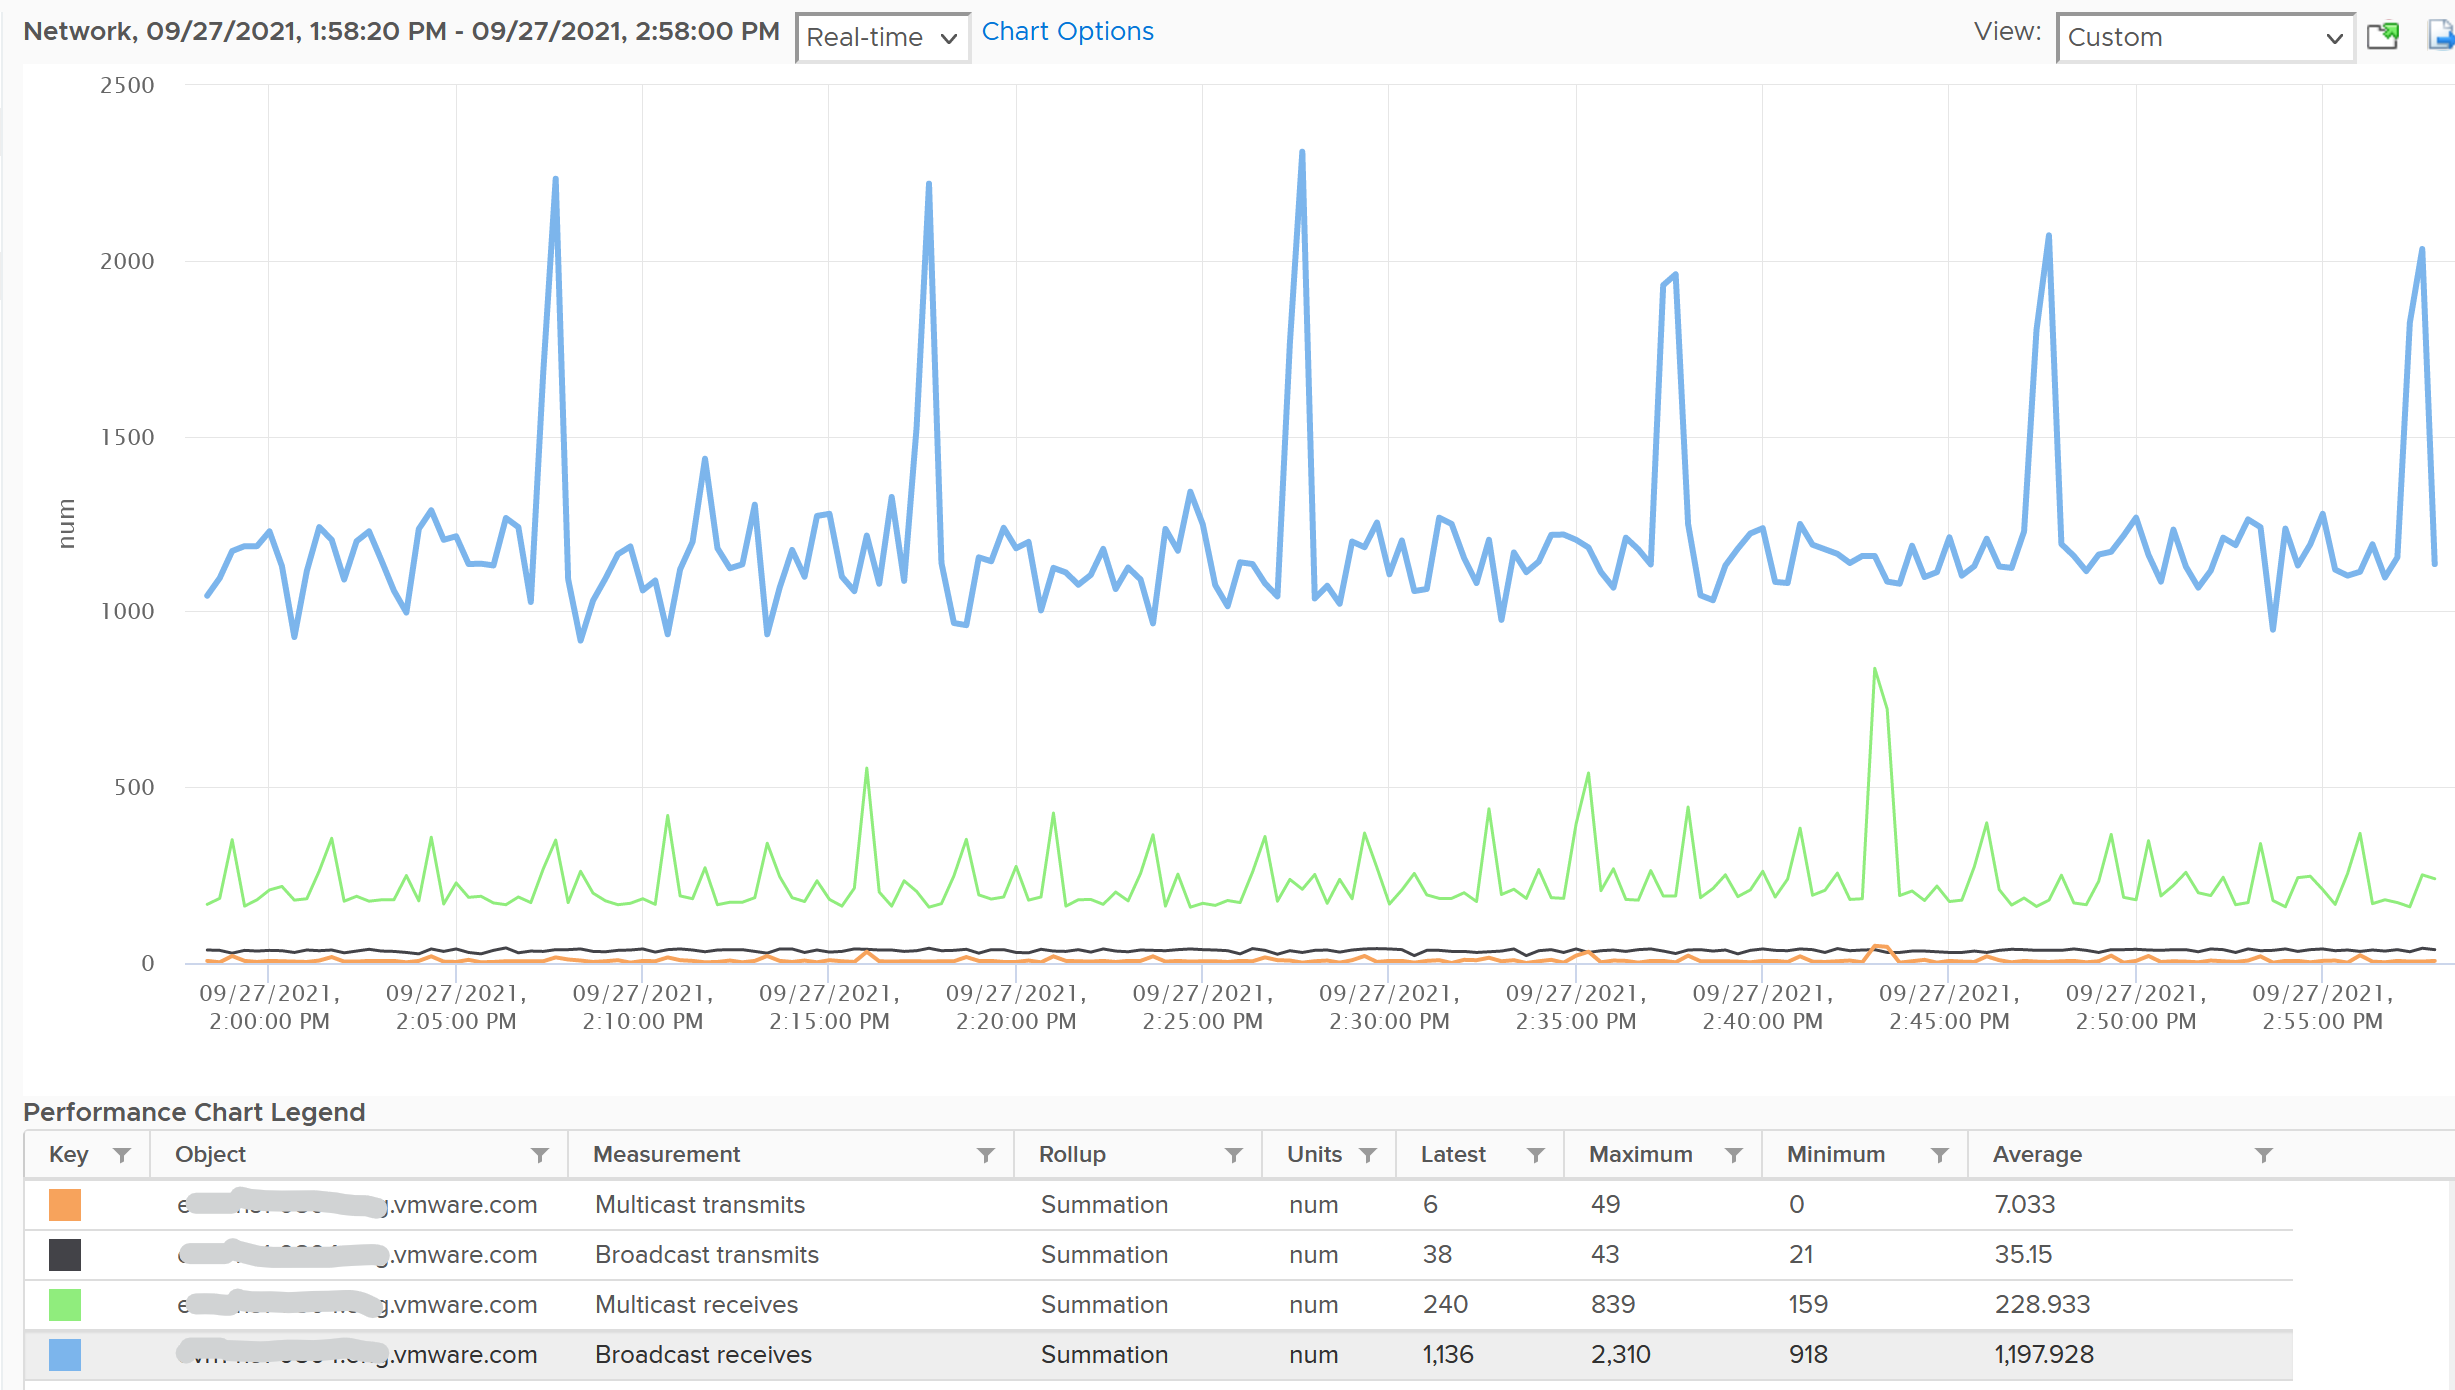
Unusual Packets
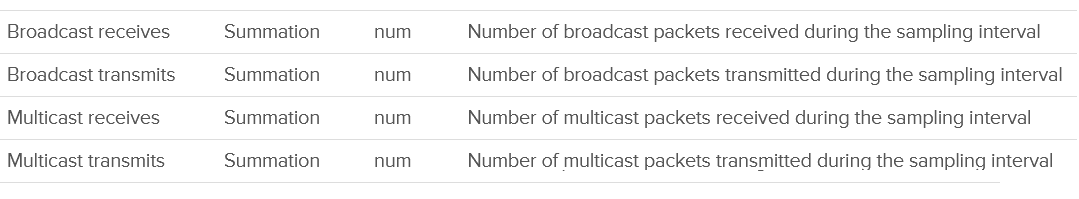
Your VM network should be mostly unicast traffic. So check that broadcast and multicast are within your expectation. Your ESXi Hosts should also have minimal broadcast and multicast packets.
Chapter 6