MS Windows
Introduction
There are 3 tools in Windows:
-
Performance Monitor. This is the oldest one, and is superceded by the next two.
-
Task Manager
-
Resource Monitor
They use different names. It is also possible that they use different formula.
One major difference between Guest OS and VM is that Windows/Linux runs a lot of threads and processes. The problem is there is minimal observability on individual thread or process. For example, there is no CPU queue metric, memory page fault, network dropped packet, and disk latency at process level.
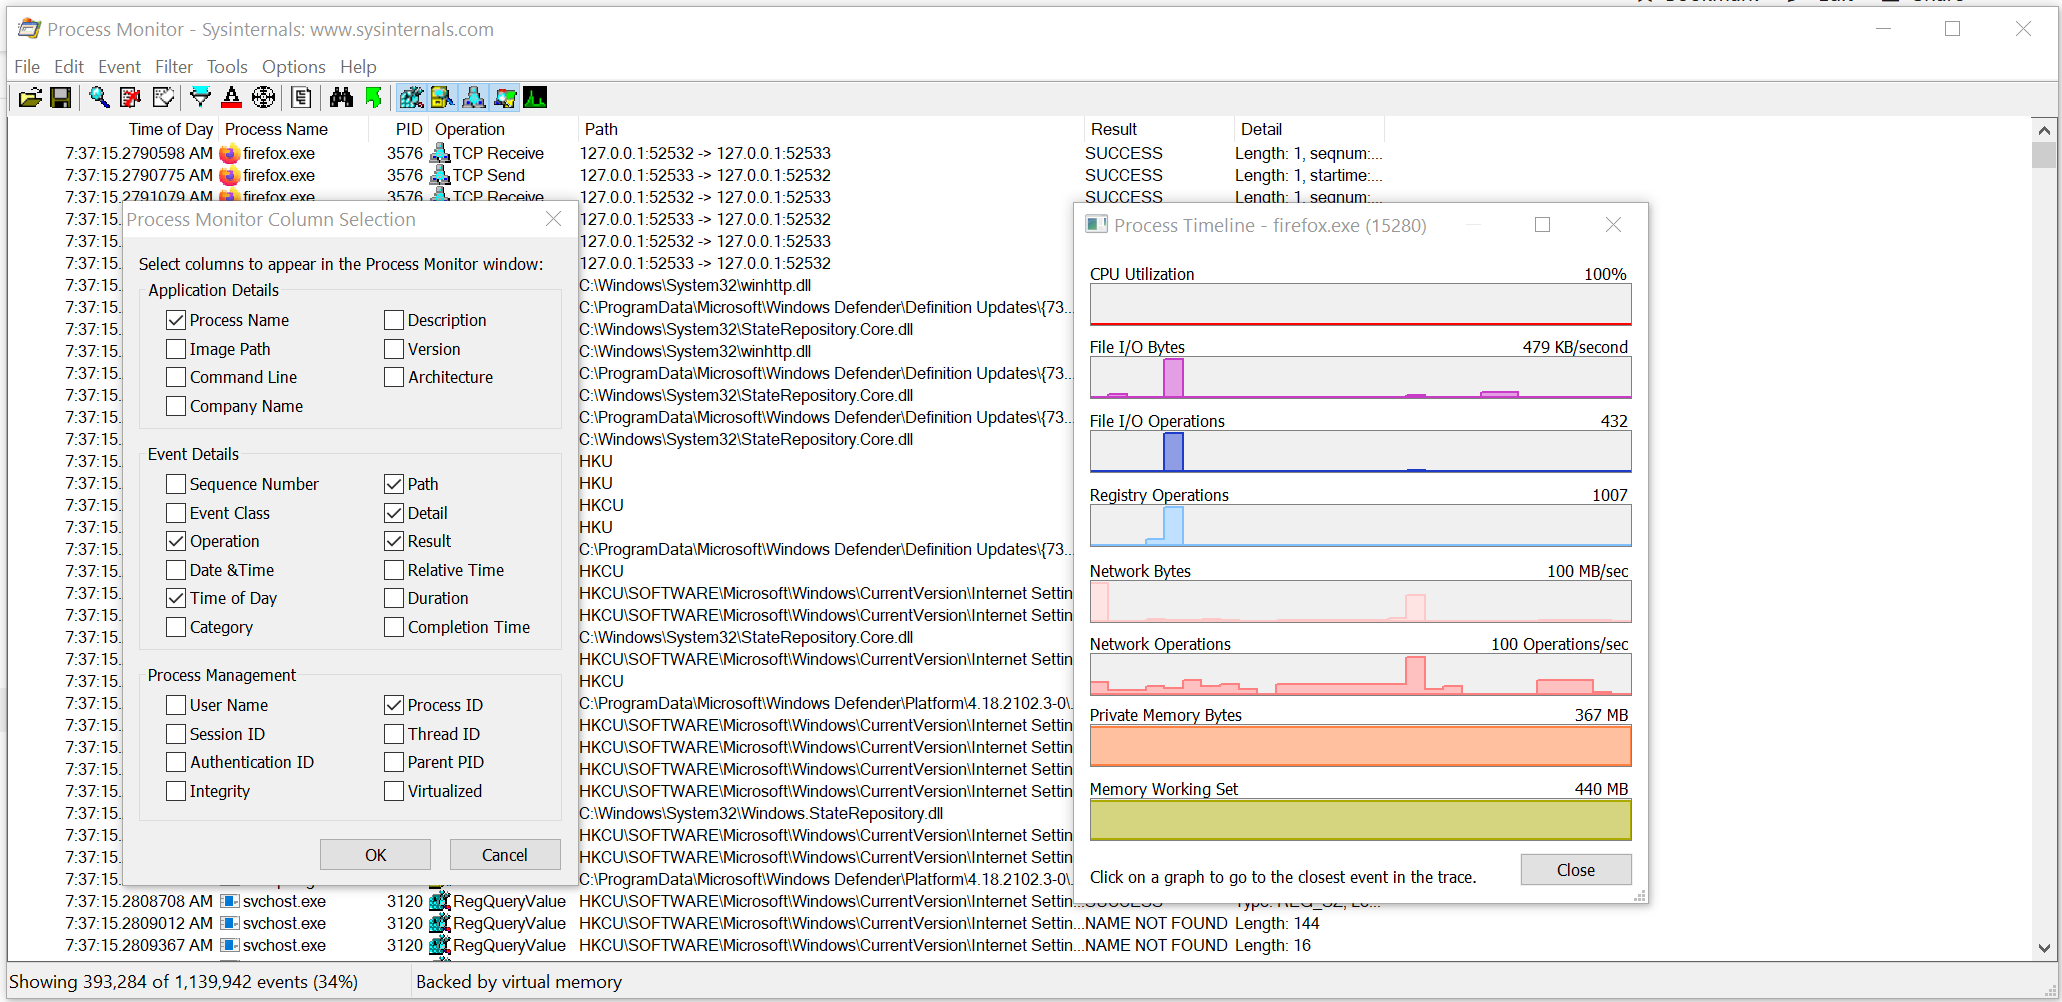
The following shows Windows Sysinternal[^22], a great tool for Windows troubleshooting. As you can see, they are just utilization metrics. There is no contention metric.
CPU
Performance Monitor is still the main tool for Microsoft Windows, despite the fact it has not been enhanced for decades. Go to docs.microsoft.com and browse for Windows Server. It took me to this article, which cover PerfMon. Many explanations on metrics at https://learn.microsoft.com/ are still based on end-of-life Windows.
PerfMon groups the counters under Processor group. However, it places the Processor Queue Length and Context Switches metrics under the System group. The System group covers system wide metrics, not just CPU.
The following screenshot shows the counters under Processor group.
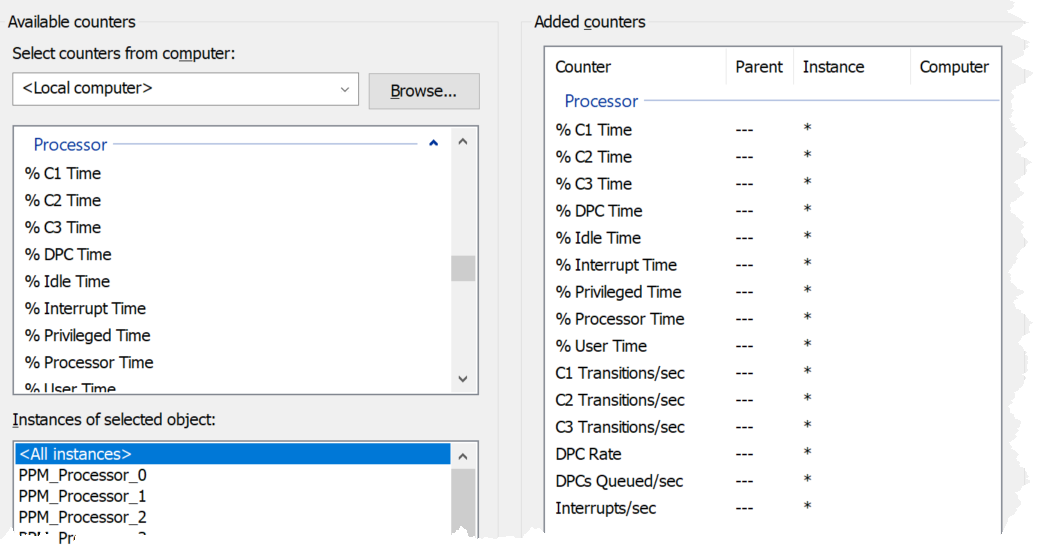
PerfMon UI provides a description, which I use as a reference below:
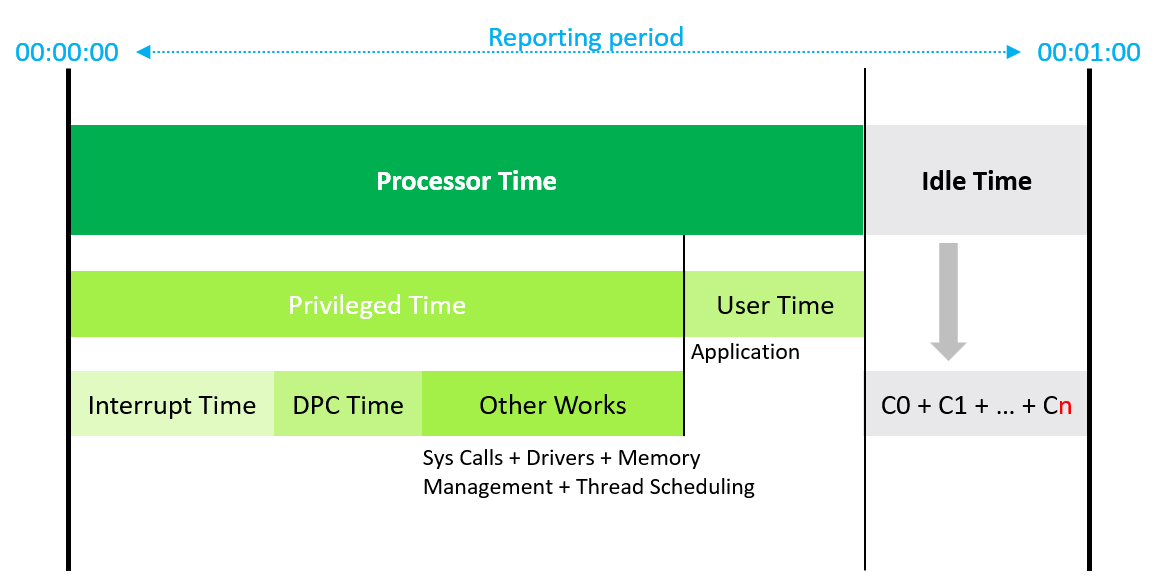
% C1 Time % C2 Time % C3 Time | Based on this April 2004 article, Windows can operate in 4 different power levels. The C0 is the highest, while C3 consumes the least amount of power. C1 + C2 + C3 may not add to Idle Time. If you set dynamic power management, expect the lower power to be registering higher value during idle period. Reference: here. |
|---|---|
C1 Transitions/sec C2 Transitions/sec C3 Transitions/sec | The amount of time on each power level does not tell the full picture. You also need to know how frequent you enter and exit that level. These 3 metrics track the number of transitions into the respective level. For example, a high number on all 3 counters mean Windows is fluctuating greatly, resulting in inconsistent speed. |
| % DPC Time | Deferred Procedure Calls (DPC). According to this, this counter is a part of the Privileged Time (%) because DPCs are executed in privileged mode. They are counted separately and are not a component of the interrupt counters. |
| % Interrupt Time | Interrupt means the processor was interrupted from executing normal thread. This can happen for a variety of reasons, such as system clock, incoming network packets, mouse and keyboard activity. Interrupt can happen on regular basis, not just ad hoc. For example, the system clock does it every 10 milliseconds in the background. |
| A high interrupt value can impact performance. | |
% Processor Time % Idle Time | These 2 metrics add up to 100% |
% User Time % Privileged Time | These 2 metrics add up to 100%. A program’s process can switch between user mode and kernel mode (when executing system service call). This does not incur CPU context switch as it’s the same thread. As a result, I’m not seeing the use case of knowing the split between kernel mode and user mode. Reference: Windows |
| DPCs Queued/sec | Unlike the CPU Run Queue, this metric captures per processor. It can be handy to compare across processors as there can be imbalance. Note this is a rate counter, not a count of the present queue. It tracks the speed per second. |
| DPC Rate | This is an input to the above, as the above is calculated as the delta of 2 rates, divided over sampling period. |
| Interrupts/sec | As above, but for interrupts. |
| Priority Time | It is a subset of % Processor Time — specifically the portion of busy CPU time consumed by threads running at elevated scheduling priorities |
System Calls/second
-
It is not a CPU metric but is commonly used next to the queue and context-switch counters.
-
A call is a request to the kernel to do work on behalf. It occurs because the program cannot perform a task itself because it involves protected resources (like hardware or memory belonging to other processes). This instruction forces the CPU to switch from Ring 3 (User Mode) to Ring 0 (Kernel Mode).
-
It measures the number of times a software application transitions from User Mode to Kernel Mode to request a service from the kernel.
-
If System Calls/sec is high and Privileged Time (%) is also high (e.g., >30%), the CPU is spending too much time on OS management rather than running your actual application code.
-
Values consistently exceeding 20,000 per processor core are generally considered high and warrant investigation. In most cases, it’s below 2000 per core.
-
This metric is not collected by Tools.
Thread State
In Windows, an application consists of ≥ 1 process. A process consists of ≥ threads. Thread is what is scheduled in the CPU.
It’s easier to understand the CPU scheduling when you think in terms of 2 distinct objects:
-
Processors
-
Threads.
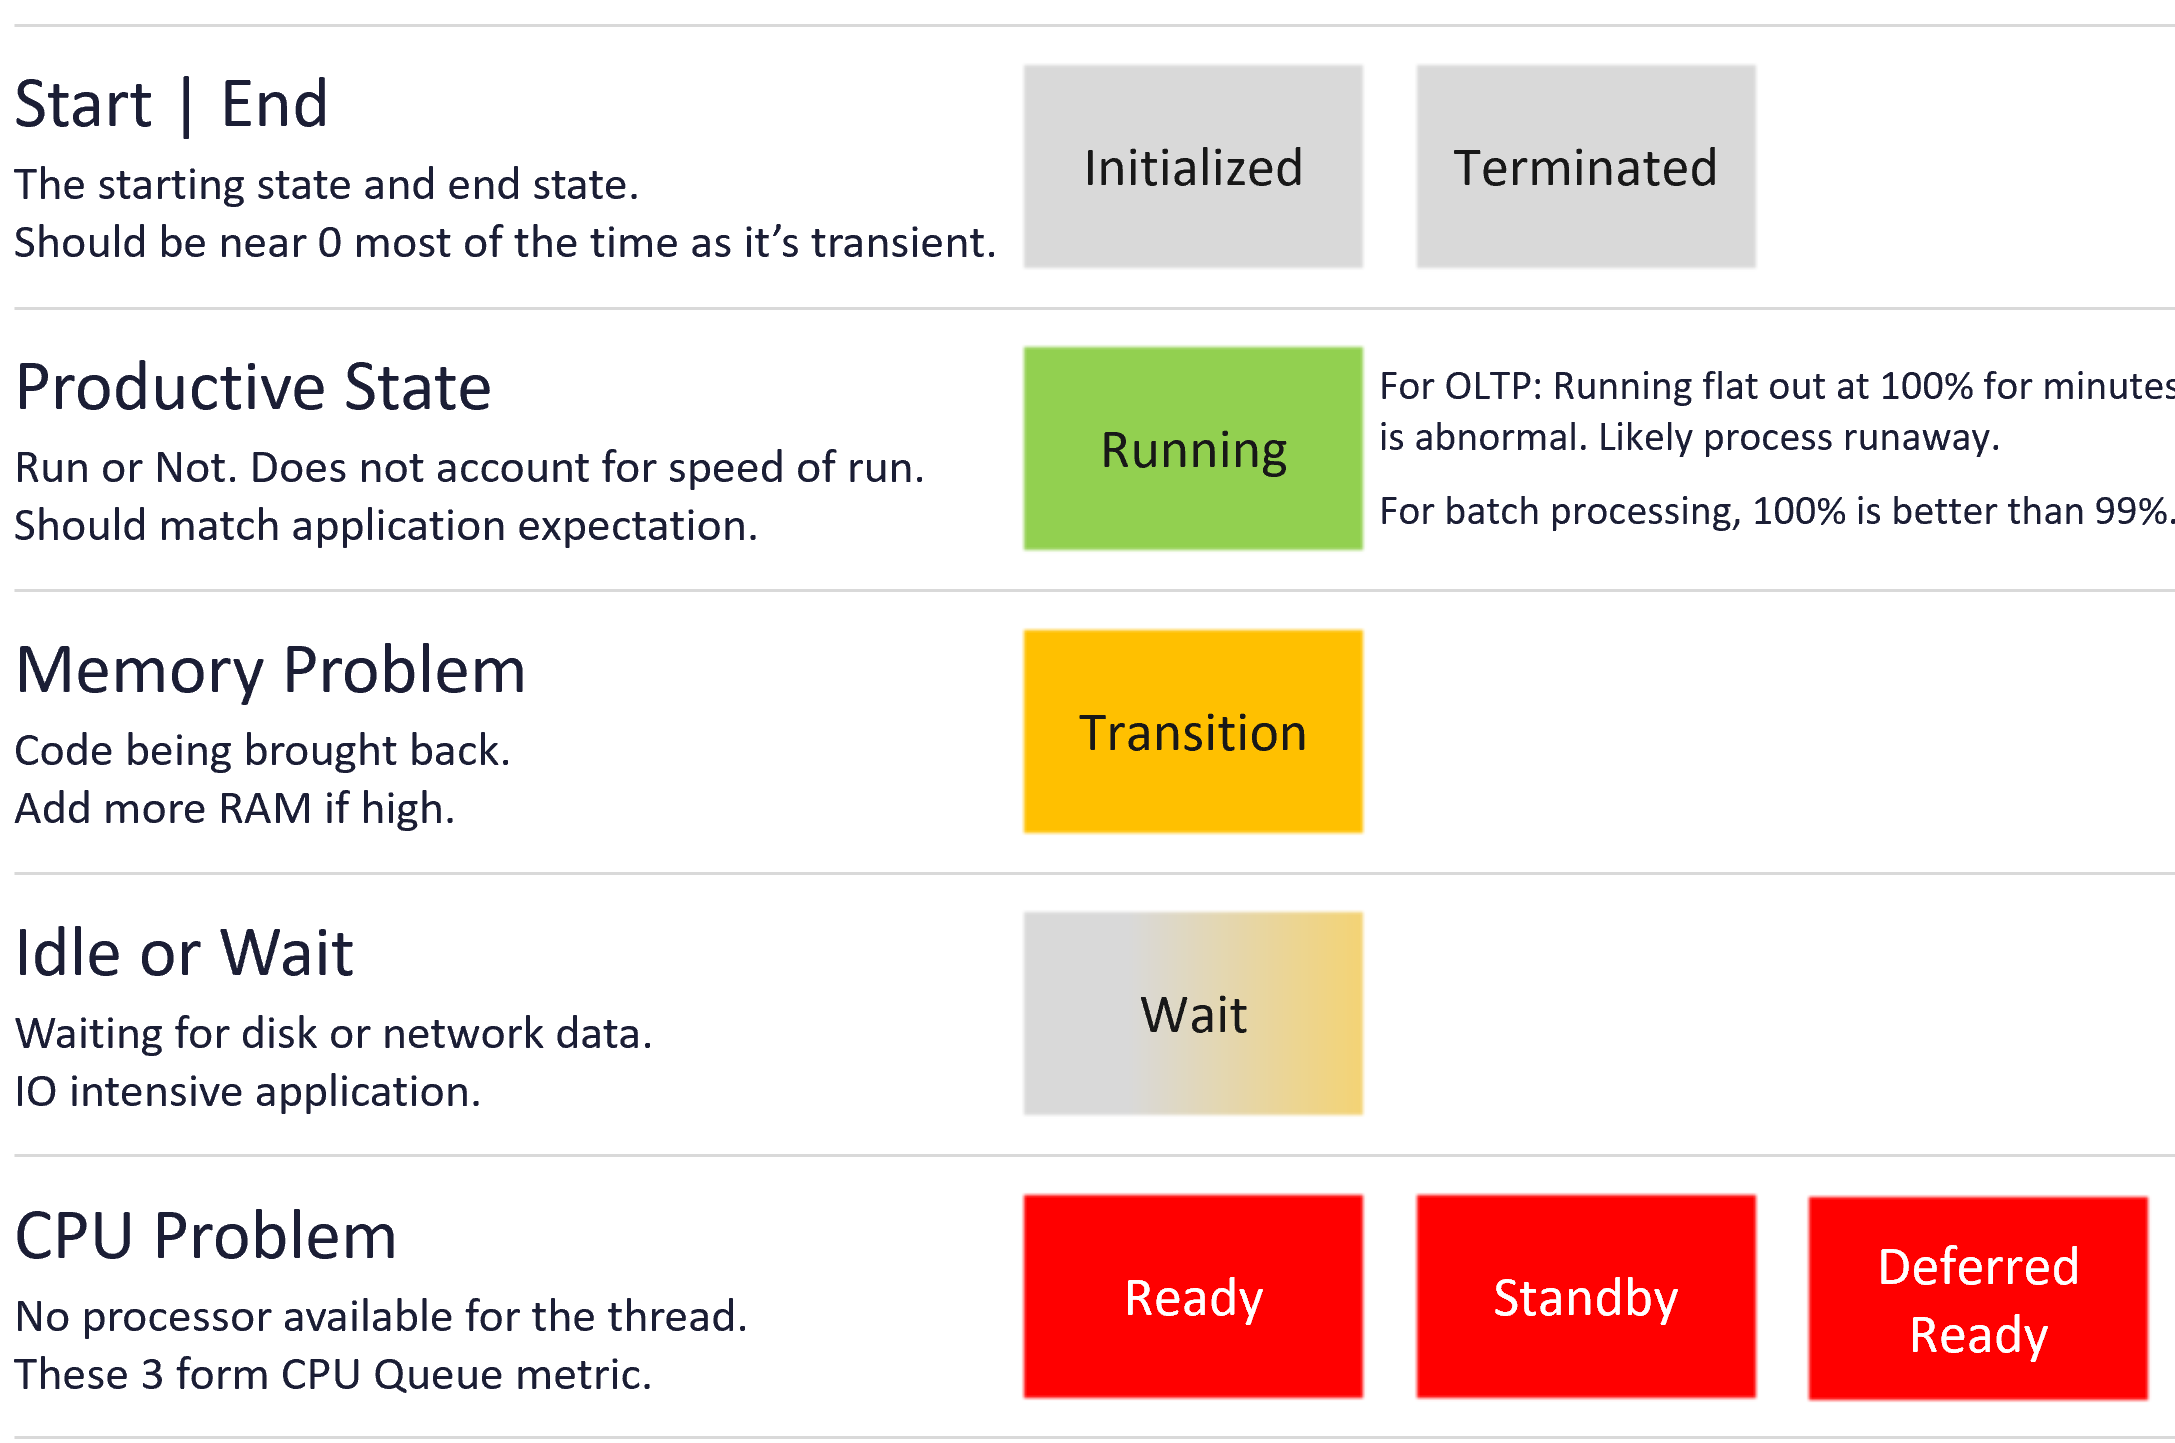
The following information is taken from the famous Windows Internal book, 7th edition and from this Microsoft link. A thread is always in one of these 8 possible states.
You may see a higher or lower number than the number of processors as the observability tools counts the threads, not the processors. Windows PerfMon or WMI code cycles through each thread and get the state. It collects the state at that particular moment. In the 100 milliseconds or so it takes to finish counting thousands of threads, the "Standby" slots on the CPUs could have been emptied and refilled hundreds of times.
CPU Issue
This means there is not enough CPU, or there is the performance issue is with CPU.
| Ready | The thread is waiting to use a processor because all processors are busy running. The thread is prepared to run on the next available processor. When looking for a thread to execute, the CPU dispatcher considers only the threads in this state. |
|---|---|
| It also counts when a thread is waiting to be in-swapped after completing a wait state. | |
| It also counts when a thread was interrupted by higher priority thread, as preemption moves the thread into Ready state. However, it puts the thread at the front of the queue, so it can complete its remaining time slice. | |
The number should be near 0 for most of the time. However, it can be high if you have many high-priority threads constantly "bumping" lower-priority threads. Even though work is technically getting done, the lower-priority threads are "stacking up" in the Ready state, waiting for their chance to finish their interrupted tasks. | |
| Standby | The thread has been selected by Windows as the next thread to run on this processor. Only one thread can be in the standby state for each processor on the system. A Windows OS with 10 processors will have up to 10 threads. When the correct conditions exist, the dispatcher performs a context switch to this thread. Naturally, just because you’re next to be run, does not mean you get to run. A higher priority, typically IO interrupt, can be the thread that got the CPU time. |
| Deferred Ready | When a thread is ready to run (e.g., an I/O operation finishes), the kernel needs to pick a processor for it. Instead of immediately locking that target processor's Ready queue, the kernel puts the thread into a general Deferred Ready list. So the thread has ben selected to run on a specific processor but have not actually started running there. This non-processor specific state exists so that the kernel can minimize the amount of time the per-processor lock on the scheduling database is held. The lock would slow down the CPU currently doing work. |
In Performance Monitor and WMI (Win32_PerfRawData_PerfProc_Thread), the label is typically "Unknown." However, in the actual Windows Kernel logic, it actually means Deferred Ready. |
Non-CPU Issue
CPU is much faster than memory, disk or network. These 2 states capture times where CPU is waiting for data.
| Idle or Wait | "Waiting" is the natural state for 99% of threads. At any given moment, Windows might have 3,000 threads, but 2,950 of them are "Waiting" for user interaction or for a background update to ping a server. |
|---|---|
Possible reasons:
| |
| When the thread’s wait ends, depending on its priority, the thread either begins running immediately or is moved back to the ready state. | |
| The performance issue could be disk or network. | |
| Transition | The thread is waiting as its kernel stack was paged out of memory. After its kernel stack is brought back into memory, the thread enters the ready. You should notice a corresponding increase in Memory Page Faults counter. |
| This indicate the performance issue is with memory, not CPU. Increase memory to the application. |
Other States
| Initialized | A state that indicates the thread is being created, hence it cannot be run yet. |
|---|---|
| The value at this state should be near 0 most of the time. A high value indicates a problem. Check if the application is spawning threads excessively. If not, check why a quick process is taking a long time. | |
| Terminated | A state that indicates the thread has finished executing and has exited. This is not a performance problem if it ends as per planned. |
| Running | A state that indicates the thread is currently using a processor. This is the productive state, meaning work is being done, hence it’s the only state in green. |
The value should be close to the sum of infrastructure team sizing and application team sizing. Infrastructure team size based on Windows or Linux, plus the standard software such as VMware Tools and Security Agents. This is fairly standardized across all virtual machines. Application team size based on their application workload. It can be profiled by before versus after of the application loading. |
Run Queue
Number of threads in the processor queue. Unlike Linux, Windows excludes the threads that are running (being executed).
Let’s take a VM configured with 8 vCPUs. The Guest OS sees 8 threads so it will schedule up to 8 parallel processes. If there is more demand, it will have to queue them. This means the queue needs to be accounted for in Guest OS sizing.
Because it reports the queue, this is the primary counter to measure Guest OS CPU performance. It tells you if the CPU is struggling to serve the demand or not.
What is a healthy value?
Here is my take:
| | 2 - 4 per processor |
|-----|---------------------|
| | 4 – 8 per processor |
| | > 8 per processor |
Windows Performance Monitor UI description is not consistent with MSDN documentation (based on Windows Server 2016 documentation). The description shown in Windows UI is “Processor Queue Length is the number of threads in the processor queue. Unlike the disk counters, this counter shows ready threads only, not threads that are running. There is a single queue for processor time even on computers with multiple processors. Therefore, if a computer has multiple processors, you need to divide this value by the number of processors servicing the workload. A sustained processor queue of less than 10 threads per processor is normally acceptable, dependent of the workload.”
MSDN document states that a sustained processor queue of greater than 2 threads generally indicate processor congestion. SQL Server document states 3 as the threshold. Let me know if you have seen other recommendations from Microsoft or Linux.
Windows or Linux utilization may be 100%, but as long as the queue is low, the workload is running as fast as it can. Adding more vCPU will in fact slow down the performance as you have higher chance of context switching.
You should profile your environment, because the number can be high for some VMs. Just look at the numbers I got below. I profiled 3385 Windows VM in the last 1 month. I plotted the highest value.
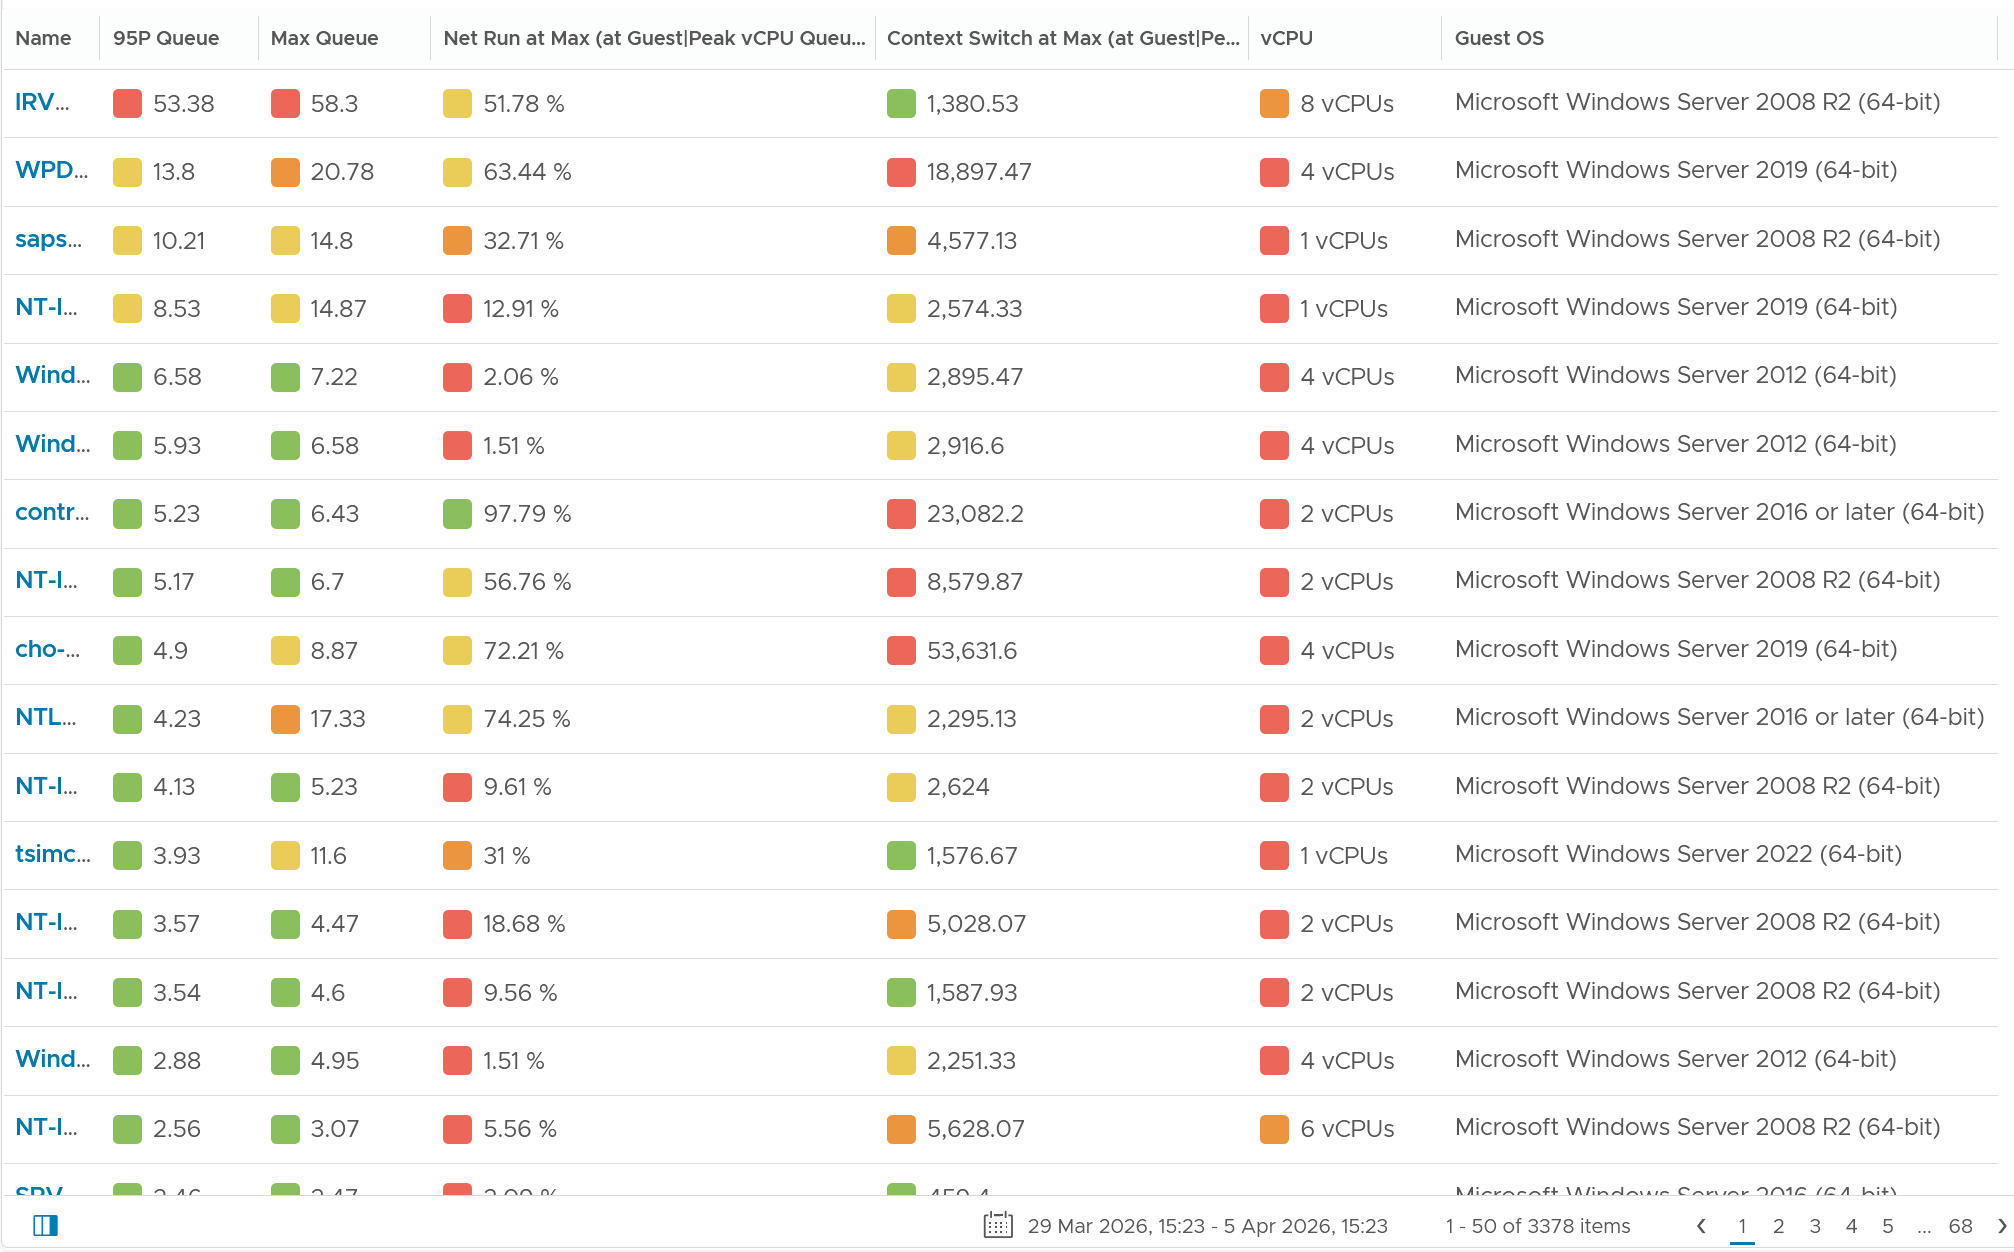
Columns explanation:
-
95P means the value at 95th percentile during the last 1 week.
-
I take 95th percentile because there are 30240 data points.
-
While the collection is every 5 minutes, the value is a snapshot taken every 20 seconds. It is the highest among 15 data points. There are 15 data points * 7 days * 24 hours * 12 = 30240 data points.
-
-
Max Queue means the highest in the last 1 week. That means it is the highest of 30240 data points.
-
Net Run at Max means the value of CPU Net Run when the value of vCPU Queue is at the highest. Using the first VM as an example, Net Run showed 52% when CPU Queue was at 58%. It’s a correlated number.
-
Context Switch as Max means the value of Microsoft Windows CPU Context Switch when the value of vCPU Queue is at the highest.
-
vCPU is the present configured CPU. This number is generally stable, hence I took the present.
High CPU Queue
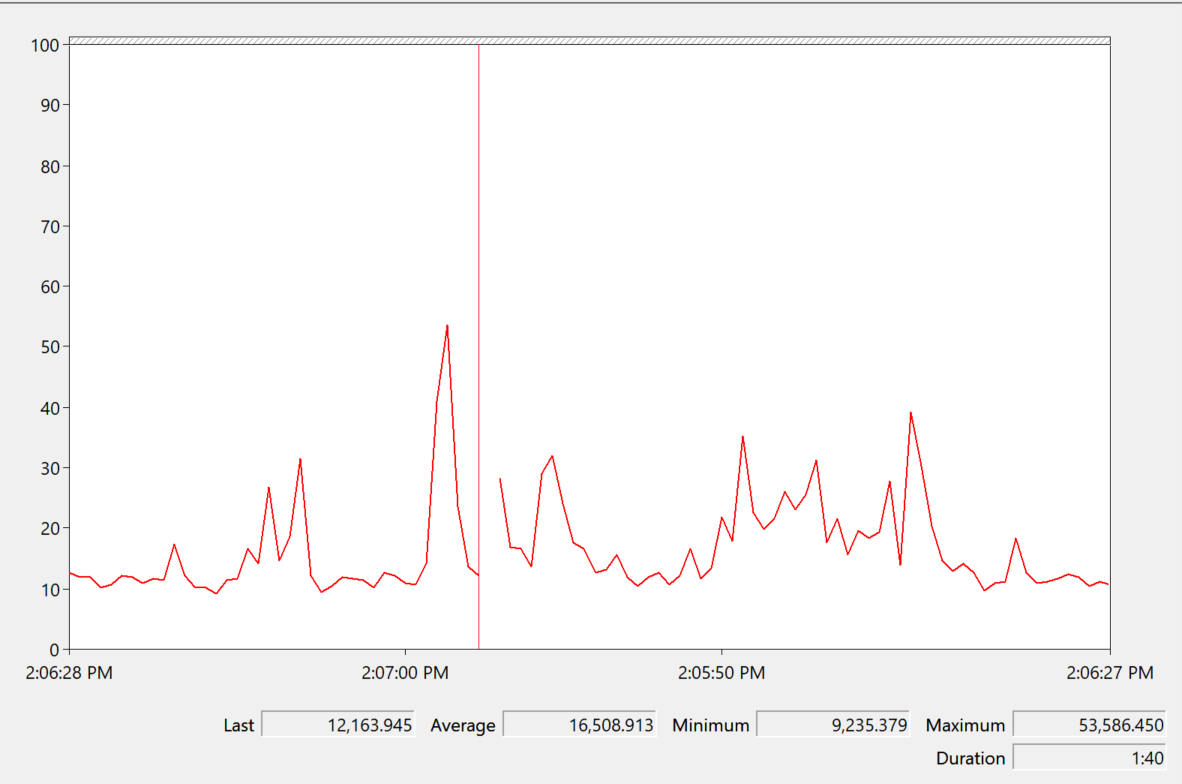
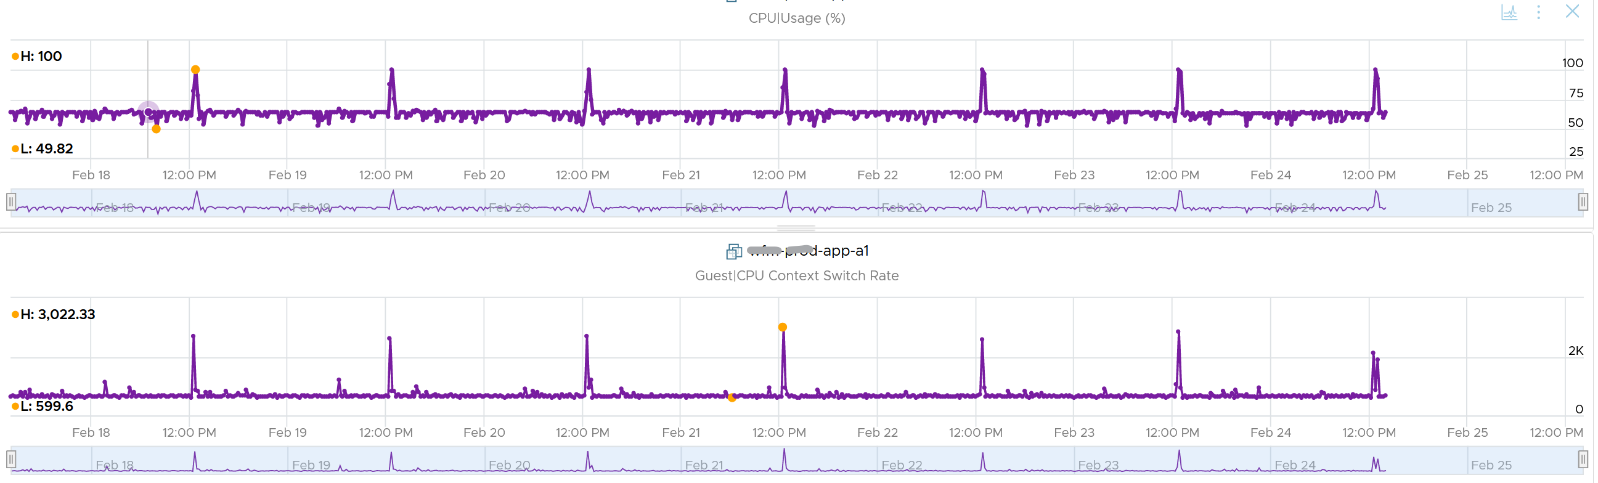
Let’s drill down to the first VM in the preceding table.
How can an 8 vCPU Windows Server VM have CPU Queue of 53 when only running at 52%?
We expect the number to be around 8 since only half the CPU are running. Basically it should be 0 Ready + 8 Standby + 0 Deferred Ready.
What do you notice from the following chart?
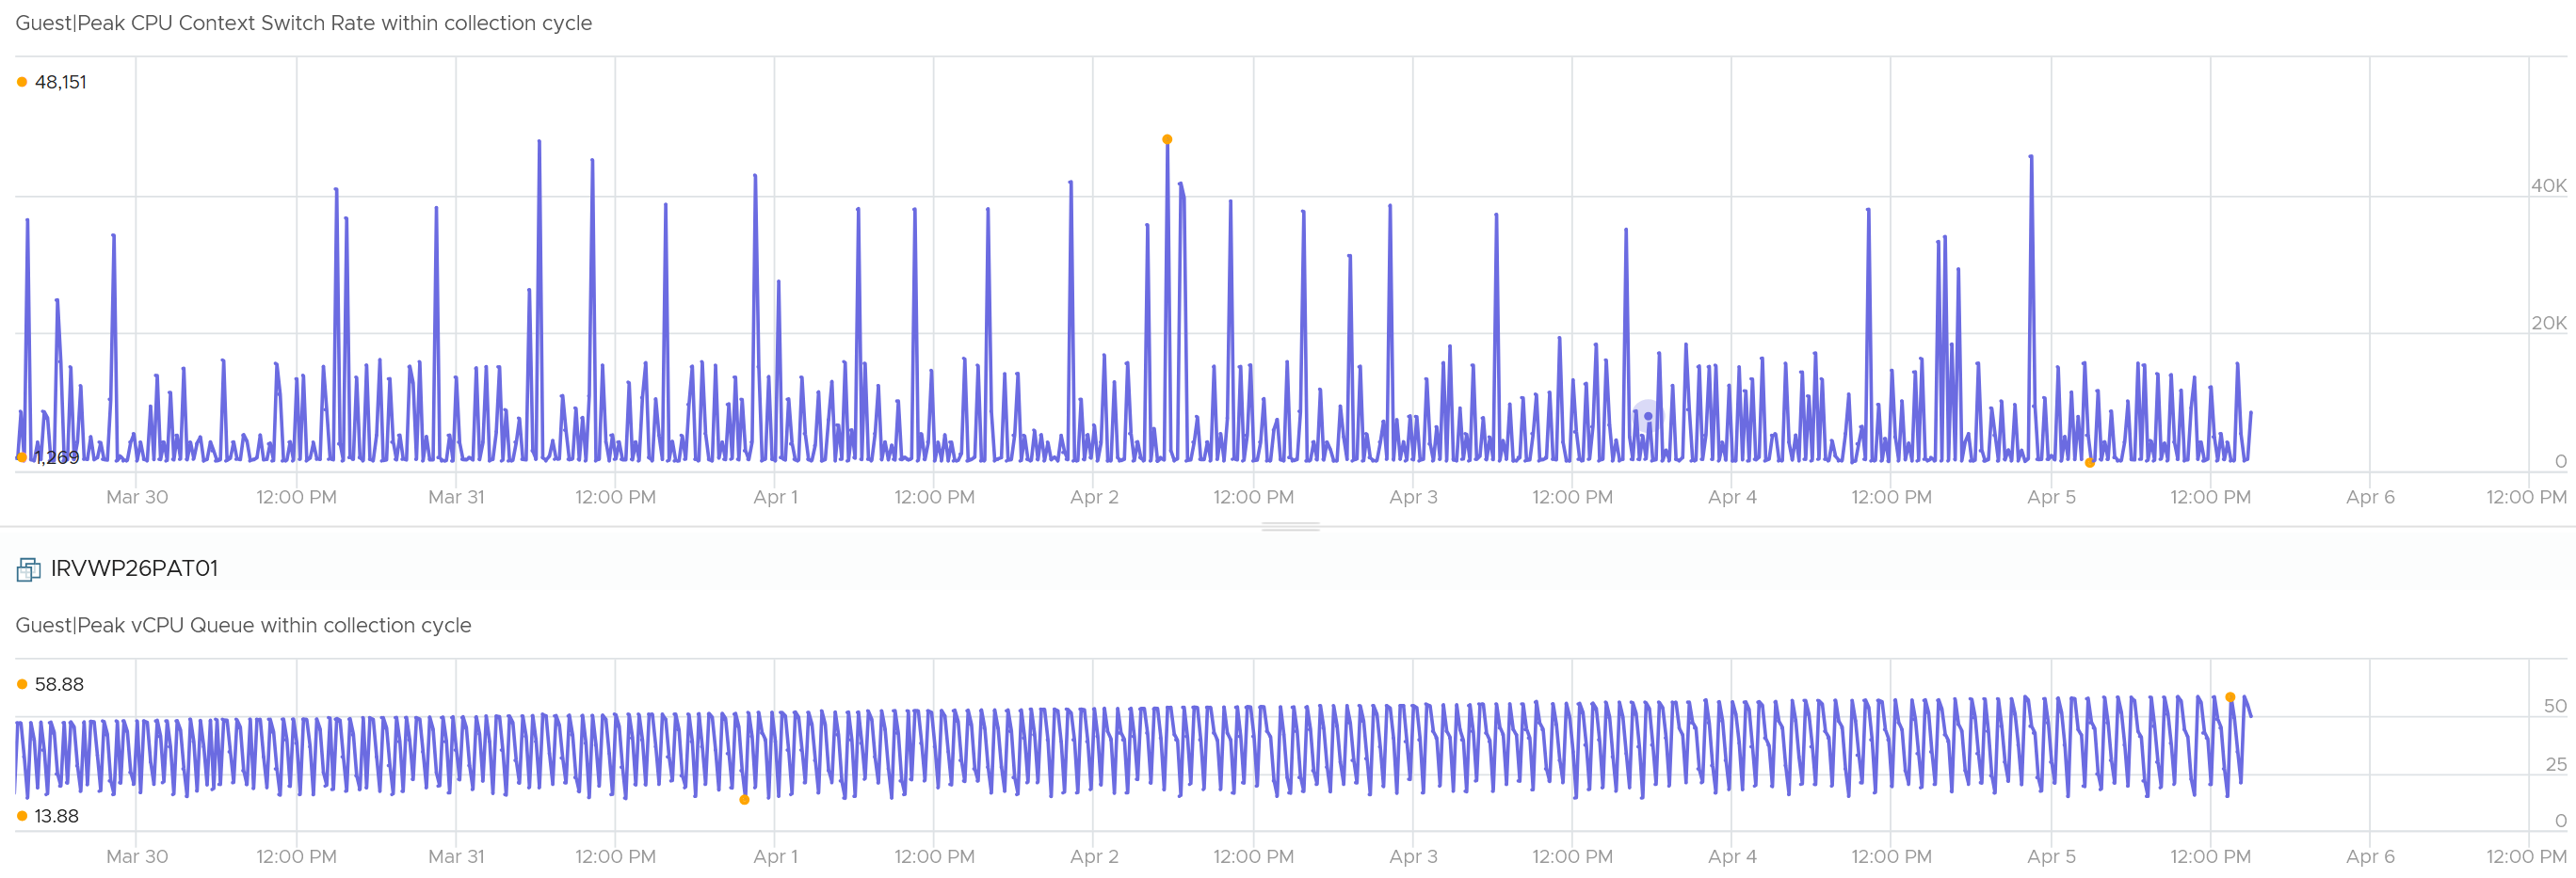
There seems to be no strong correlation between CPU Queue and CPU Context Switch.
The CPU Queue:
-
Fluctuates from 14 to 59 constantly. The pattern is repeatable. When I zoomed in, each cycle has a sharp jump within 5 – 10 minutes, then slowly drops over 1 hour.
-
Trend upwards over 7 days. It’s a gentle trend. This means something that slowly deteriorates caused it. Memory leak?
FYI:
-
CPU Ready, CPU Co-Stop and CPU Other Wait are all low. This means NUMA is not an issue.
-
Memory contention is flat 0.
-
Virtual Disk latency is low most of the time, and did not correspond to the above 3 charts.
Here is CPU consumption metrics:
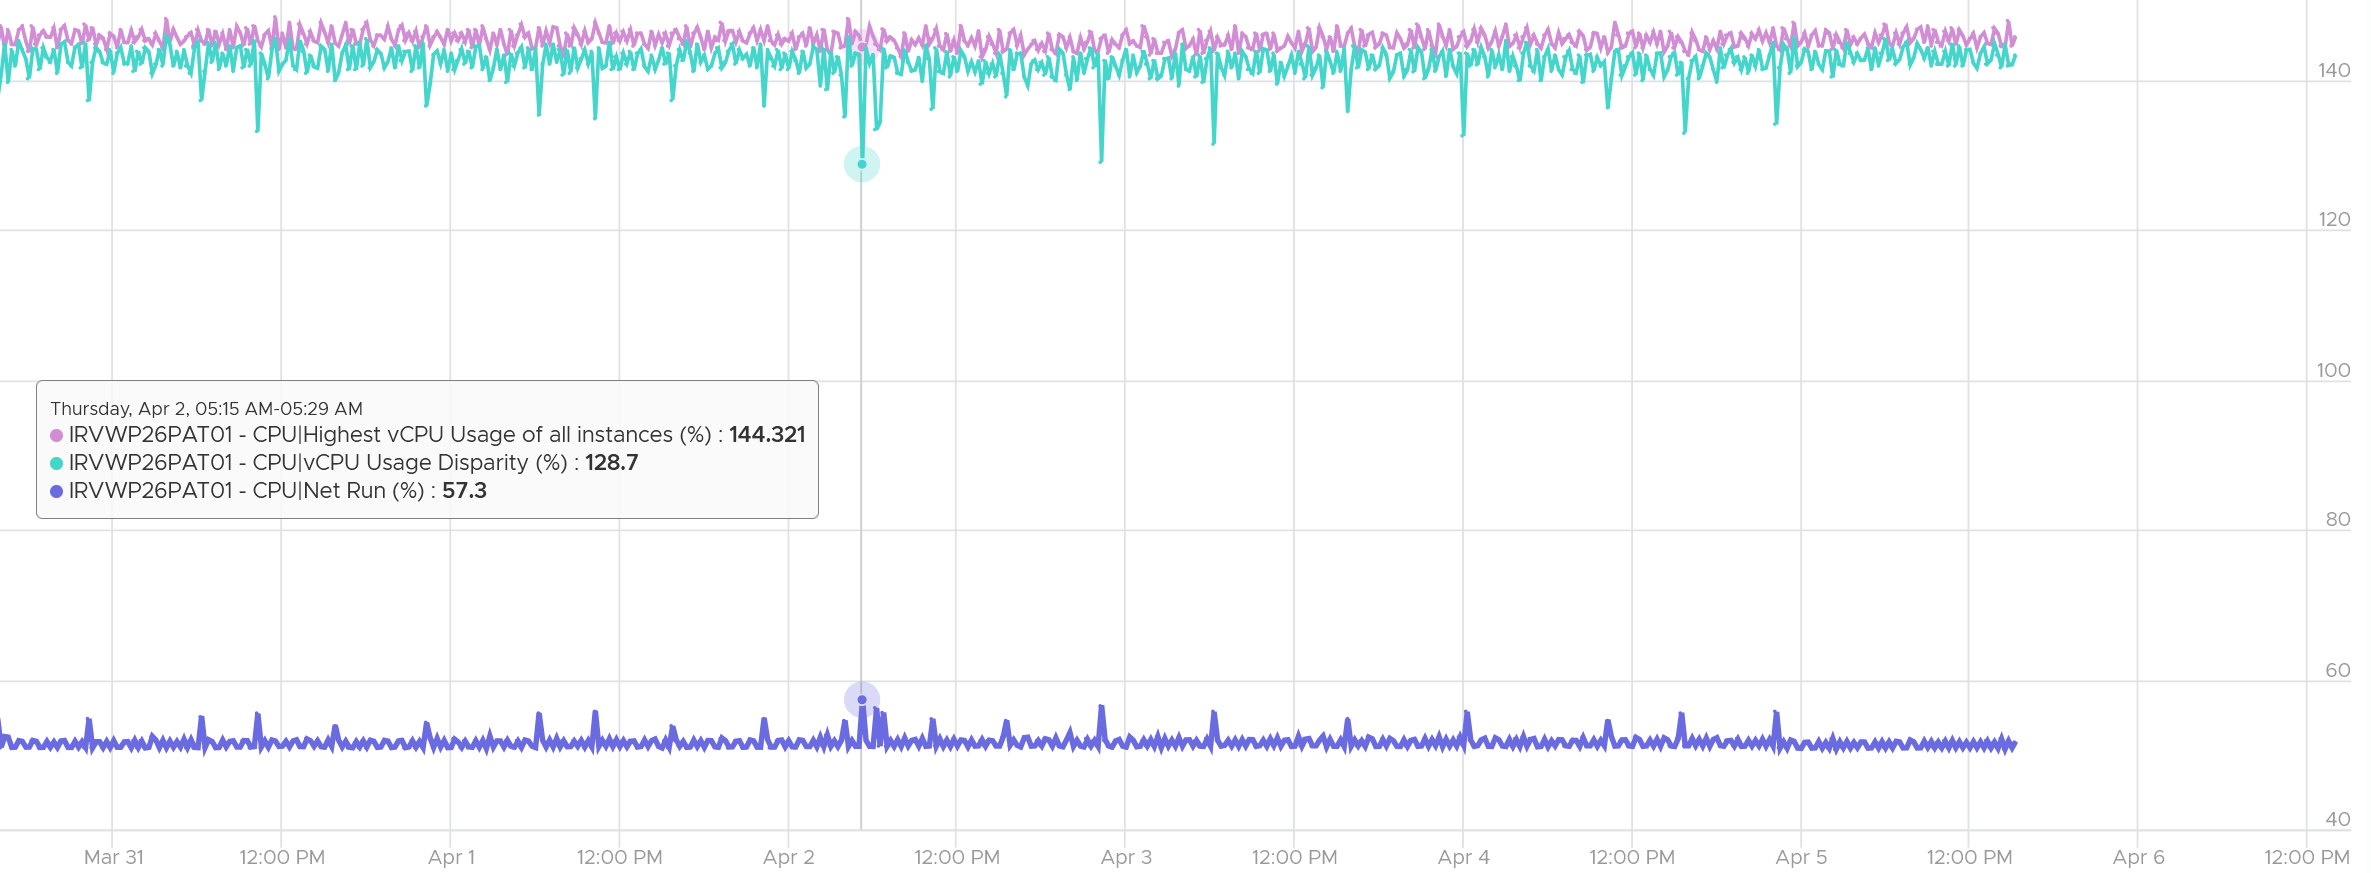
We can see massive imbalance. While the average CPU Run is 50%, the gap between the busiest vCPU and the least busy is >140%. Seems like the threads congregate in some of the CPU.
I don’t have the details of the invidual vCPU. It will be interesting to plot each to see if there is high thread migation.
Let’s pick a shorter time window so we can see the chart clearly.
The following chart shows the pattern over 6 hours.
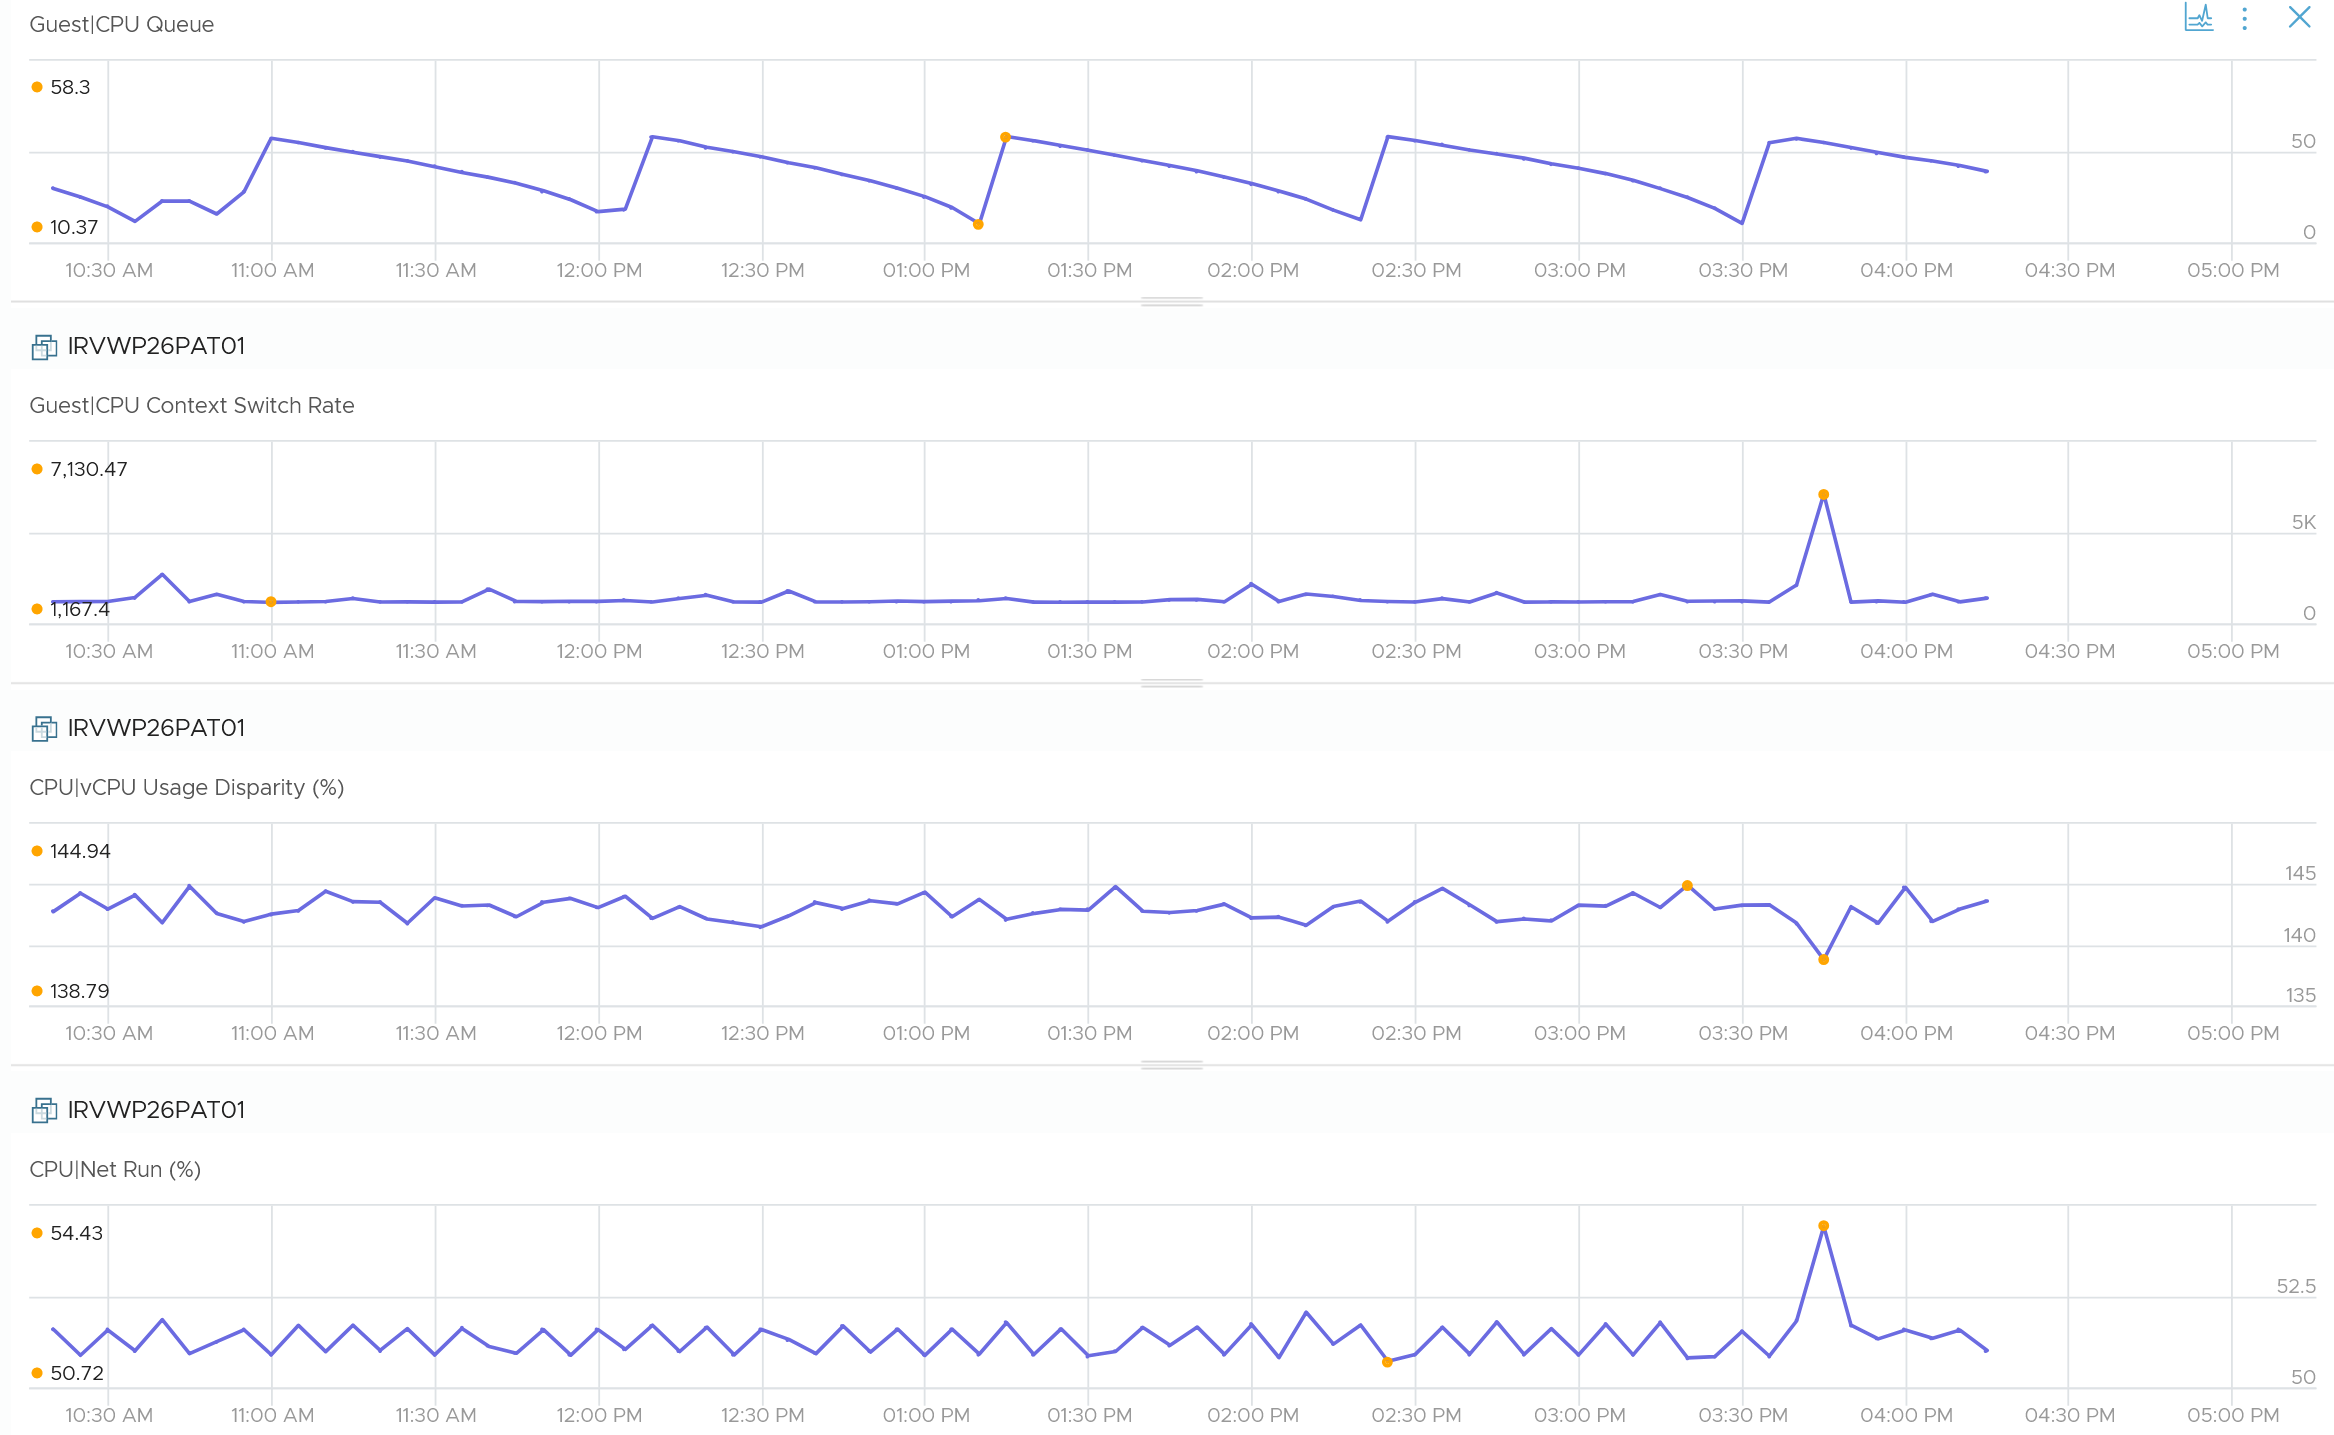
The spike on CPU Context switch does not match the CPU Queue. There is a match to CPU Run, which makes sense. CPU Usage Disparity went down, because the overall CPU Run went up.
Other things to check:
-
Is it running a multi-threaded application? Some applications spawn many threads. If yes, it’s possible that many threads are waiting for a Software Lock (like a Mutex or Semaphore). The threads in the queue cannot be distributed to those idle cores because they are all waiting for a specific resource held by a thread on a different core. They are marked as "Ready" because they aren't waiting on I/O, but they are effectively stuck in a bottlenecked pipeline.
-
If Processor% Privileged Time counter is high but User Time counter is low, the kernel (drivers/interrupts) is hogging the CPU, not the application. We have a driver or kernel-locking.
Low CPU Run
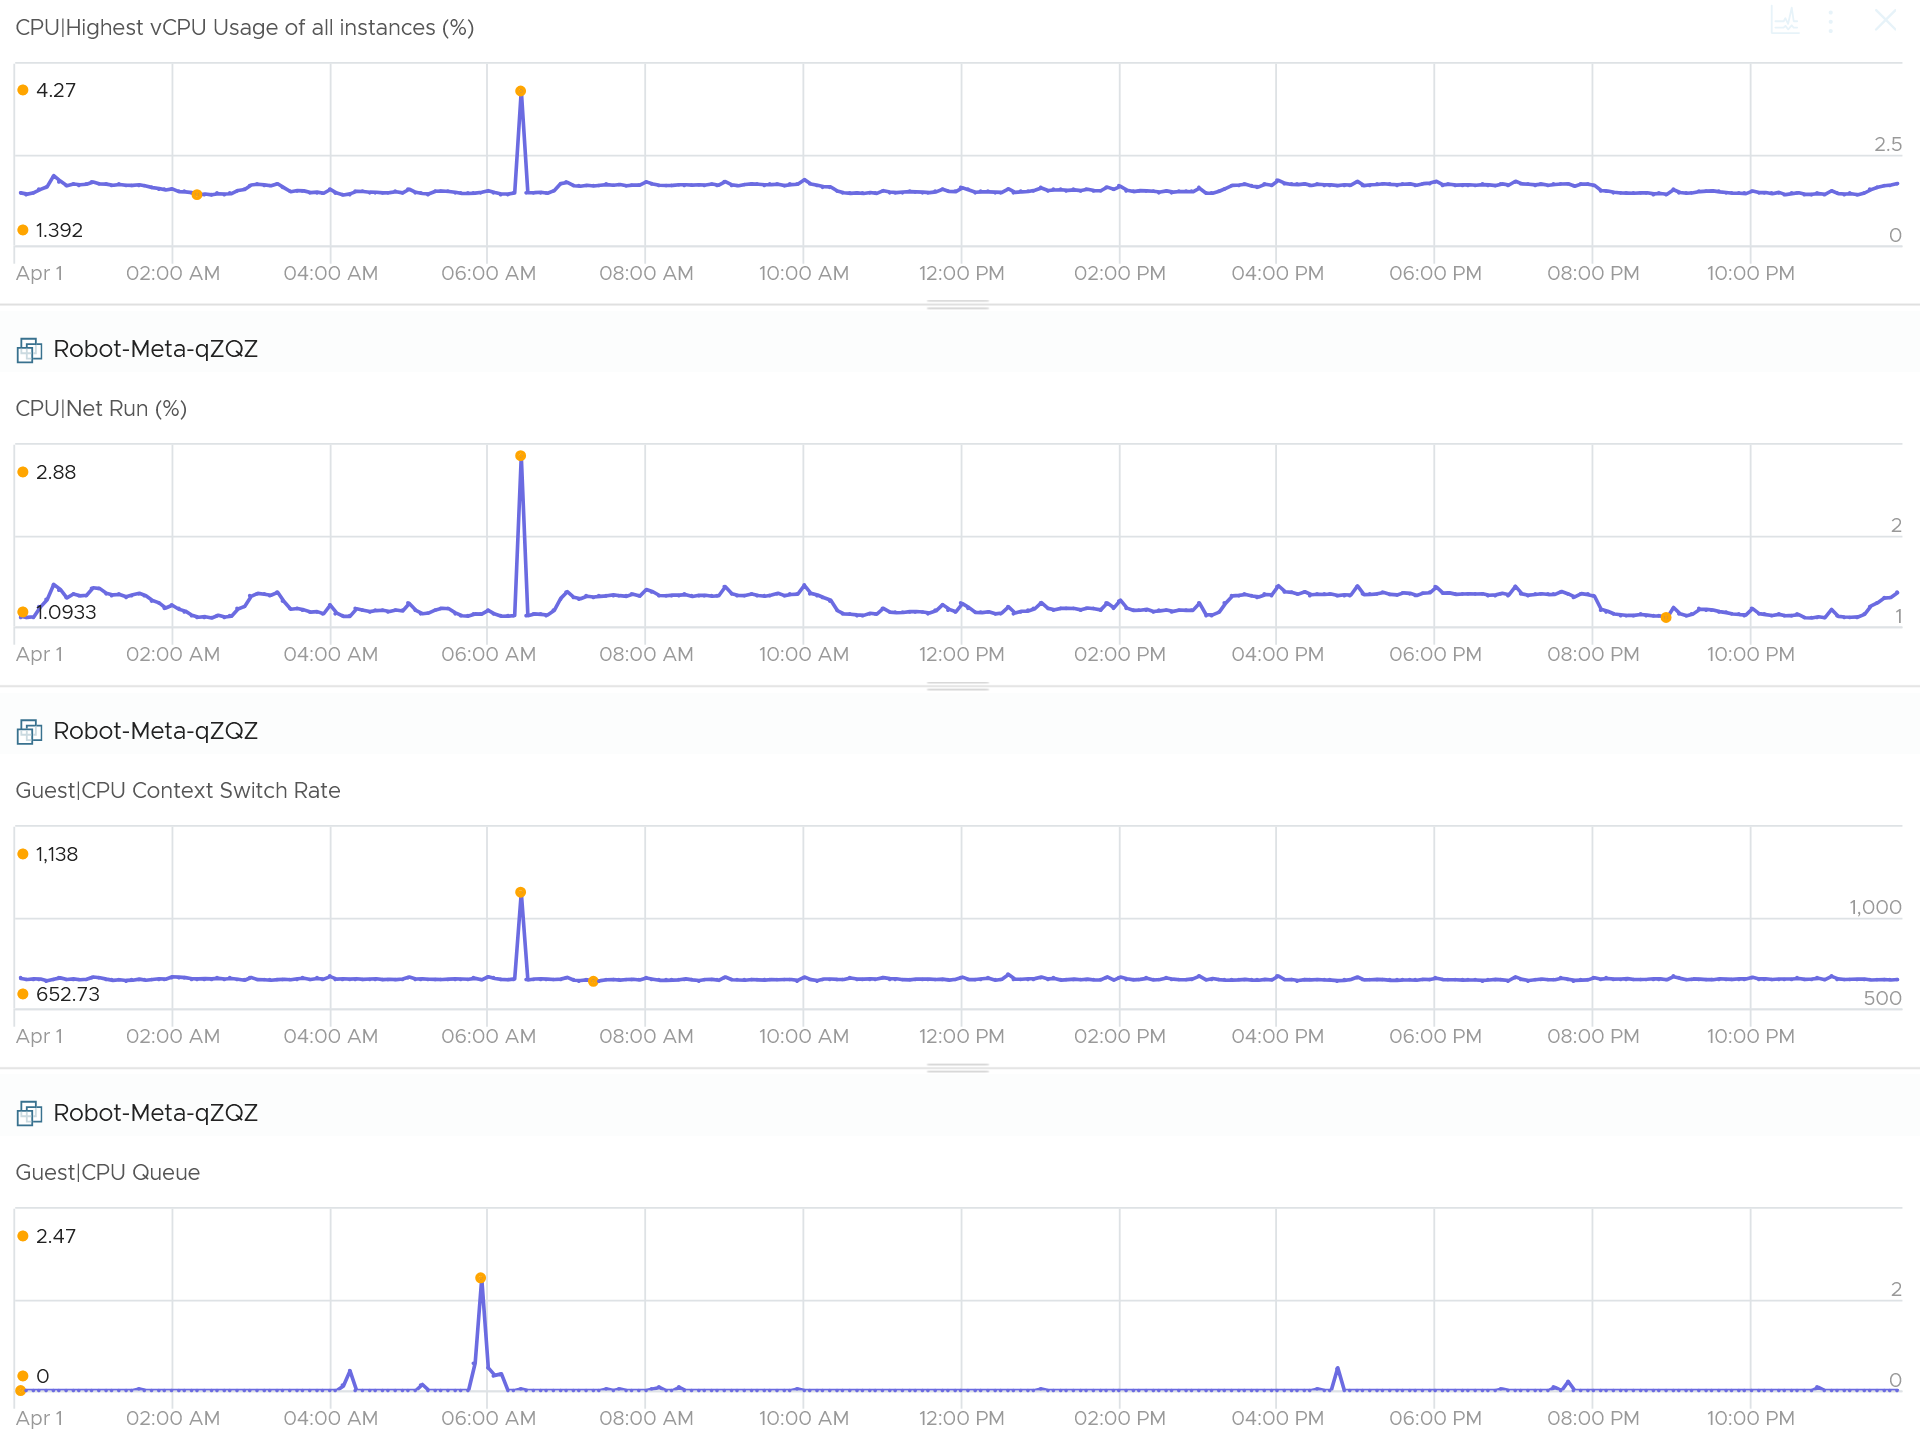
How about when Net Run (%) is low?
The following Microsoft Windows server VM has 2 vCPU only.
FYI:
-
CPU Ready is below 0.5%. CPU Co-Stop and CPU Other Wait are all low. This is expected as the VM is basically idle.
-
Memory contention is flat 0.
-
Virtual Disk latency is 1 ms, and did not correspond to the above 3 charts.
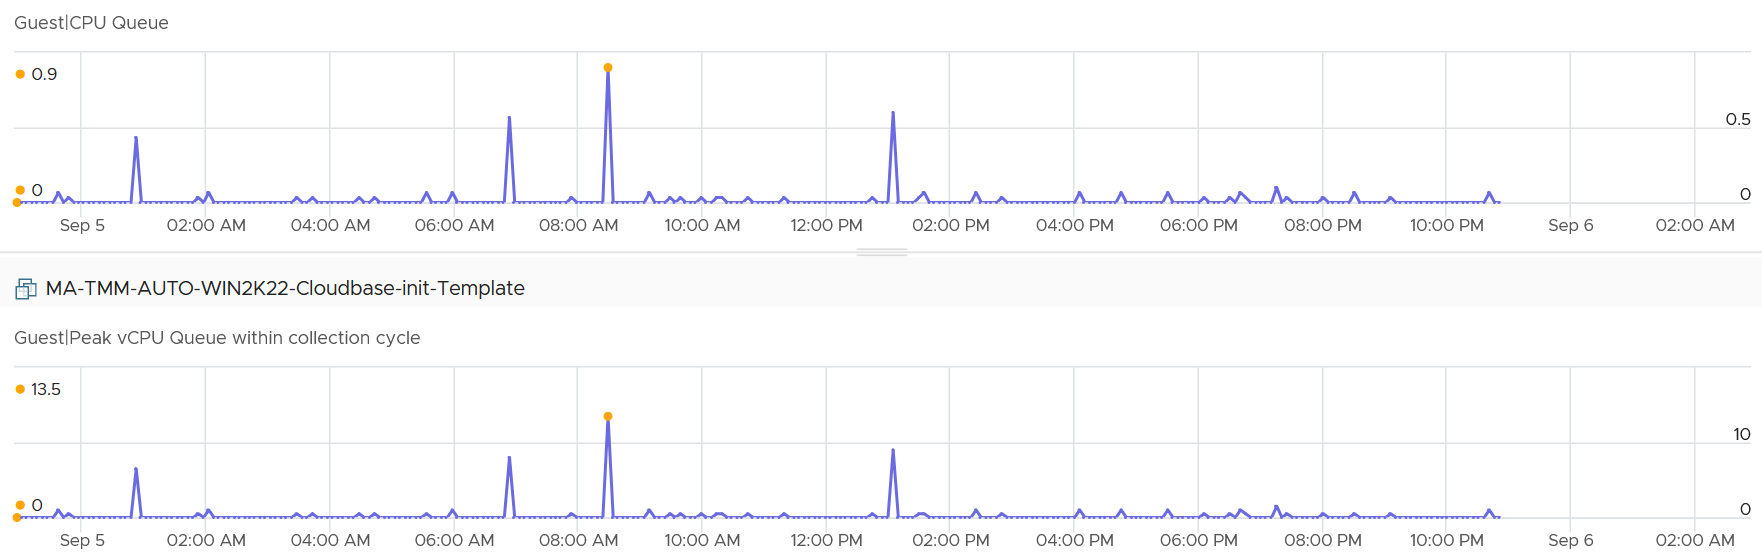
Queue and Idle
It is possible that Guest OS shows high CPU queue when it was idling. This is abnormal, indicating the application created a lot of threads. The following shows the application was idling while having high queue.
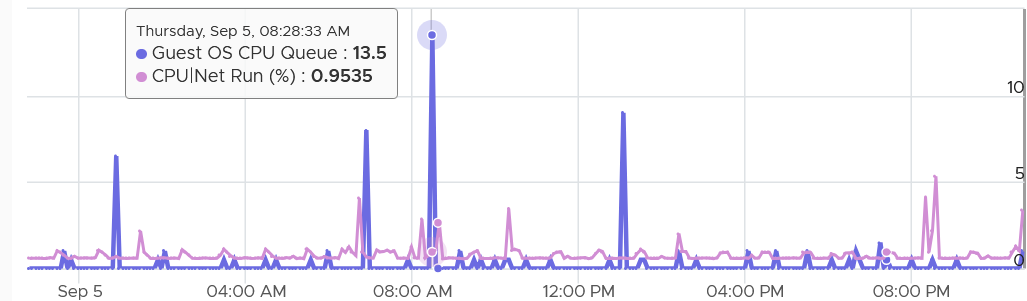
The CPU Run Queue spikes multiple times. It does not match the CPU Usage. It also did not match CPU Context Switch Rate pattern. The spike only last 20 seconds, as the 5-minute average shows identical pattern but much smaller number.
Overall Behaviour
What is the behaviour of CPU Queue?
I profiled 800 VM in the last 1 month. For each VM, I extracted the peak value and the 99th percentile value. From the following scatter chart, you can see that the value at 99th percentile is less than half. Using a spreadsheet, the average value of the 99th percentile is 34% for peak that is ≥ 3.
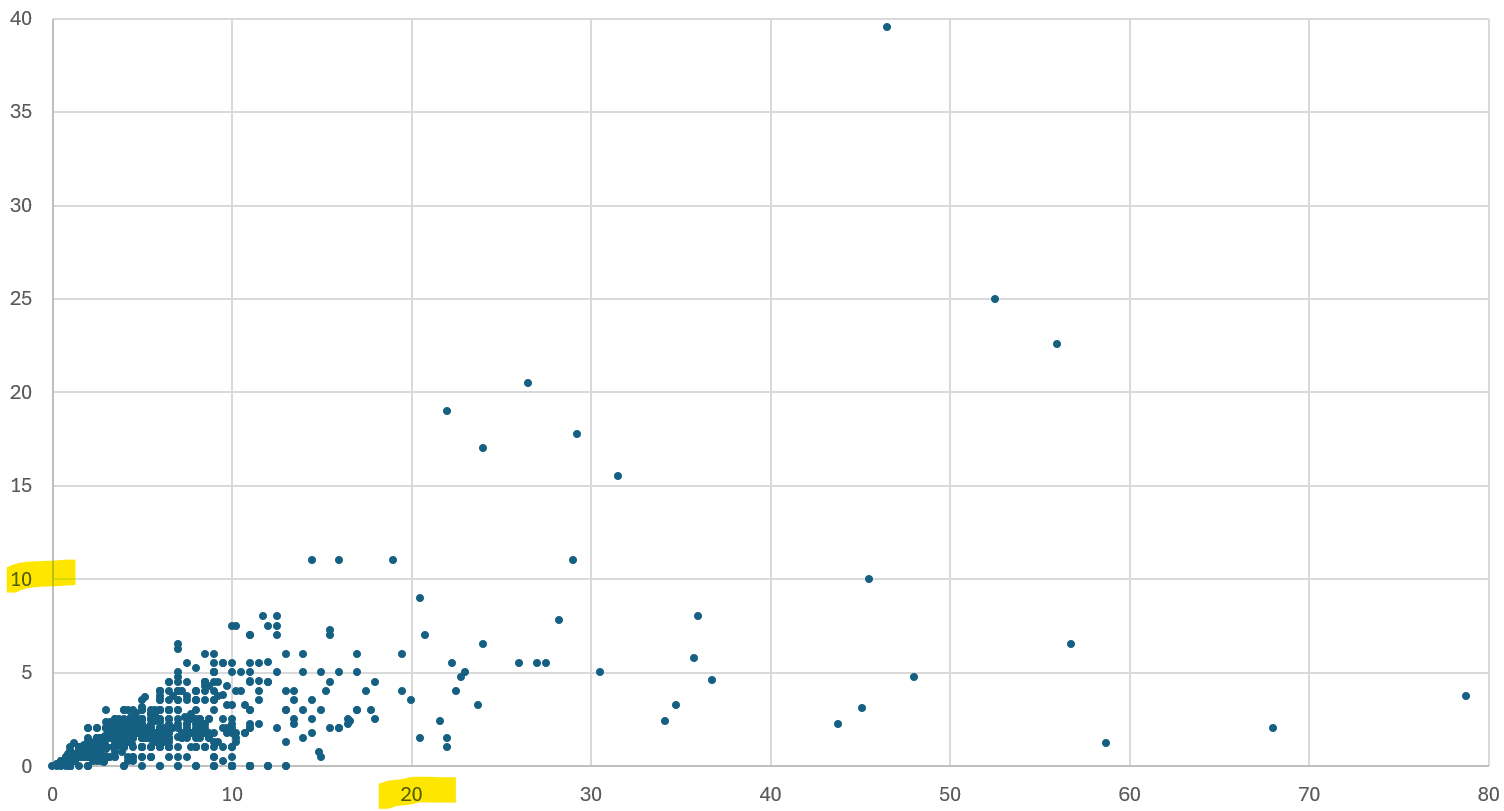
BTW, the value from Guest OS displays the last observed value only; it is not an average. Windows & Linux do not provide the highest and lowest variants either.
The counter name in Tools is guest.processor.queue. For Windows, it is based on Win32_PerfFormattedData_PerfOS_System = @#ProcessorQueueLength from WMI
Reference: Windows
I can’t find documentation that states if CPU Hyper Threading (HT) technology provides 2x the number of queue length. Logically it should as the threads are at the start of the CPU pipelines, and both threads are interspersed in the core pipeline.
CPU Priority
If a process is often in queue, one possility is it has lower relative priority. Priority is a concept of Windows that ESXi does not have. ESXi uses a fair-share scheduler instead, as it does not have foreground processes.
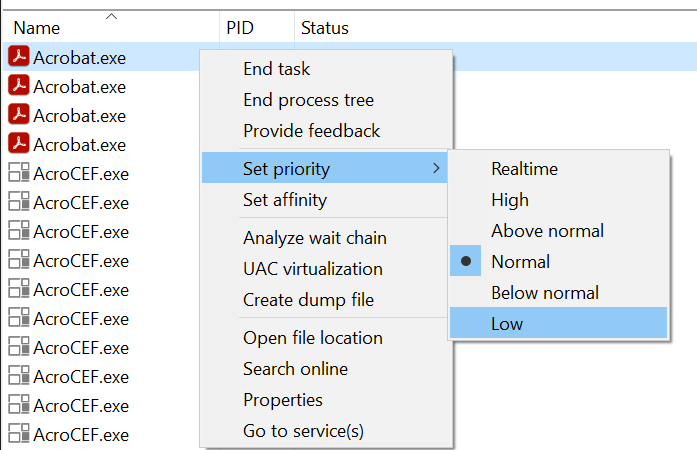
Windows or Linux provides priority for foreground activities, as that’s what the user experience. For Windows, there are 6 levels as shown below. Ensure all your agents are given lower priority and limited CPU resource.
Context Switch
CPU Context Switch costs performance “due to running the task scheduler, TLB flushes, and indirectly due to sharing the CPU cache between multiple tasks”. It’s important to track this counter and at least know what’s an acceptable behaviour for that specific application.
Context switches are considered “expensive” operations, as the CPU can complete many instructions within the time taken to switch context from one process to another. A sustained high number degrade performance noticeably through "cache pollution" — where the CPU has to constantly reload data into L1/L2 caches because the previous thread was swapped out.
For further reading, read this paper.
Based on Windows 10 Performance Monitor documentation, context switches/sec is the combined rate at which all processors on the computer are switched from one thread to another. All else being equal, the more the processors, the higher the context switch. Note that thread switches can occur either inside of a single multi-thread process or across processes. A thread switch can be caused either by one thread asking another for information, or by a thread being pre-empted by another, higher priority thread becoming ready to run.
Here is my take:
| | 2K – 4K per processor |
|-----|-----------------------|
| | 4K – 8K per processor |
| | > 8K per processor |
There are context switch metrics on the System and Thread objects. VCF Operations only report the total.
The rate of Windows or Linux switching CPU context per second ranges widely. The following is taken from a Windows 10 desktop with 8 physical threads, which runs around 10% CPU. I observe the value hovers from 10K to 50K.
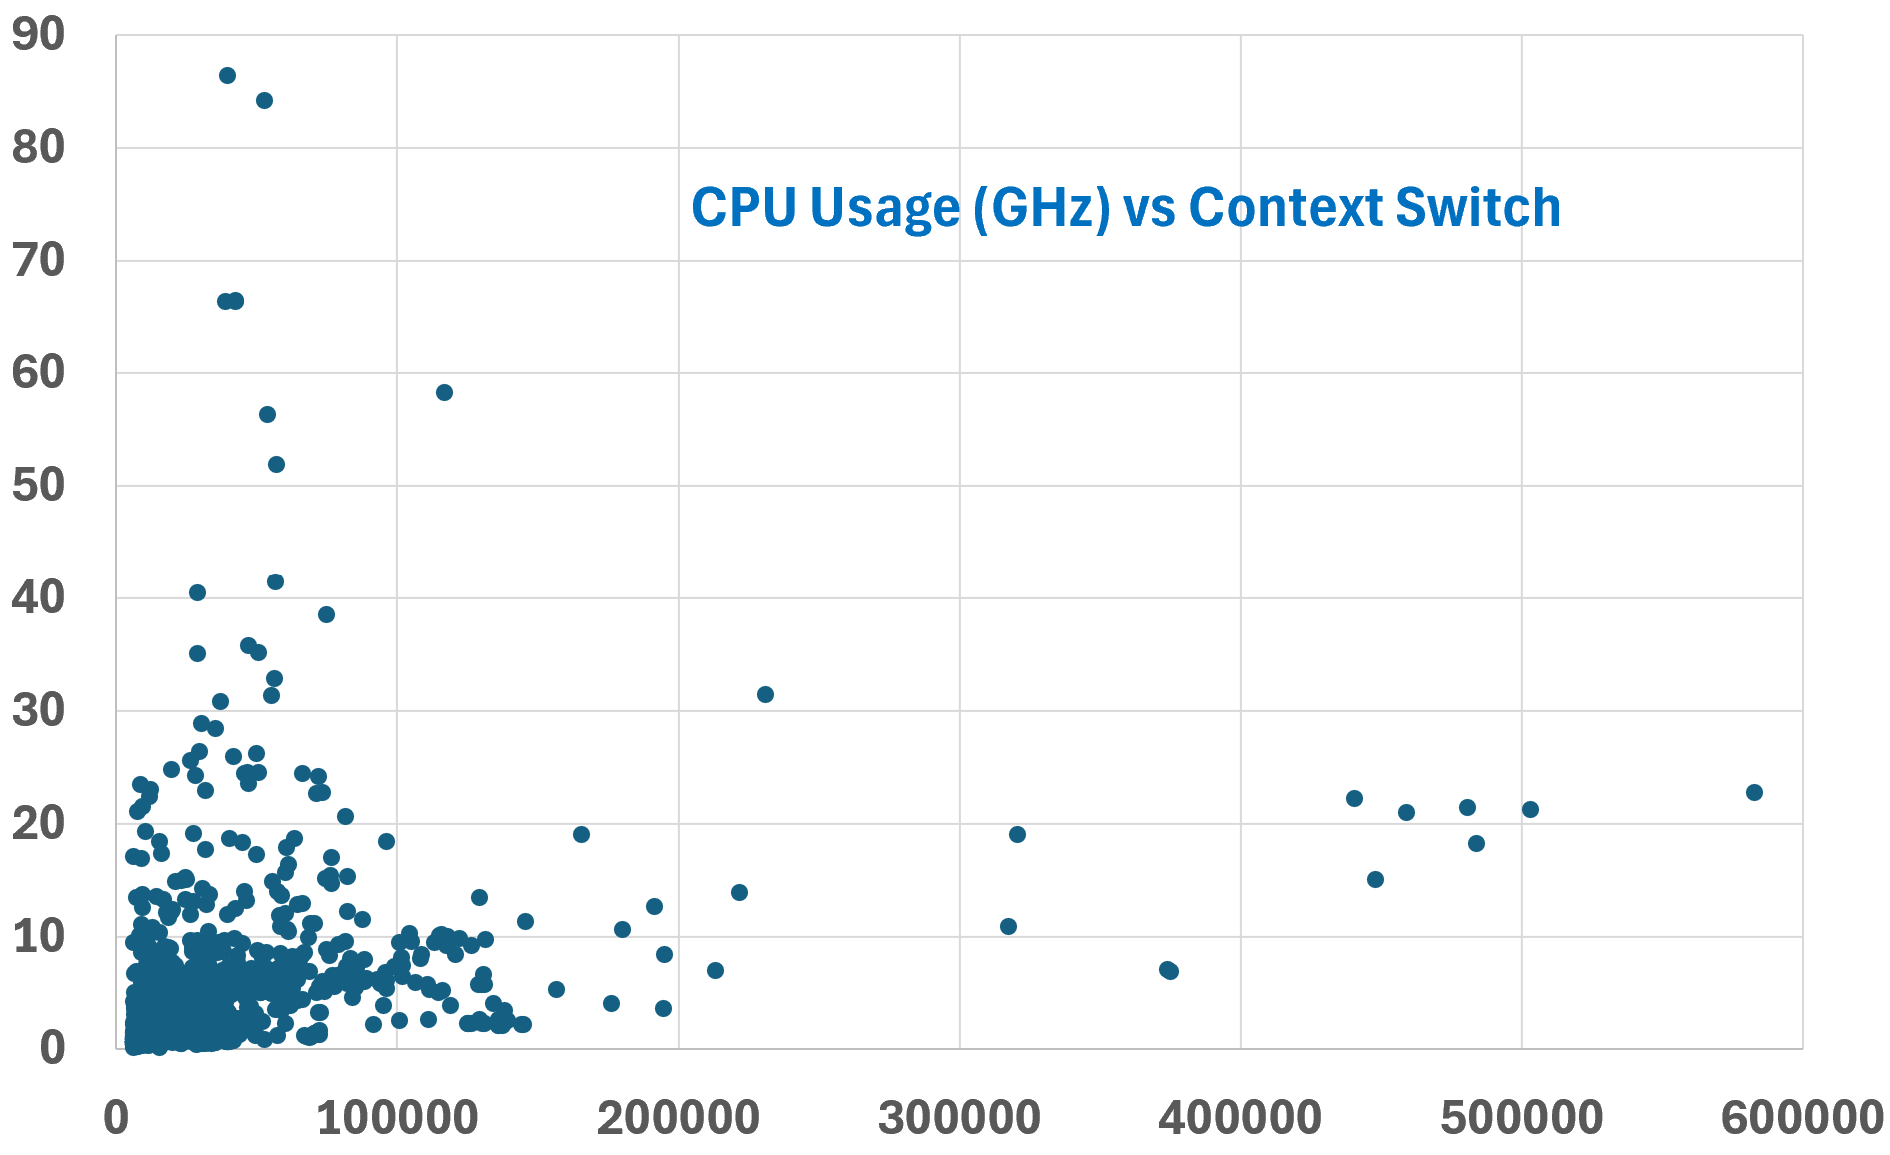
Correlation
The value does not correlate well with CPU “utilization”, because not all CPU instructions require context switching. Overall, the higher the utilization the higher the chance of CPU context switch. I plotted 3328 VM on a scatter chart.
The above does not mean there is no correlation. The following chart shows a near perfect corelation. Every time CPU Usage went up, CPU Context Switch also. I should have plotted the disk IO or network IO as IO operations tend to require context switch.
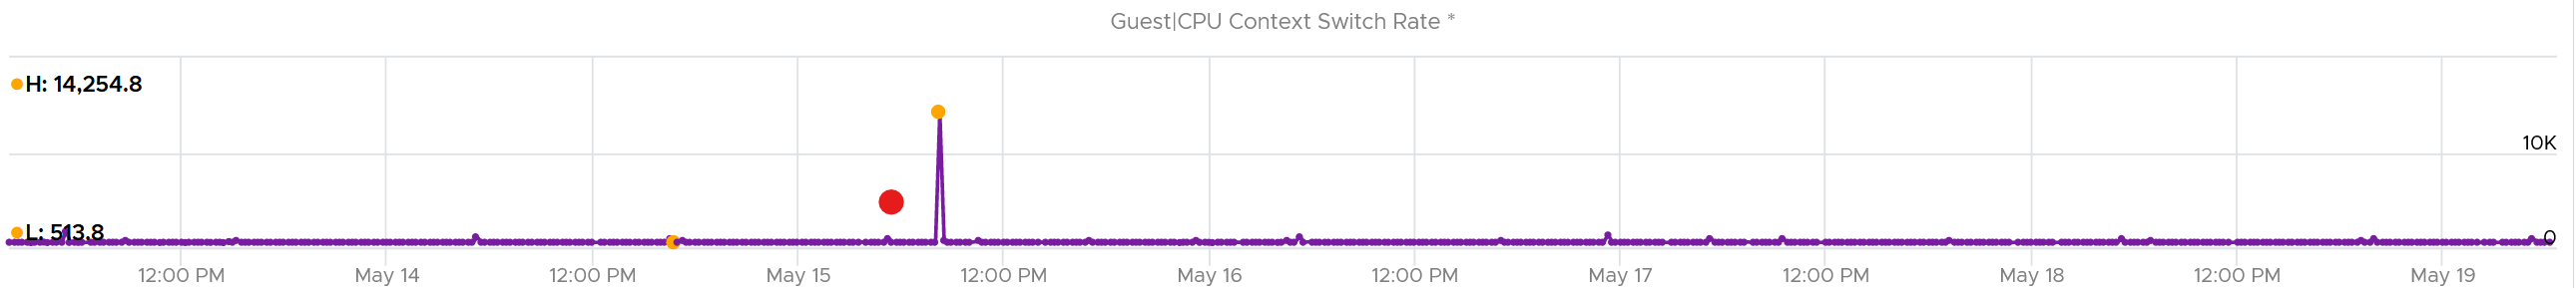
CPU context switch can happen even in a single thread application. The following shows a VDI VM with 4 vCPU. I plotted the CPU Usage Disparity vs CPU Context Switch. You can see the usage disparity went up to 78%, meaning the gap between the busiest vCPU and the idlest vCPU is 78%. This was running a security agent, which is unlikely to be designed to occupy multiple vCPU.
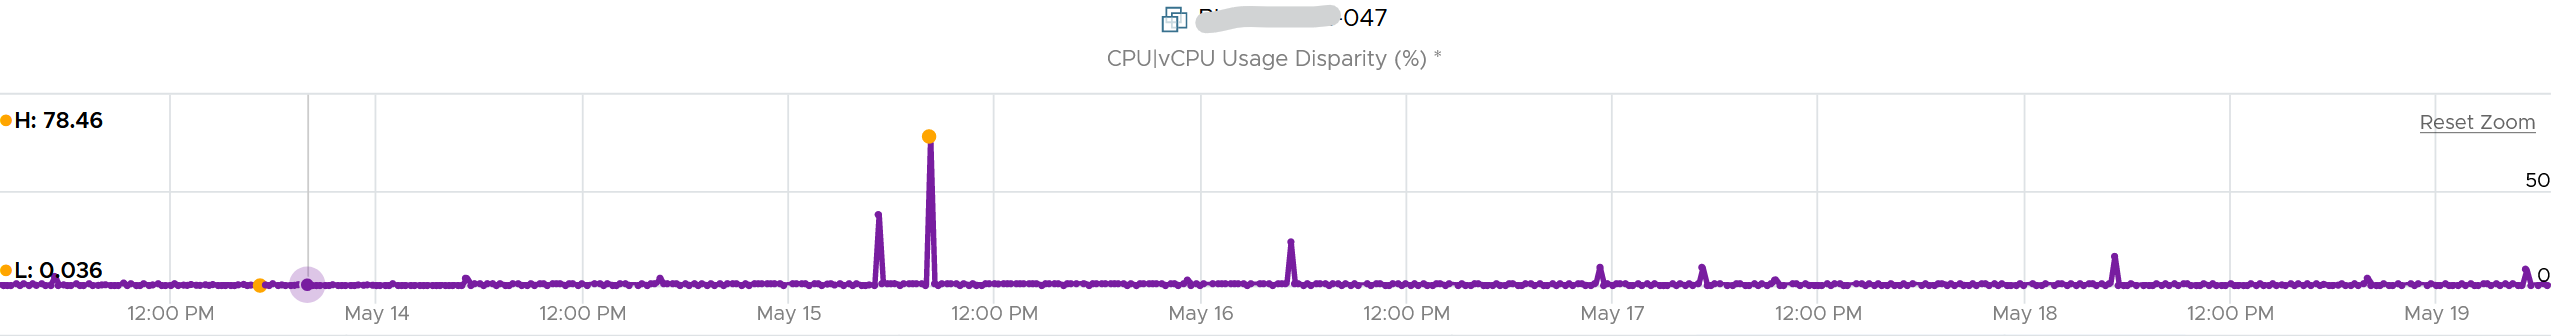
Let’s plot the context switch at the same period. There is a spike at the same time, indicating that the agent was busy context switching. Note that it does not always have to be this way. The red dot shows there is no spike in context switch even though the vCPU Usage Disparity went up.
Range Analysis
The values of CPU Context Switch vary widely. For many VM, the values will be in low hundreds. In extreme situation, it can sustain well beyond 10 millions, as shown in the preceding chart. The above VM was not doing heavy IOPS nor high CPU usage. There was no correlation with these 2 metrics either.
Because of above, it’s important to profile and establish a normal base line for that specific application. What is healthy for 1 VM may not be healthy for another.
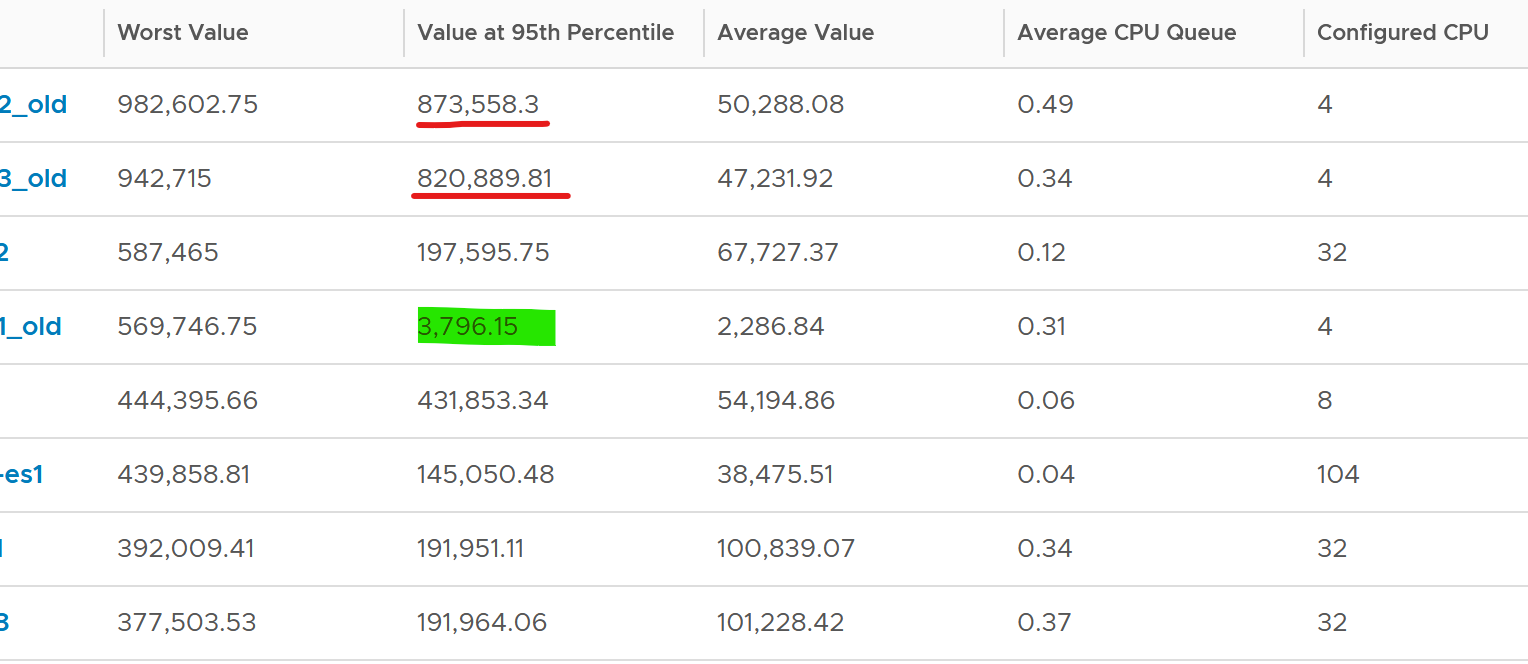
You can see from the table that some VM experience prolonged CPU context switch, while others do not. The VM #4 only has a short burst as the value at worst 5th percentile dropped to 3796. Momentary peak of context switch may not cause performance problem so in general it’s wiser to take the value somewhere between 95th and 99th percentile.
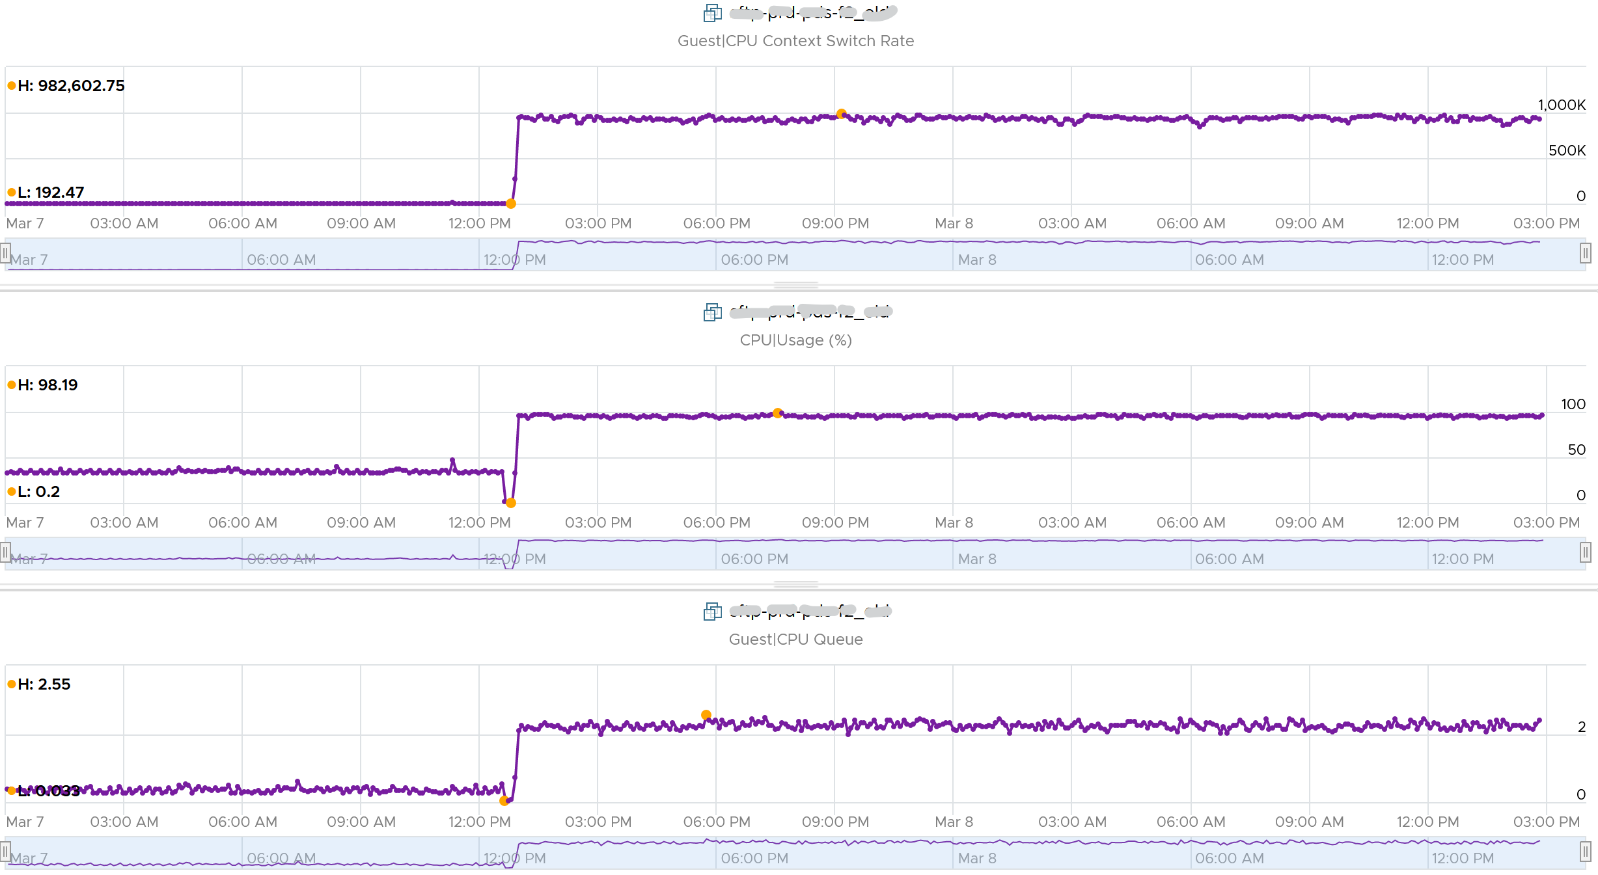
Let’s drill down to see the first VM. This CentOS VM sporting only 4 vCPU constantly hit almost 1 million context switches. The pattern match CPU Usage.
Do you add more CPU?
You should not, as the queue remain manageable. Check what the queue like on a more granular reading.
The following distribution chart shows the values from 11372 VMs. I had to use log-10 scale as the values vary wildly.
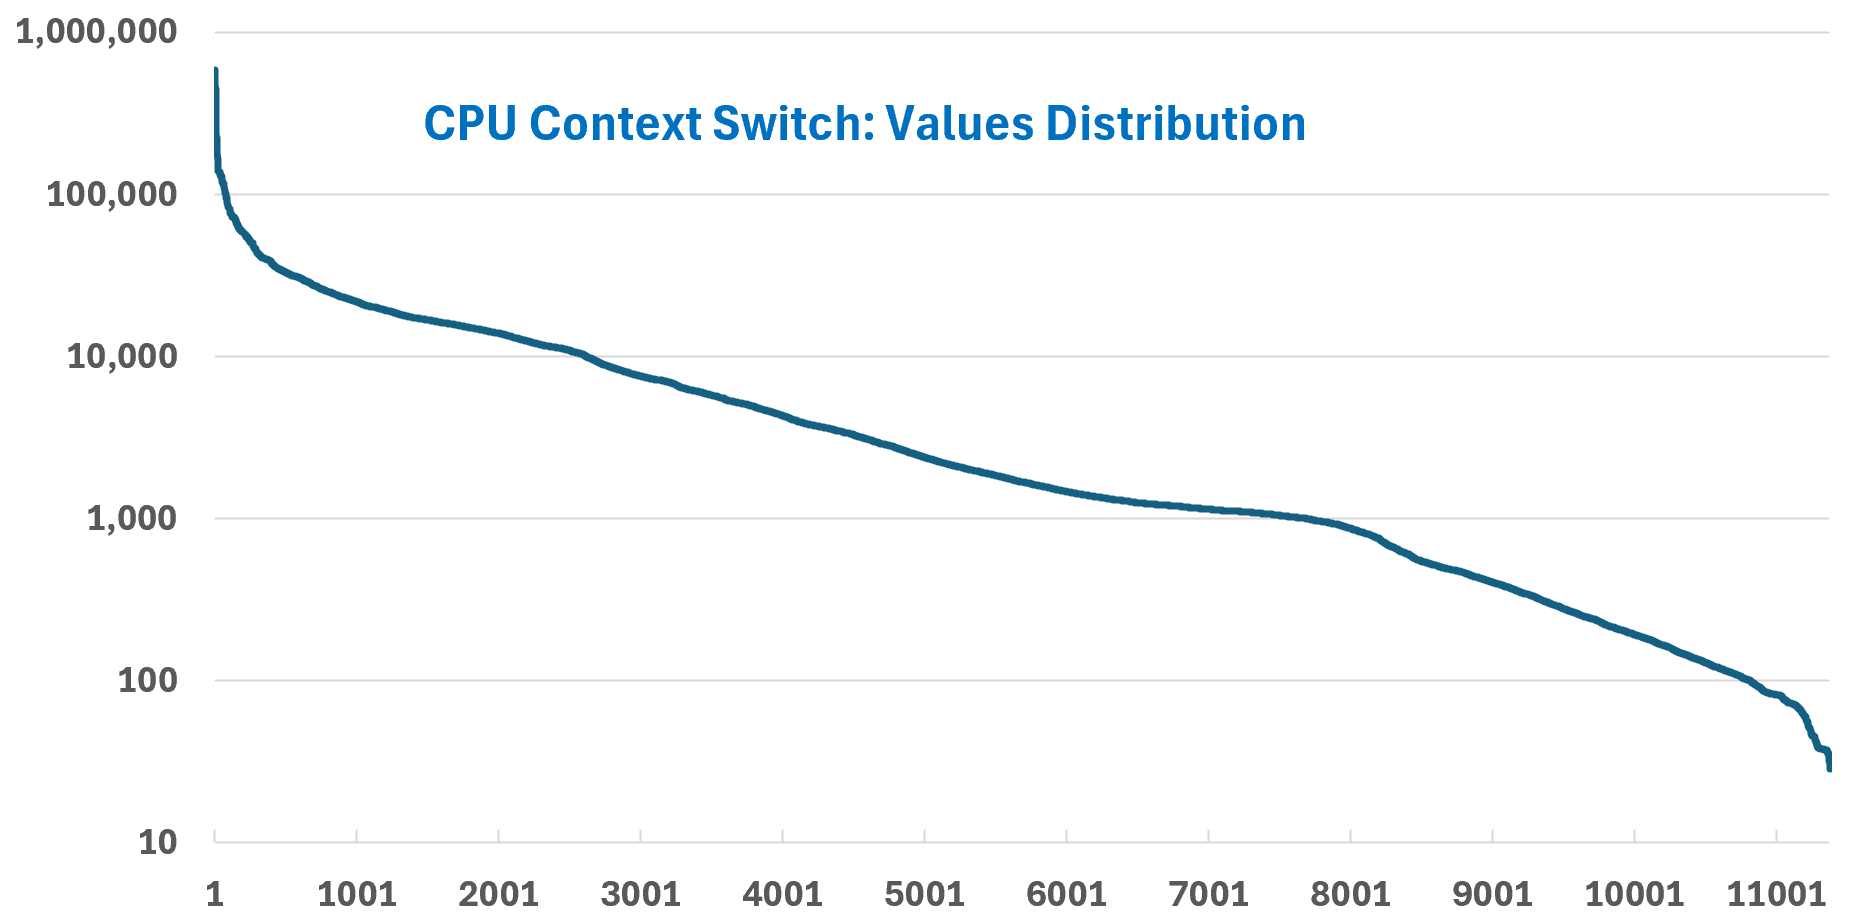
Majority of Guest OS spends well below 10K. You can see that the values between 0 – 10000 accounts for 80%.
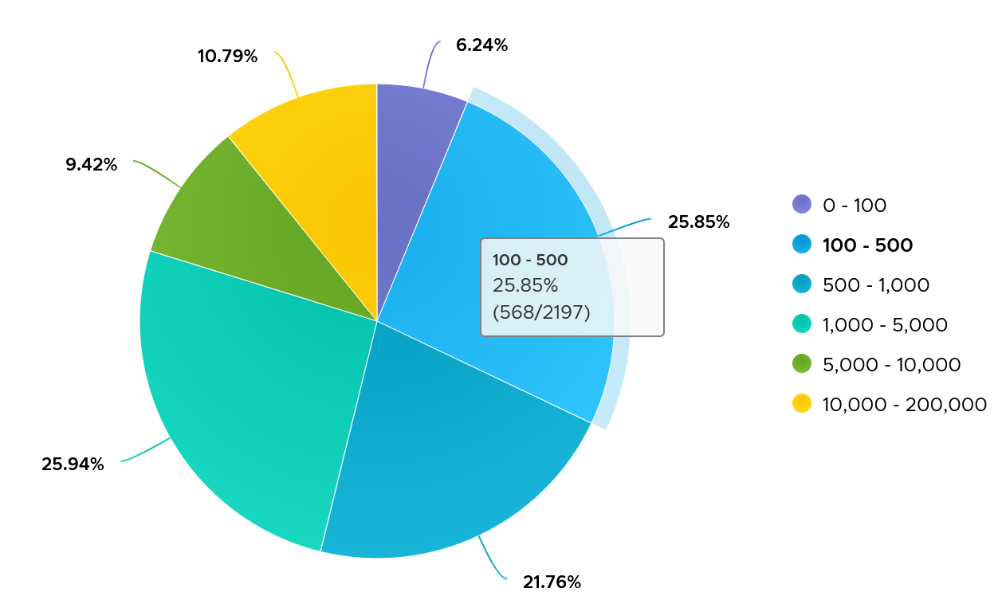
Now that you know the wide distribution, you can use buckets. Adjust the bucket size by grouping all the values above 10K as one bucket, and splitting 0 – 10K bucket into multiple buckets. You can see more than half has < 1000 CPU Context Switch Rate.
Thread Ping Pong
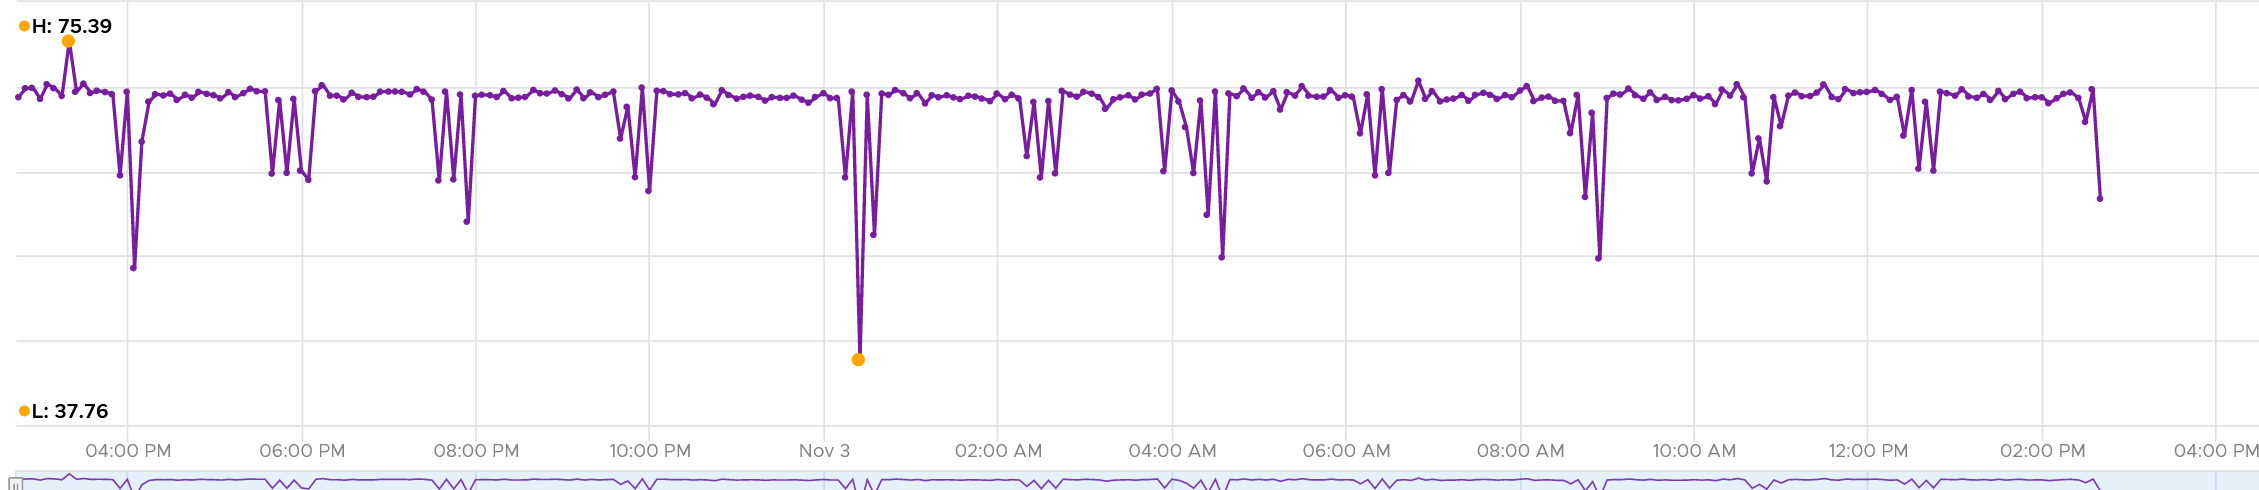
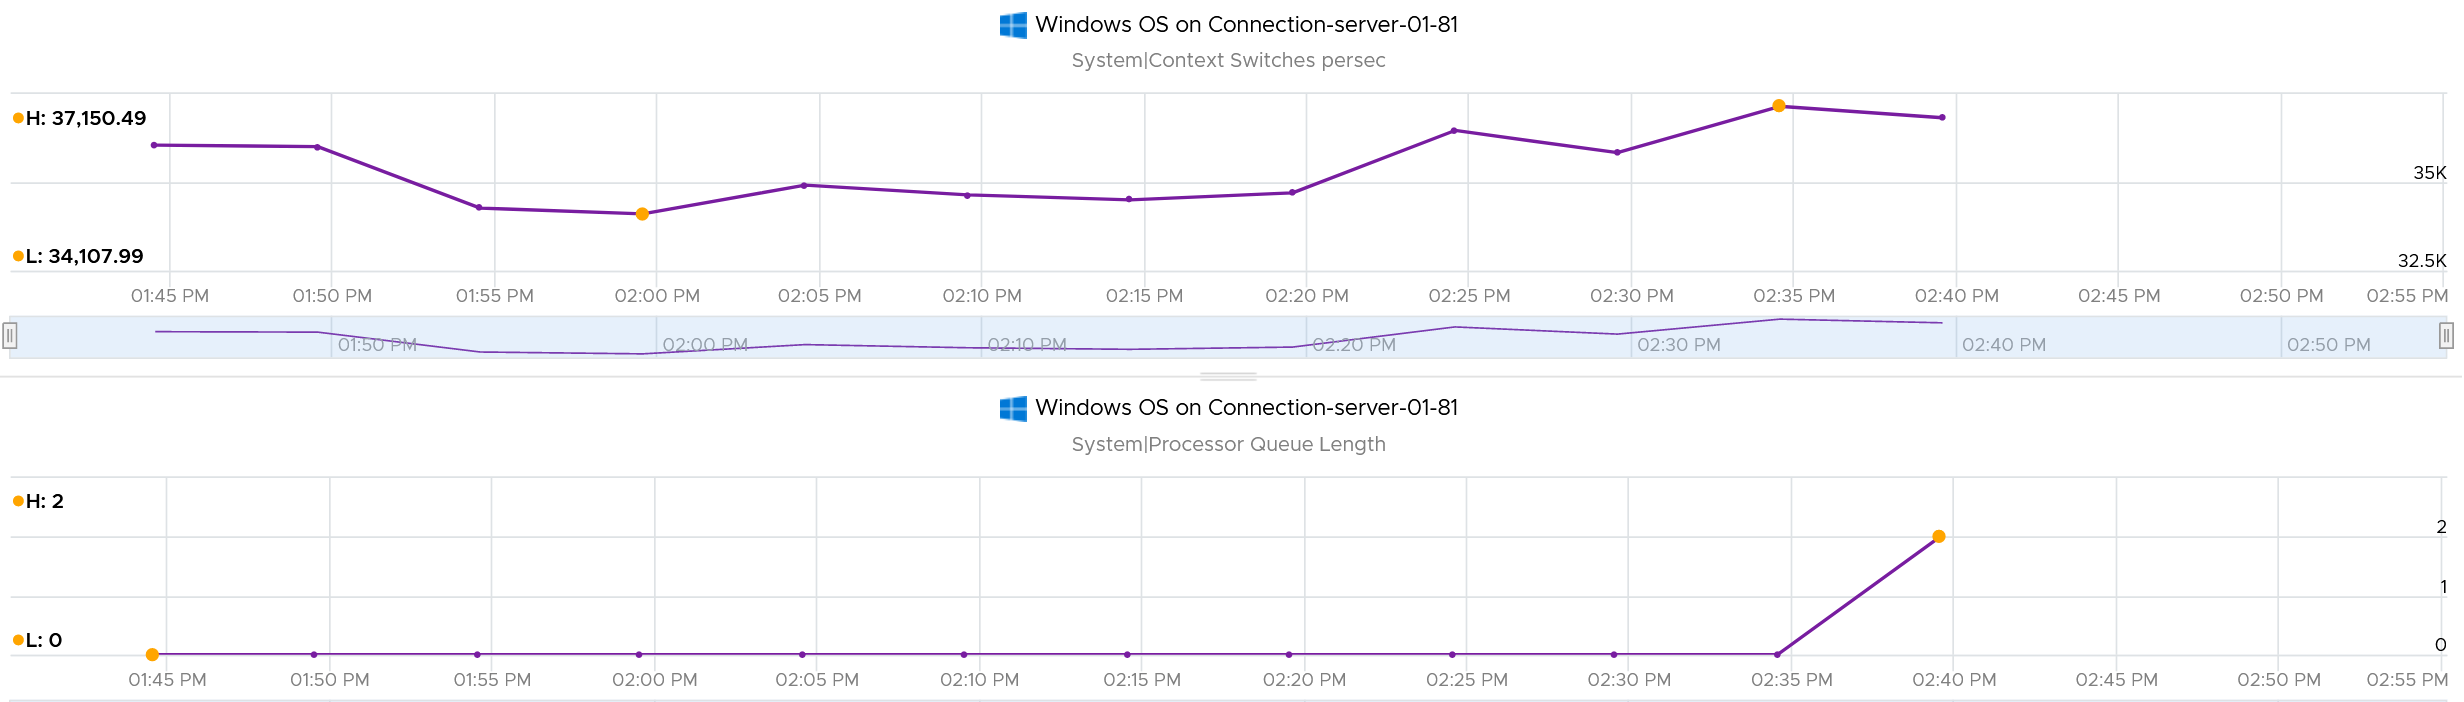
The following is a Windows Server 2019 DC edition VM with 10 vCPU. It’s basically idle, as you can see below.
But if we zoom into each vCPU, they are taking turn to be busy.
In the span of just 1 hour, the 10 vCPU inside Windows take turn.
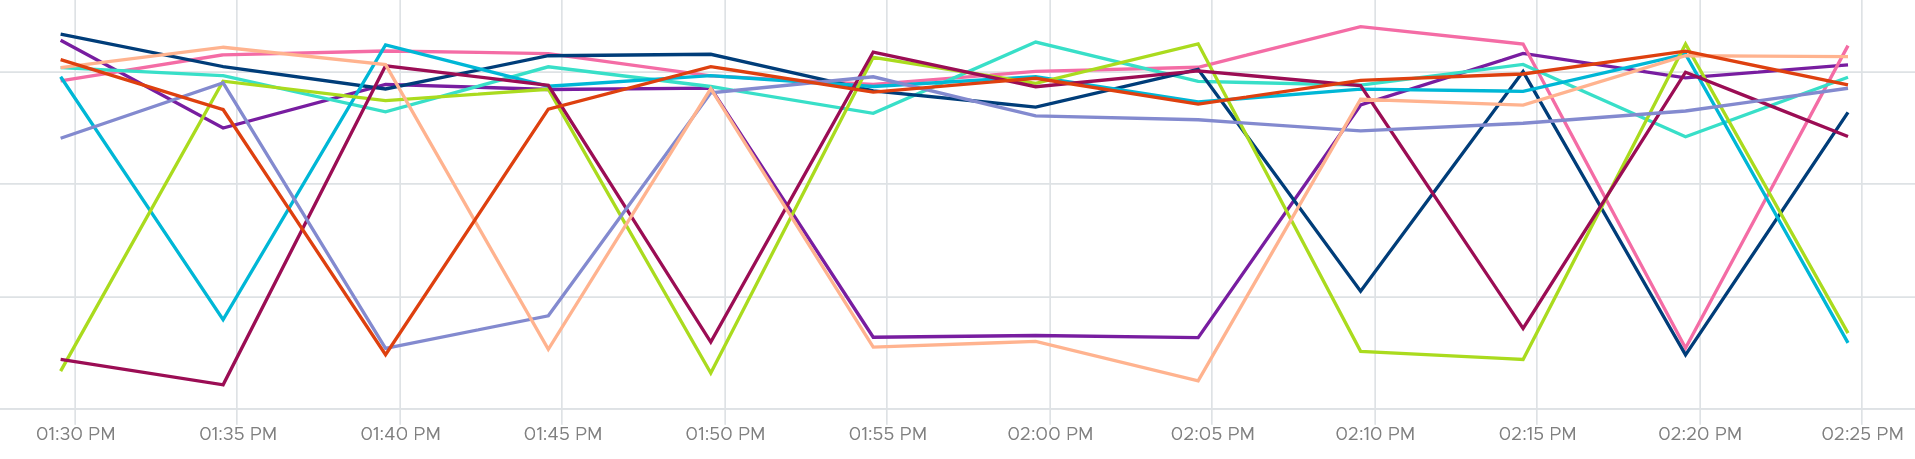
This is a bit illogical. Is this a process ping pong?
It is hard to tell
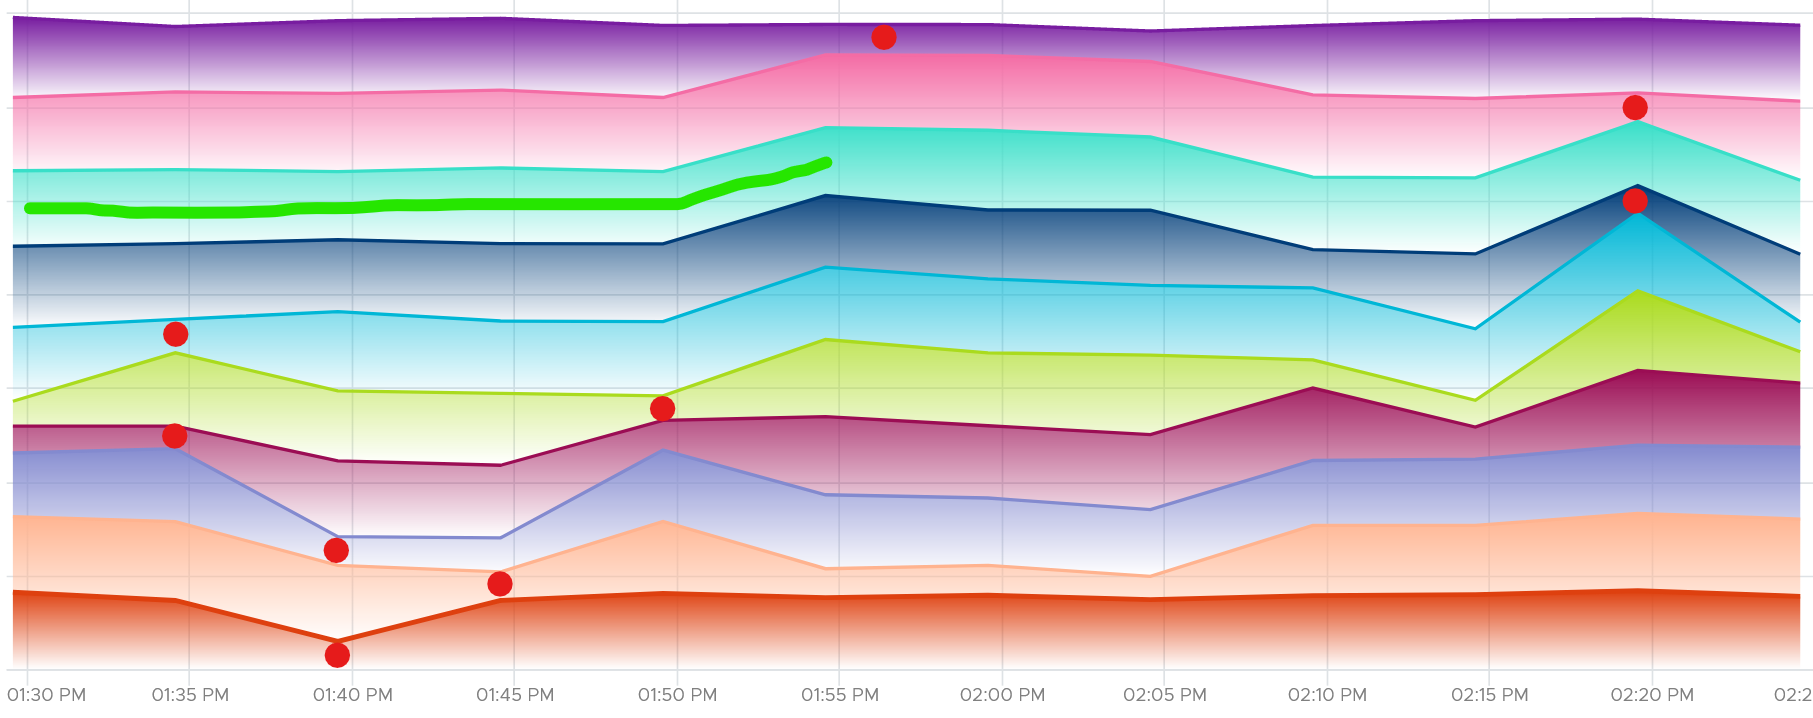
We can see them clearer if we stack them up. Notice they take turn, except the 3rd one from the top (I drew a green line on it). That one is actually fairly stable.
It is running Horizon Connection Server. It has around 118 – 125 processes, but much higher threads counts.
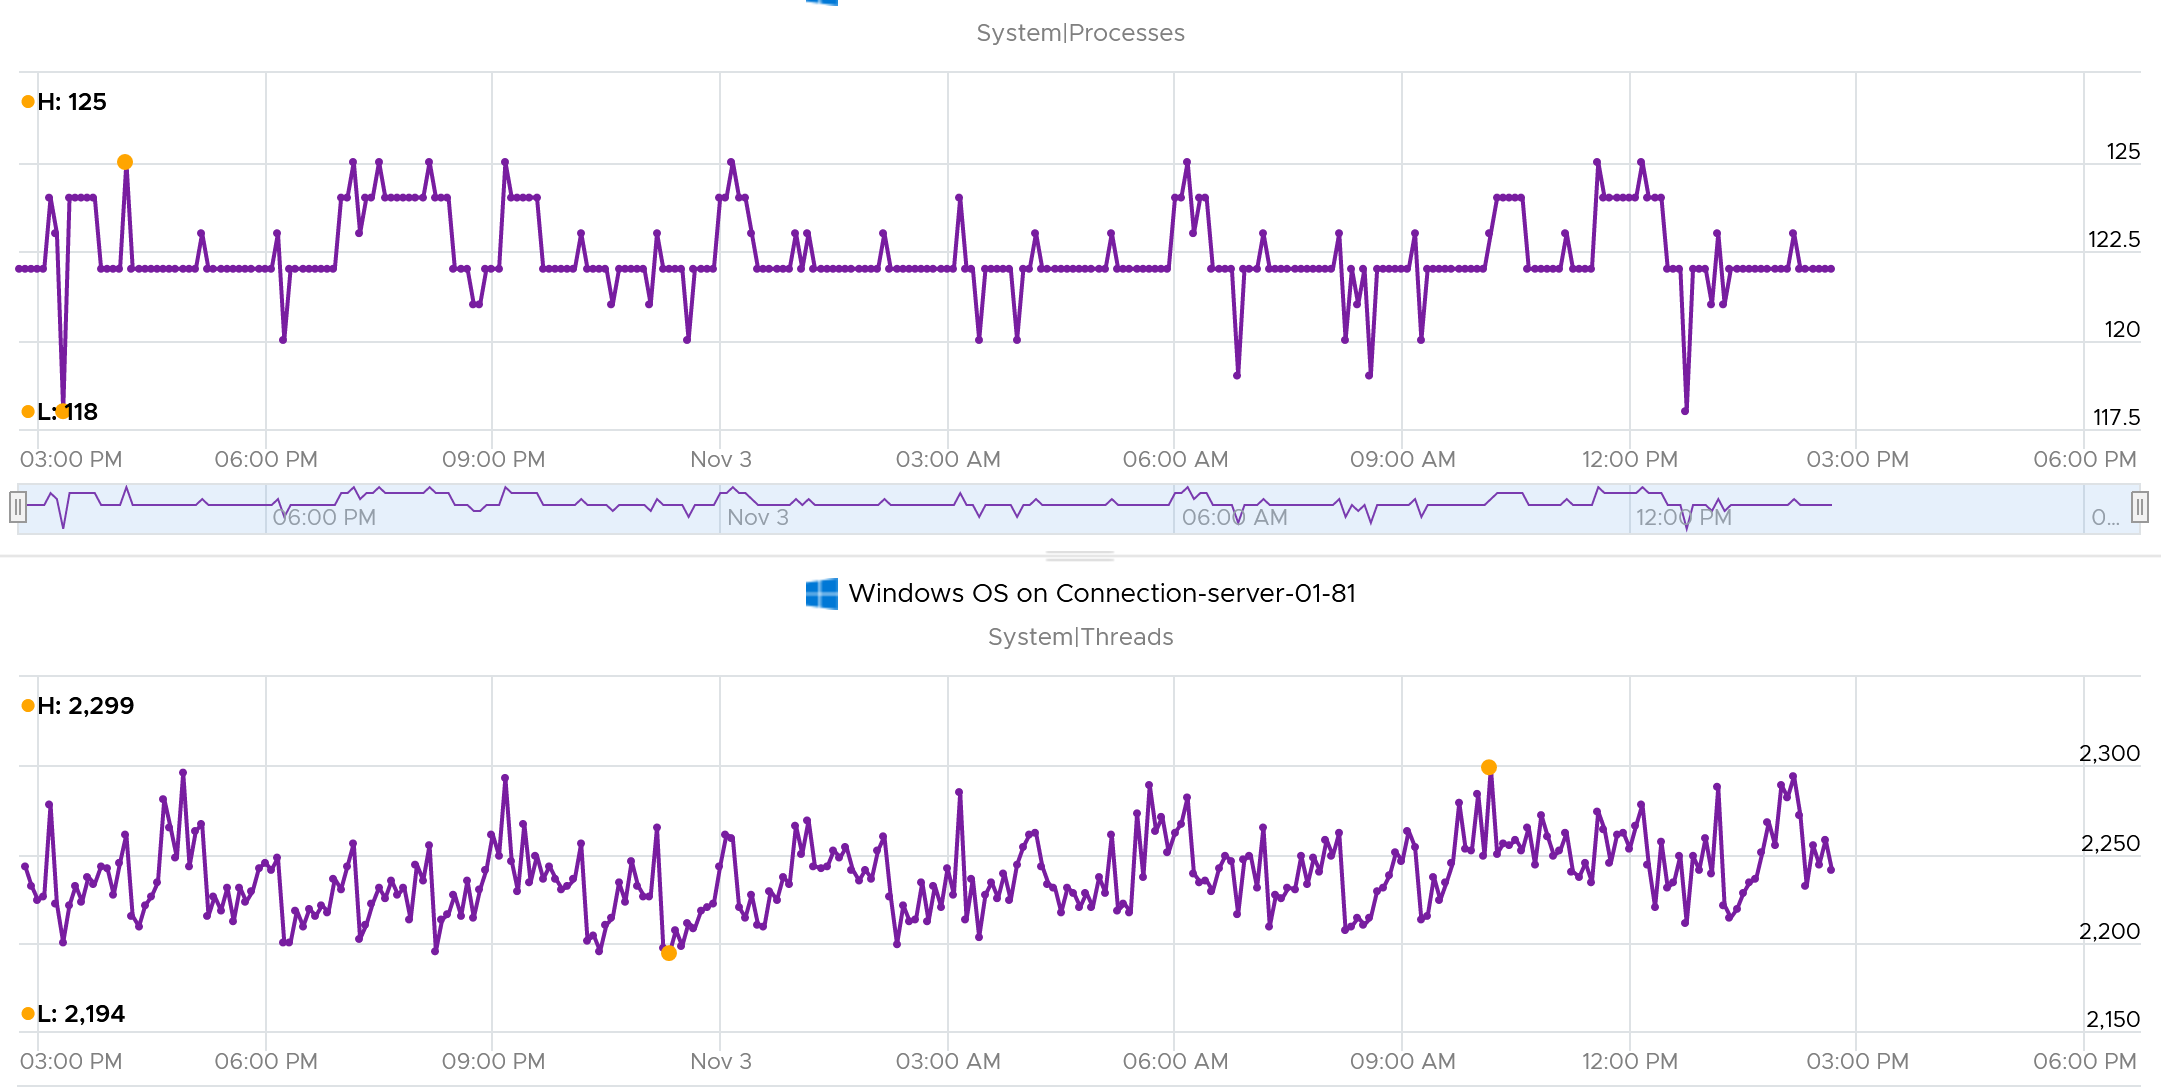
CPU Run Queue is very low, which is expected as the system is basically idle.
Context switches is fairly steady. The following screenshot shows it hovers between 34K and 37K switches per second. This is expected as it consistently run >2K threads on >100 processes on just 10 CPU. Each CPU does ~3.5K switches per second.
DPC Time
According to System Center wiki, the system calls are deferred as they are lower priority than standard interrupts. A high percentage of deferral means Windows was busy doing higher priority requests.
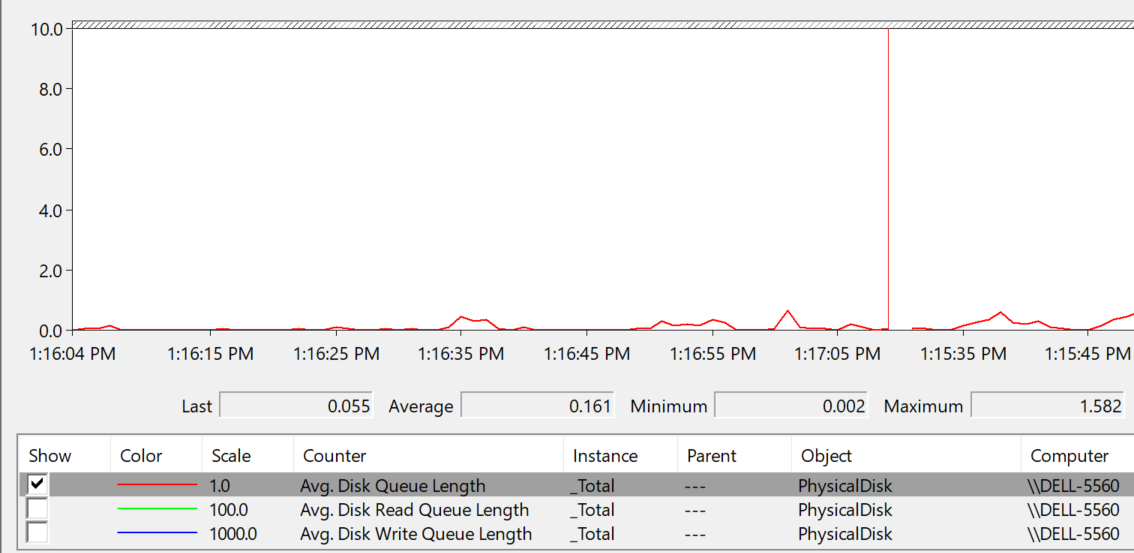
They can happen even during low CPU utilization if there is issue with driver or application. The following screenshot is taken on Performance Monitor in Windows 11 laptop which was not running high. Notice the DPC time for CPU 0 is consistently higher than CPU 15, indicating imbalance. It did exceed >5% briefly. My Dell laptop has 8 cores 16 threads.
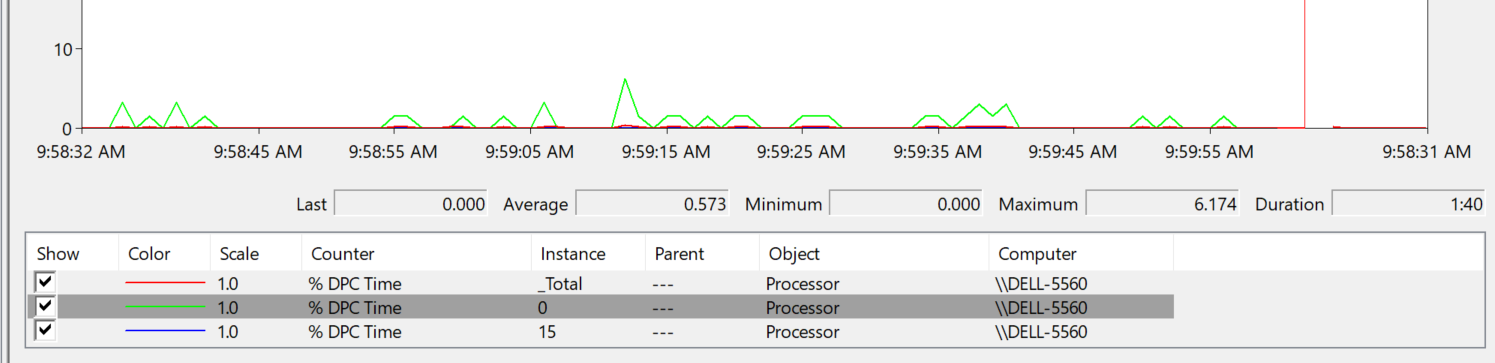
Set the graph scale to 1 for ease of reading, and change the axis scale accordingly.
Runaway Process
What do you see from the CPU charts below?
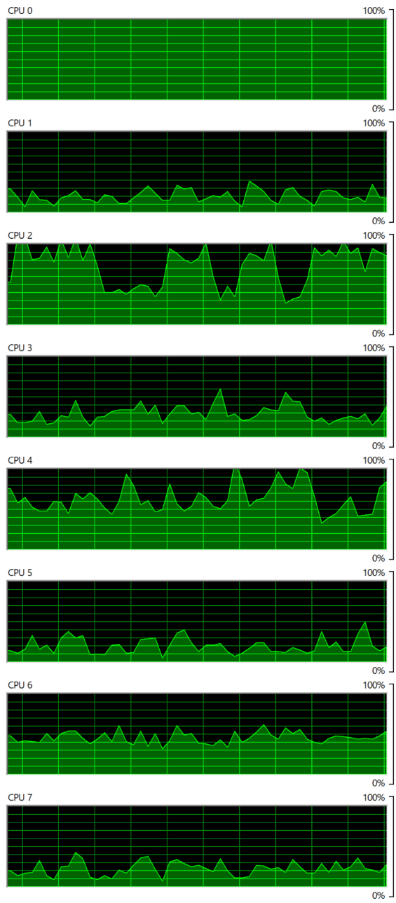 | There are 8 CPU as seen by Windows 10. Hint: look at the total picture, no need to see each in detail. That’s why I made the screenshot tiny. Yes, you’re right. CPU0 is running flat. The reason was one of Windows common service went into infinite loop. Ironically, this is the troubleshooting service (Diagnostic Policy Service) itself. So it’s chewing up CPU flat out non-stop. But since there are 7 other CPU, Windows overall is responsive. I could still do my work. A counter that tracks at entire Guest OS level will not capture it. You need to complement it with a counter that tracks the highest among its CPU. If this is flat out all the time, you likely have a runaway process. |
|---|
Usage | Utilization | Time
The 3 tools in Windows use different names to measure CPU consumption:
-
Performance Monitor uses the name Processor Time.
-
Task Manager uses the name CPU Utilization.
-
Resource Monitor uses the name CPU Usage.
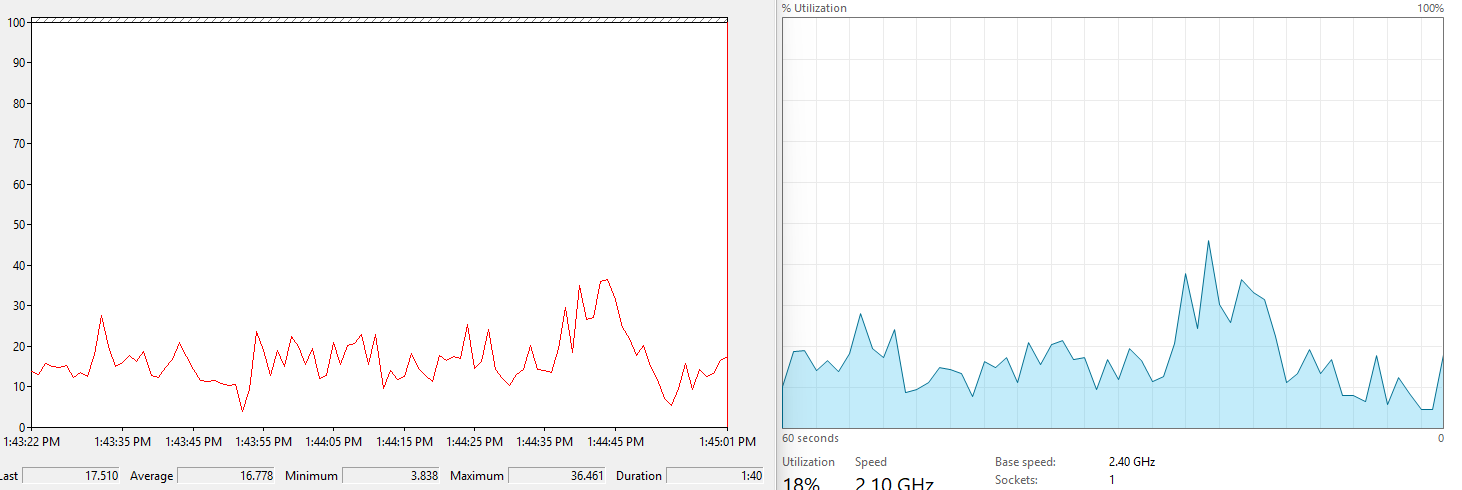
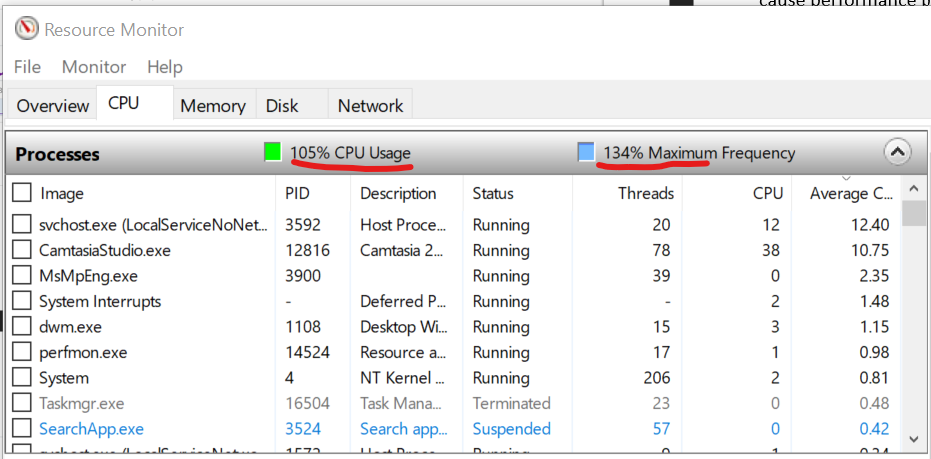
Looking at the values, they are not measuring the same thing. The following screenshot is a side-by-side comparison between Task Manager and Resource Monitor.
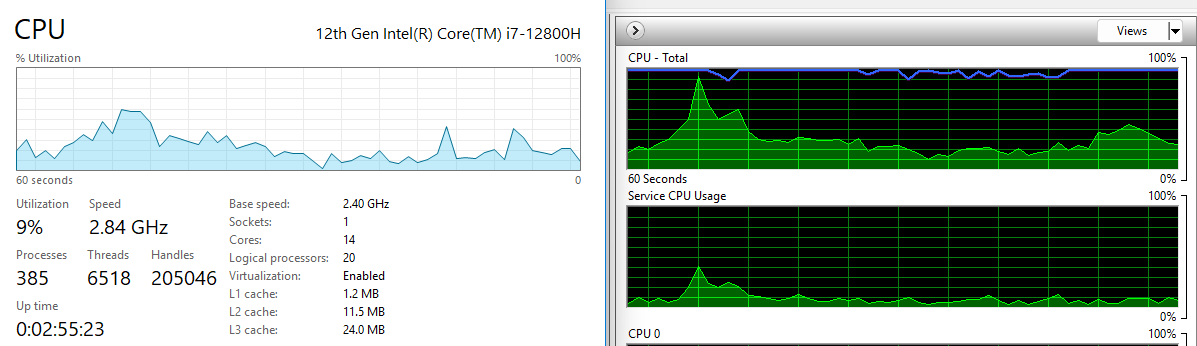
Let’s compare Performance Monitor and Task Manager:
CPU Usage in Windows is not aware of the underlying hypervisor hyper-threading. When Windows run a CPU at 100% flat, that CPU could be competing with another physical thread at ESXi level. In that case, what do you expect the value of VM CPU Usage will be, all else being equal?
62.5%.
Because that’s the hyper-threading effect.
What about VM CPU Demand? It will show 100% .
However, CPU Usage is affected by power management. Windows 8 and later will report CPU usage >100% in Task Manager and Performance Monitor when the CPU Frequency is higher than nominal speed. The reason for the change is the same with what we have covered so far, which is the need to distinguish amount of work being done. More here.
BTW, what does the Maximum Frequency mean?
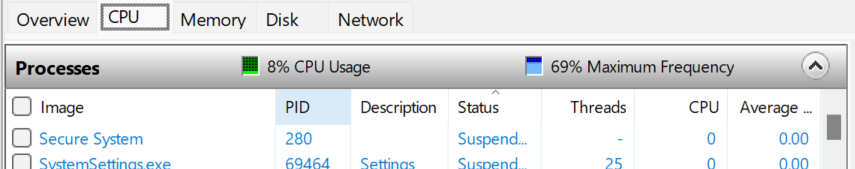
Let’s show an opposite scenario, where CPU Usage (%) is low.
The number means the speed it’s running relative to the nominal frequency. During low utilization, Windows will conserve power by lowering the speed.
In the first screenshot, since it’s running at 134% of the clock speed, the total time exceeded 105%, meaning there were time it did not run. Had it run all the time, it would report 134% instead.
In the first screenshot, it could be running more than 8% of the time. But since it’s only running at 69% of the speed, the CPU productive cycle completed is only 8%. The througput was degraded.
What happens to CPU Usage when VM is experiencing contention? VM Contention = Ready, Co-Stop, Overlap, Other Wait.
Time basically stops. So there is a gap in the system time of Windows. How does it deal with the gap? Does it ignore the gap, or artificially fills it with best guess values? I’m not sure. If you do let me know.
The above nature of CPU Usage brings an interesting question. Which VM counters can be used when you have no visibility into the Guest? Let’s do a comparison:
| Metric | Frequency Scaling | Hyperthreading | VM Contention |
|-----------------|:-----------------:|:--------------:|:-------------:|
| Guest CPU Usage | Yes | No | No |
| VM CPU Run | No | Yes | No |
| VM CPU Usage | Yes | Yes | No |
| VM CPU Demand | Yes | No | Yes |
If there is slowness but utilization is low, it’s worth checking if the utilization is coming from lower power state. This is important for application that requires high frequency (as opposed to just lots of light threads).
Windows provides the time the CPU spent on C1, C2 and C3 state. The following is taken from my laptop. Notice a dip when the total of C1 + C2 + C3 < 100%. That’s basically the time on C0.
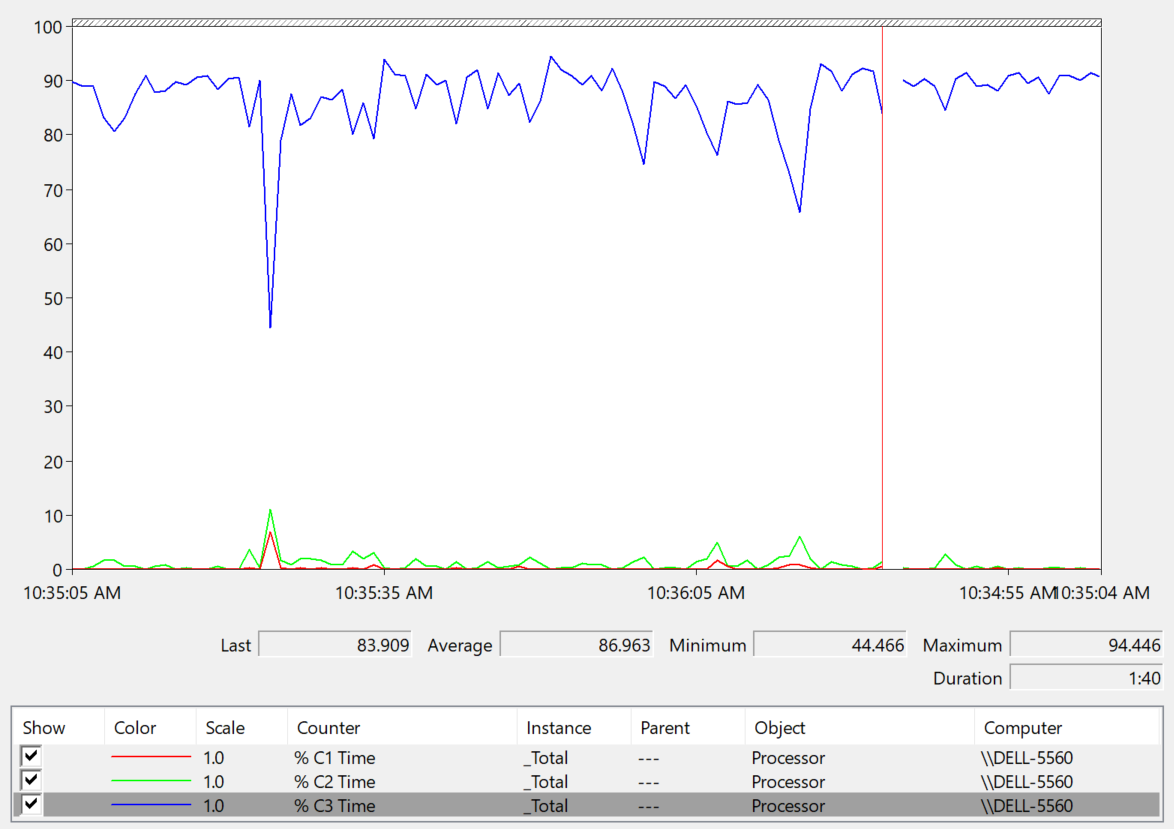
The Idle loop is typically executed on C3. Try plotting the Idle Time (%) and C3 Time (%), and they will be similar.
OS vs Process
CPU imbalance can happen in large VM.
Review the following chart carefully. It’s my physical desktop running Windows 10. The CPU has 1 socket 4 cores 8 threads, so Windows see 8 logical processors. You can see that Microsoft Word is not responding as its window is greyed out. The Task Manager confirms that by showing that none of the 3 documents are responding. Word is also consuming a very high power, as shown in the power usage column.
It became unresponsive because I turned on change tracking on a 500 page document and deleted hundreds of pages. It had to do a lot of processing and it did not like that. Unfortunately I wasn’t able to reproduce the issue after that.
At the operating system, Windows is responding well. I was able to close all other applications, and launched Task Manager and Snip programs. I suspect because Word does not consume all CPUs. So if we track at Windows level, we would not be aware that there is a problem. This is why process-level monitoring is important if you want to monitor the application. Specific to hang state, we should monitor the state and not simply the CPU consumption.
From the Windows task bar, other than Microsoft Word and Task Manager, there is no other applications running. Can you guess why the CPU utilization at Windows level is higher than the sum of its processes? Why Windows show 57% while Word shows 18.9%?
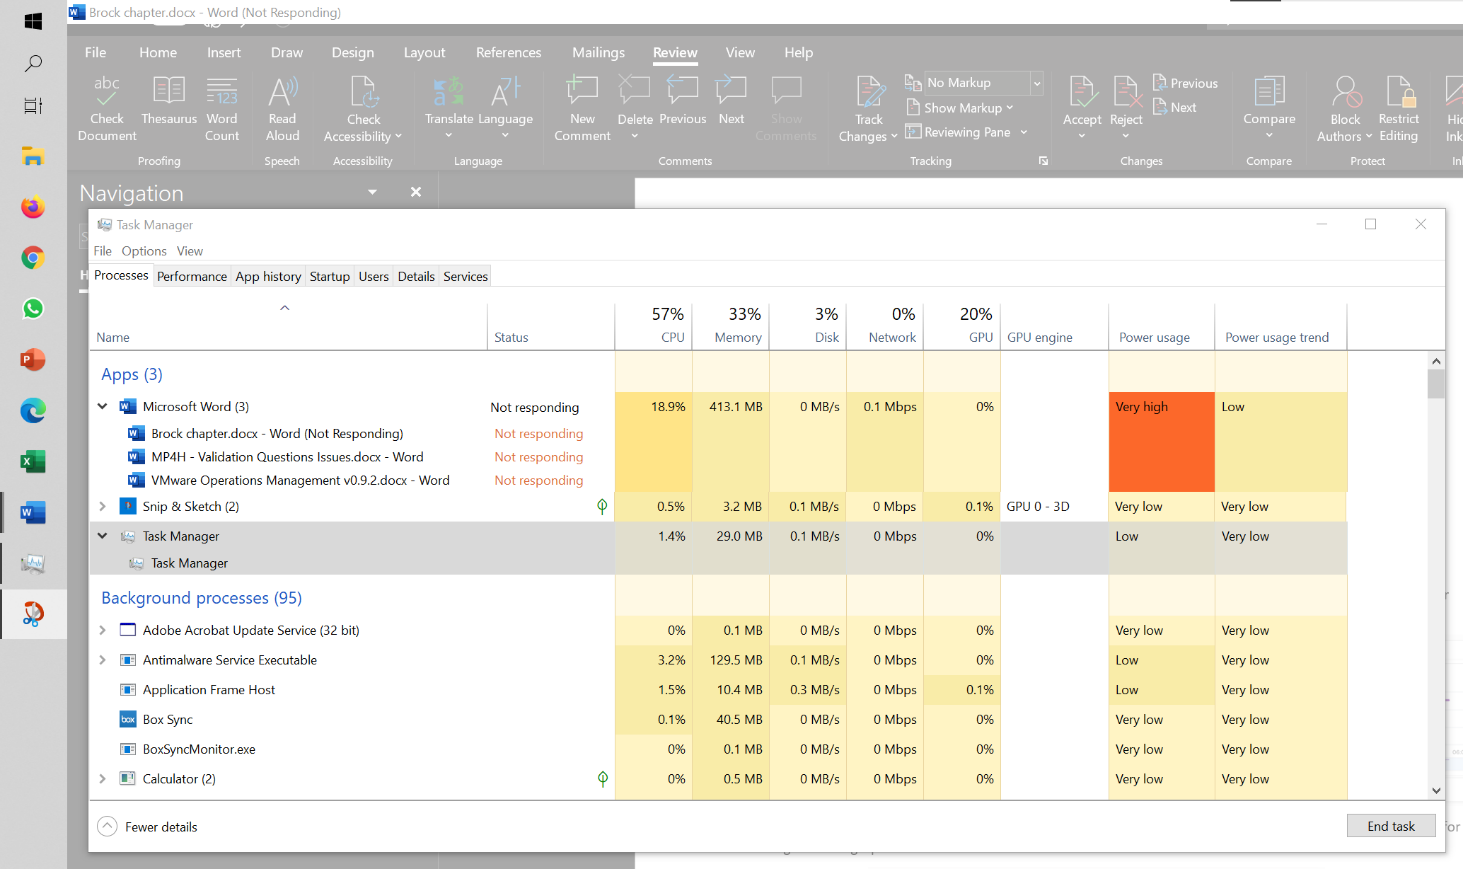
My guess is Turbo Boost. The CPU counter at individual process level does not account for it, while the counter at OS level does.
I left it for 15 minutes and nothing change. So it wasn’t that it needed more time to process the changes. I suspect it encountered a CPU lock, so the CPU where Word is running is running at 100%. Since Windows overall only reports 57%, it’s important to track the peak among Windows CPU. This is why VCF Operations provides the peak value among the VM vCPU.
Memory
Windows memory management is not something that is well documented. Ed Bott sums it this article by saying “Windows memory management is rocket science”. Like what Ed has experienced, there is conflicting information, including the ones from Microsoft. Mark Russinovich, cofounder of Winternals software, explains the situation in this TechNet post.
Windows Performance Monitor provides many metrics, some are shown below.
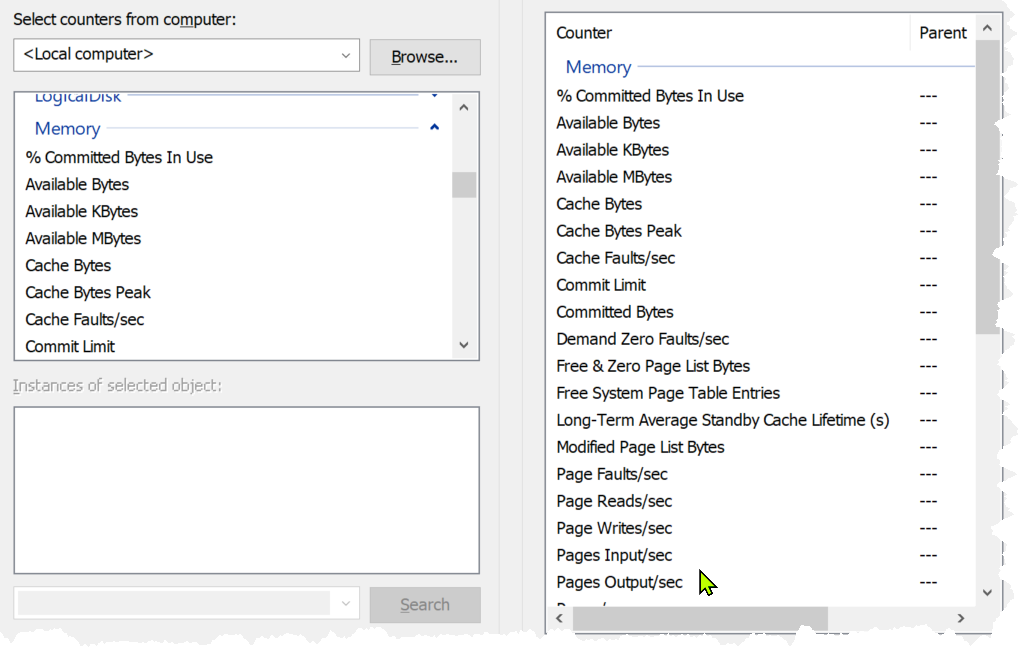
In formula, here is their definition:
-
Cached = Standby + Modified
-
Available = Standby + Free
Available means exactly what the word means. It is the amount of physical memory immediately available for use. Immediately means Windows does not need to copy the existing page before it can be reused.
It is easier to visualize it, so here it is:
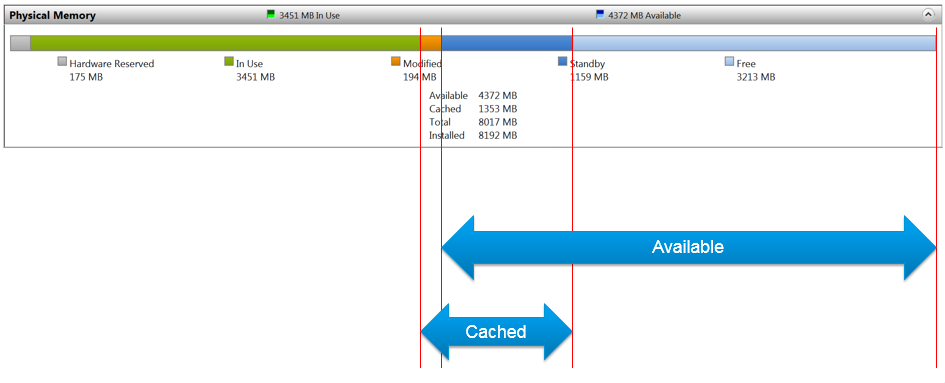
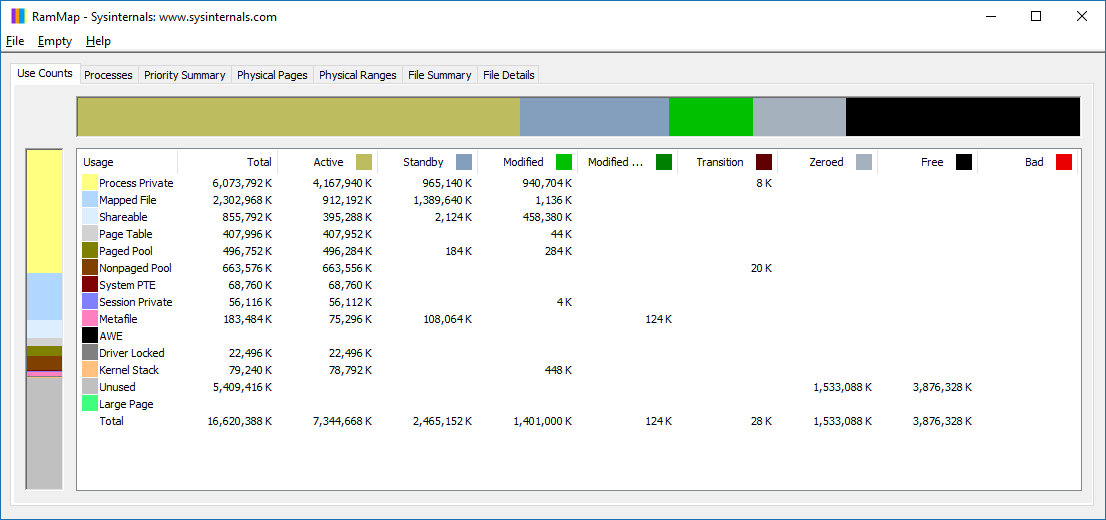
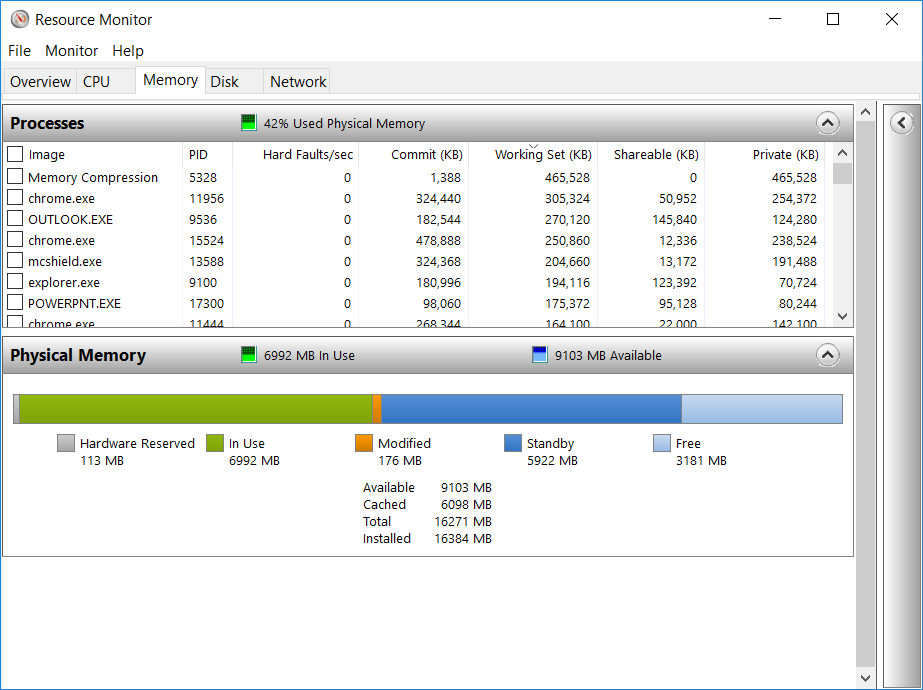
Microsoft SysInternal provides more detail breakdown. In addition to the above, it shows Transition and Zeroed.
In Use
This is the main counter used by Windows, as it’s featured prominently in Task Manager.
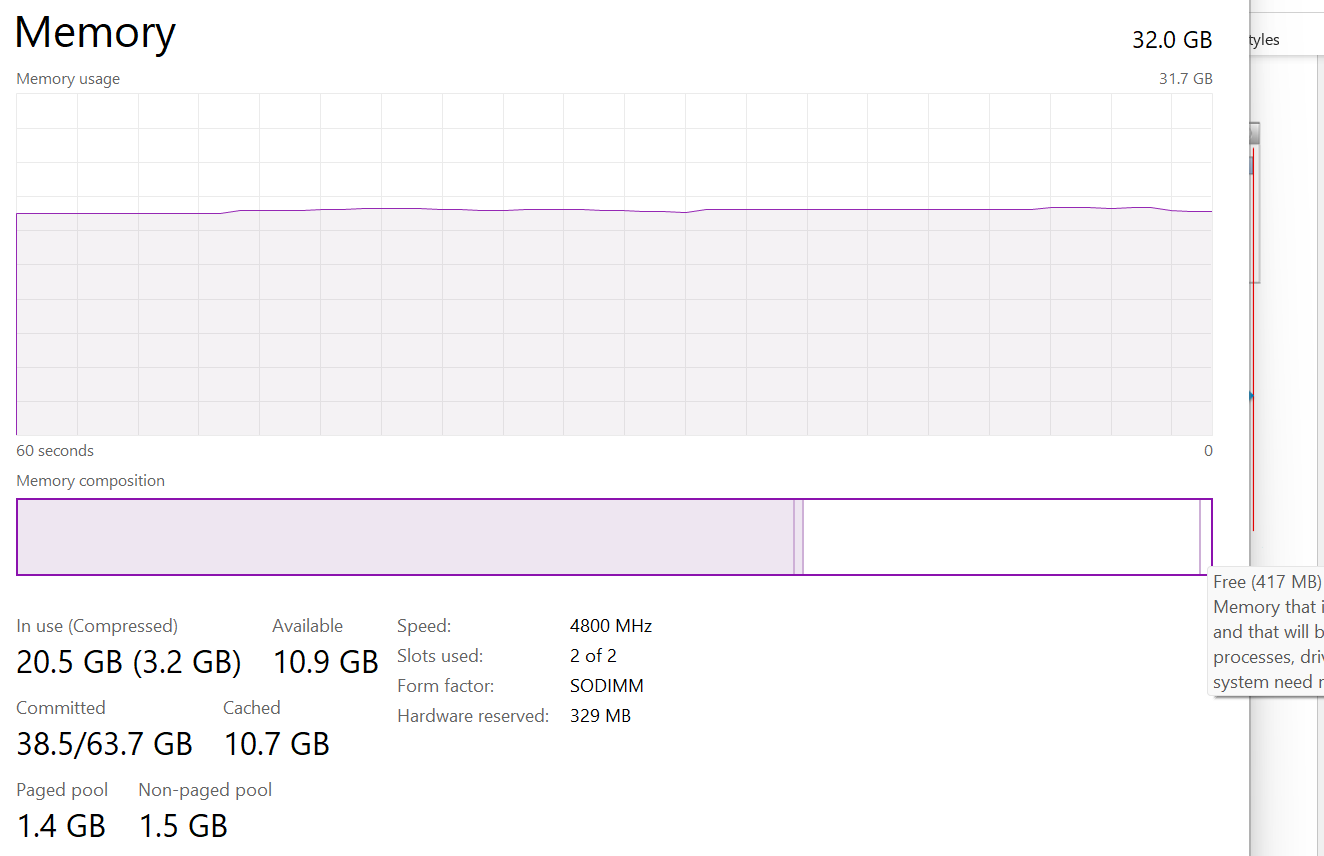
This is often thought as the minimum that Windows needs to operate. This is not true. If you notice on the preceding screenshot, it has compressed 457 MB of the 6.8 GB In Use pages, indicating they are not actively used. Windows compresses its in-use RAM, even though it has plenty of Free RAM available (8.9 GB available). This is a different behaviour to ESXi, which do not compress unless it’s running low on Free.
Look at the chart of Memory Usage above. It’s sustaining for the entire 60 seconds. We know this as the amount is too high to sustain for 60 seconds if they are truly active, let alone for hours.
Formula:
In use = Total – (Modified + Standby + Free)
A problem related to the In Use counter is memory leak. Essentially, the application or process does not release pages that it no longer needs, so over time it accumulates. This is hard to detect as the amount varies by application. The process will continue growing until the OS runs out of memory.
Take note this is a new metric in VCF Operations 8.6. We call it Used Memory. You’re welcome.
Modified
Page that was modified but no longer used, hence it’s available for other usage but requires to be saved to disk first. It’s not counted as part of Available, but counted as part of Cache.
OS does not immediately write all inactive pages to disk, especially if the disk is on power saving mode. It will consolidate these pages and write them in one shot, minimizing IO to the disk. In the case, of SSD disk, it can shorten the life span as SSD has physical limits on the number of writes.
Standby
Windows has 3 levels of standby. As reported by VMware Tools, their names are:
-
Standby Core
-
Standby Normal
-
Standby Reserve
Different applications use the memory differently, resulting in different behaviour of the metrics. As a result, determining what Windows actually uses is difficult.
The Standby Normal counter can be fluctuating wildly, resulting in a wide difference if it’s included in rightsizing. The following VM is a Microsoft Exchange 2013 server mailbox utility.
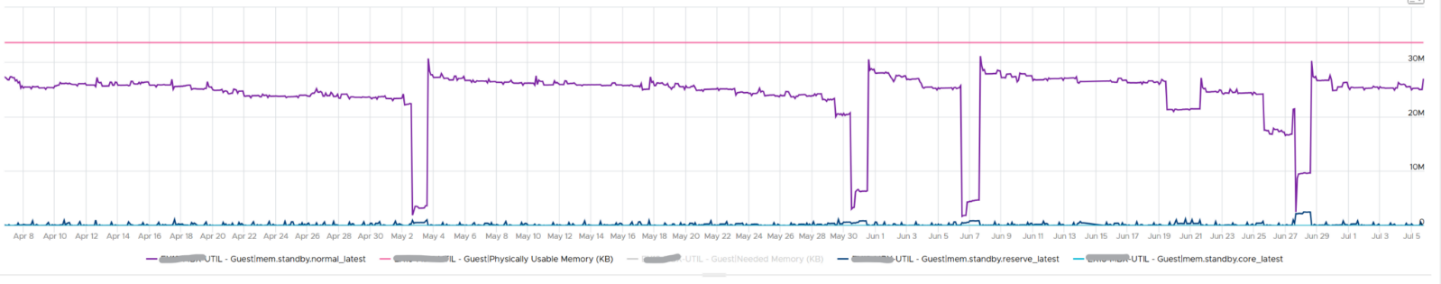
Notice the Standby Normal fluctuates wildly, reaching as high at 90%. The other 2 cache remains constantly negligible. The chart above is based on >26000 samples, so there is plenty of chance for each 3 metrics to fluctuate.
Now let’s look at another example. This is a Windows Server 2016. I think it was running Business Intelligence software Tableau.
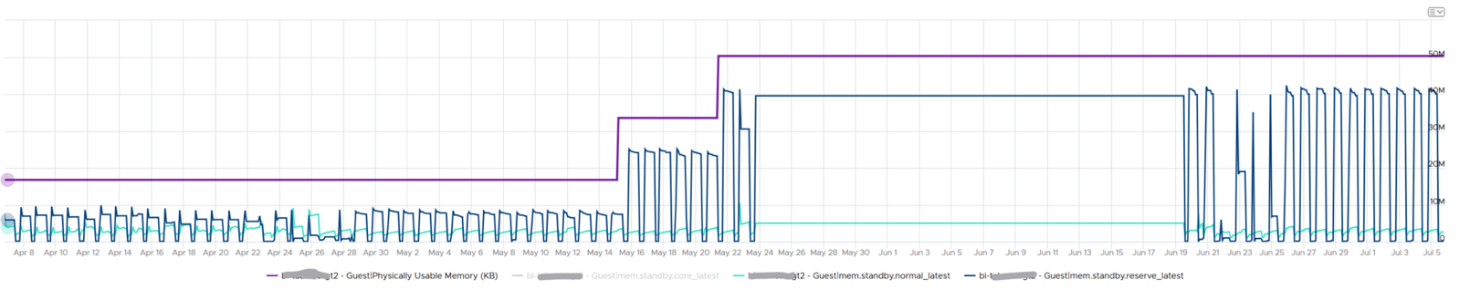
Notice the VM usable memory was increased 2x in the last 3 months. Standby Normal hardly move, but Standby Reserve took advantage of the increments. It simply went up accordingly, although again it’s fluctuating wildly.
Cache
Cache is an integral part of memory management, as the more you cache, the lower your chance of hitting a cache miss. This makes sense. RAM is much faster than Disk, so if you have it, why not use it? Remember when Windows XP introduced pre-fetch, and subsequently Windows SuperFetch? It’s a clue that memory management is a complex topic. There are many techniques involved. Unfortunately, this is simplified in the UI. All you see is something like this:
Free
As the name implies, this is a block of pages that is immediately available for usage. This excludes the cached memory. A low free memory does not mean a problem if the Standby value is high. This number can reach below 100 MB, and even touch 0 MB momentarily. It’s fine so long there is plenty of cache. I’d generally keep this number > 500 MB for server VM and >100 MB for VDI VM. I set a lower number for VDI because they add up. If you have 10K users, that’s 1 TB of RAM.
When Windows or Linux frees up a memory page, it normally just updates its list of free memory; it does not release it. This list is not exposed to the hypervisor, and so the physical page remains claimed by the VM. This is why the Consumed counter in vCenter remains high when the Active counter has long dropped. Because the hypervisor has no visibility into the Guest OS, you may need to deploy an agent to get visibility into your application. You should monitor both at the Guest OS level (for example, Windows and Red Hat) and at the application level (for example, MS SQL Server and Oracle). Check whether there is excessive paging or the Guest OS experiences a hard page fault. For Windows, you can use tools such as pfmon, a page fault monitor.
This is one the 3 major metrics for capacity monitoring. The other 2 metrics are Page-in Rate and Commit Ratio. These 3 are not contention metrics, they are utilization metrics. Bad values can contribute to bad performance, but they can’t measure the severity of the performance. Windows and Linux do not have a counter that measures how long or how often a CPU waits for memory.
In Windows, this is the Free Memory counter. This excludes the cached memory. If this number drops to a low number, Windows is running out of Free RAM. While that number varies per application and use case, generally keep this number > 500 MB for server VM and >100 MB for VDI VM. The reason you should set a lower number for VDI because they add up quickly. If you have 10K users, that’s 1 TB of RAM.
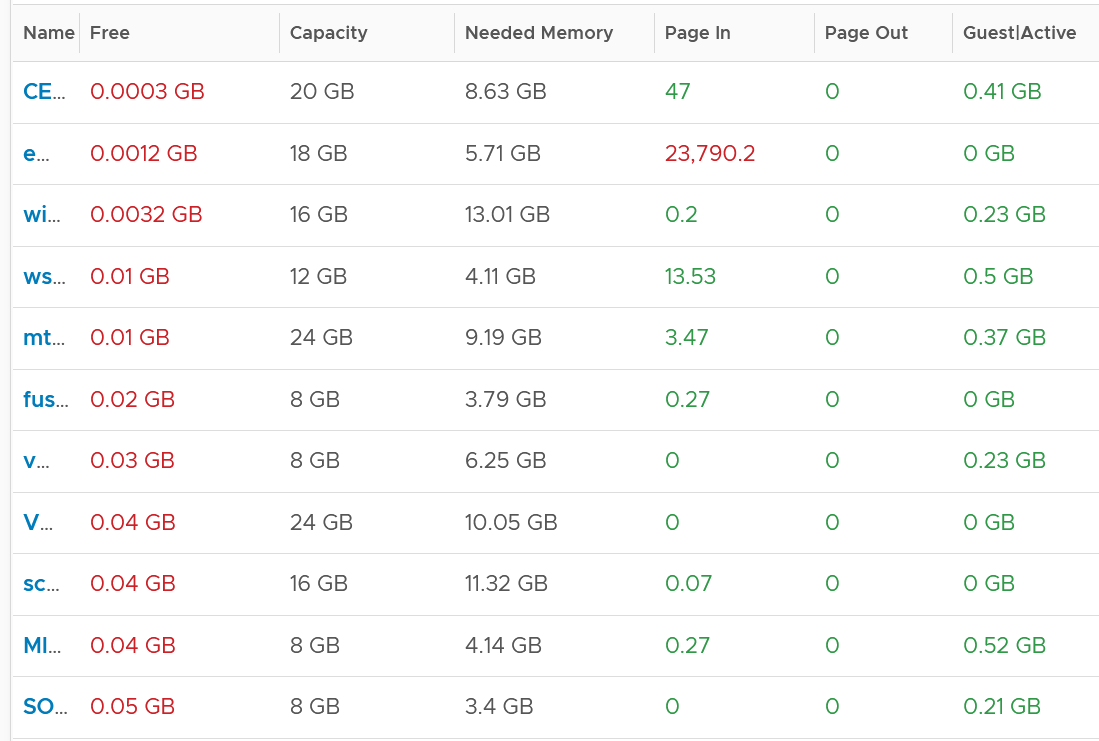
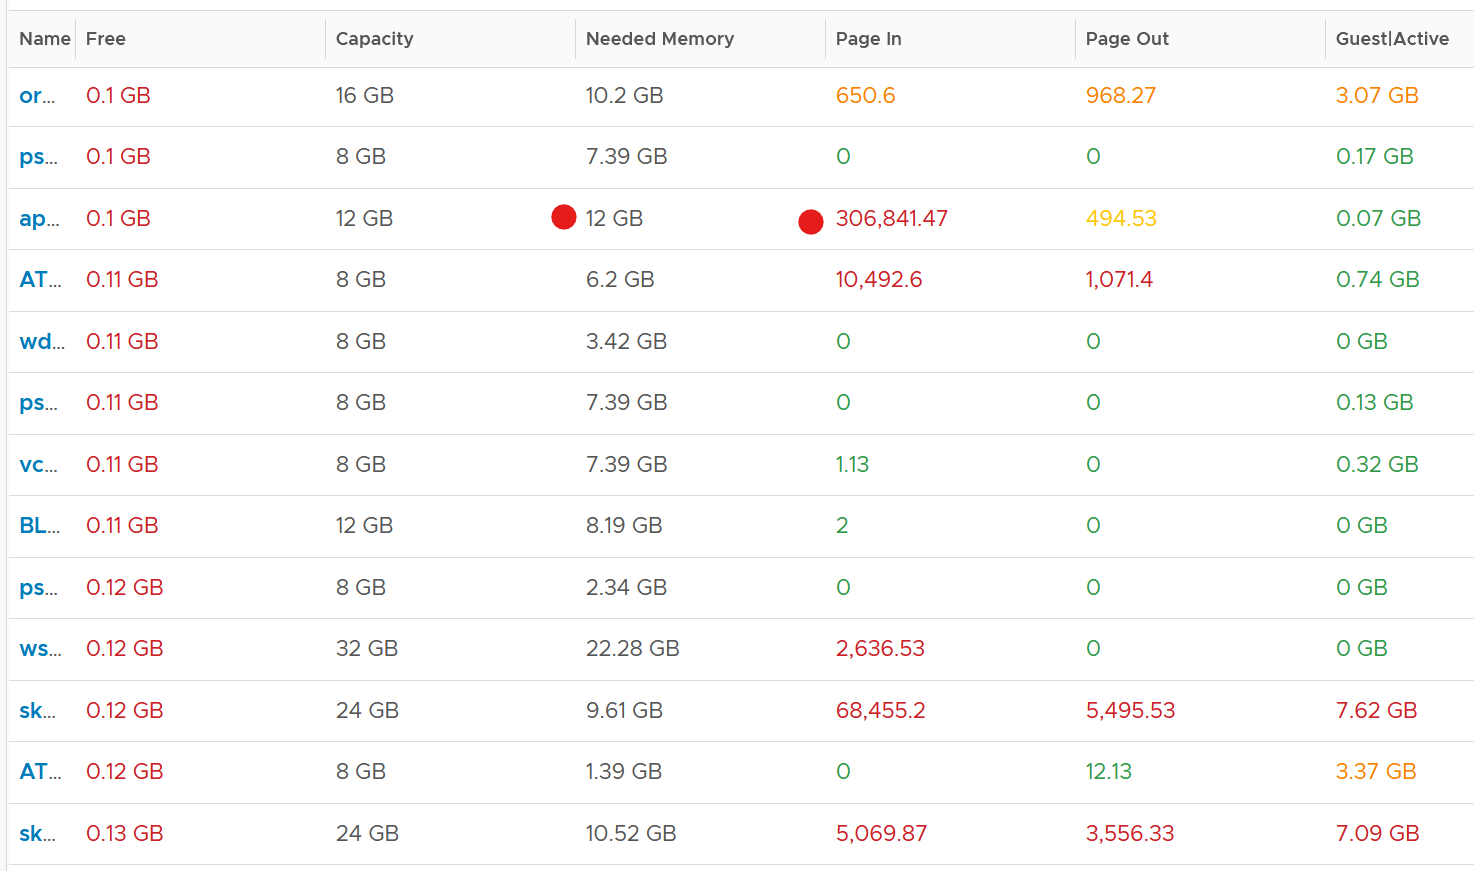
It’s okay for this counter to be low, so long other memory metrics are fine. The following table shows VMs with near 0 free memory. Notice none of them are needing more memory. This is the perfect situation as there is no wastage.
Page File
Memory paging is an integral part of Guest OS Memory Management. OS begins using it even though it still has plenty of physical memory. It uses both physical memory and virtual memory at the same time. Microsoft recommends that you do not delete or disable the page file. See this for reference.
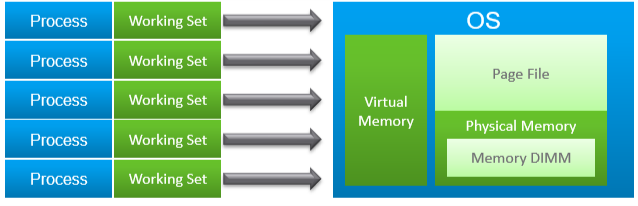
As shown on the diagram, processes see virtual memory, not physical memory. Guest OS presents this as system API to processes. The virtual memory is backed by the page file and physical memory. Guest OS shields the physical memory and hardware. Paging is an operation of reading/writing from the page file into the physical memory, not from physical disk into the page file.
Let Windows manages the pagefile size. This is the default setting, so you likely have it already. By default, windows sets the pagefile size to the same size with the physical memory. So if the VM has 8 GB of RAM, the pagefile is an 8 GB file. Anything above 8 GB indicates that Windows is under memory pressure.
The VM metric Guest \ Swap Space Remaining tracks the amount of swap space that's free.
The size of Page File is not a perfect indicator of the RAM usage, because they contain pages that are never demanded by the application. Windows does SuperFetch, where it predicts what pages will be used and prefetch them in advance. Some of these pages are never demanded by the application. Couple with the nature that Guest OS treats RAM as cache, including the page file will result in oversized recommendation. Paging rate is more realistic as it only considers the recent time period (300 seconds in VCF Operations case)
A page would be used as cache if it was paged out at some point due to memory pressure and it hasn’t been needed since. The OS will reuse that page as cache. That means that at some point the OS was constrained on memory enough to force the page out to happen.
A page that was paged out earlier, has to be brought back first before it can be used. This creates performance issue as the application is waiting longer, as disk is much slower than RAM.
There are 2 types of page operations:
-
Page In. This is a potential indicator for performance.
-
Page-out. This is a potential indicator for capacity.
While Paging impacts performance, the correlation between the paging metrics and performance varies per application. You can’t set a threshold and use it to monitor different applications or VM. The reason is paging is not always used when Guest OS runs out of memory. There are a few reasons why paging may not correlate to memory performance:
-
Application binary. The initial loading causes a page-in. Nobody will feel the performance impact as it’s not even serving anyone.
-
Memory mapped files. This is essentially a file that has a mapping to memory. Processes use this to exchange data. It also allows the process to access a very large file (think of database) without having to load the entire database into memory.
-
Proactive pre-fetch. It predicts the usage of memory and pre-emptively reads the page and bring it in. This is no different to disk where the storage array will read subsequent blocks even though it’s not being asked. This especially happens when a large application starts. Page-in will go up even though there is no memory pressure (page out is low or 0).
-
Windows performs memory capacity optimization in the background. It will move idle processes out into the page file.
If you see both Page-in and Page-out having high value, and the disk queue is also high, there is a good chance it’s memory performance issue.
The rate pages that are being brought in and out can reveal memory performance abnormalities. A sudden change, or one that has sustained over time, can indicate page faults. Page faults indicate pages aren’t readily available and must be brought in. If a page fault occurs too frequently it can impact application performance. While there is no concrete guidance, as it varies by application, you can judge by comparing to its past behaviour and its absolute amount.
Operating Systems typically use 4KB or 2MB page sizes. Larger page size will result in more cache, which translates into more memory required.
The counter %pagefile tracks how much of the pagefile is used, meaning the value 100% indicate the pagefile is fully utilized. While the lower the number the better, there is no universal guidance. If you know, let me know!
Reference: this is an old article as it covers 32 bit Windows. If you find a newer one, kindly let me know.
Guest OS Paging metrics
There are 2 metrics. Page-in and Page-out.
The unit is in number of pages, not MB. It's not possible to convert due to mix use of Large Page (2 MB) and Page (4 KB). A process can have concurrent mixed usage of large and non-large page in Windows. The page size isn’t a system-wide setting that all processes use. The same is likely true for Linux Huge Pages.
The page-in rate metric tracks the rate OS brings memory back from disk to DIMM per second. Another word, the rate of reads going through paging/cache system. It includes not just swap file I/O, but cacheable reads as well (so it’s double pages/s).
Page Out is the opposite of the above process. It is not as important as Page In. Just because a block of memory is moved to disk that does not mean the application experiences memory problem. In many cases, the page that was moved out is the idle page. Windows does not page out any Large Pages.
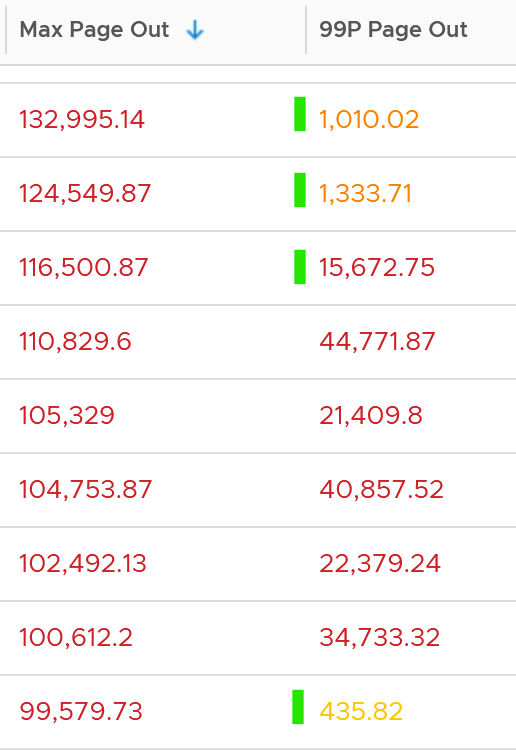
The following shows the page out value at 99th percentile in the last 4 months. What do you observe?
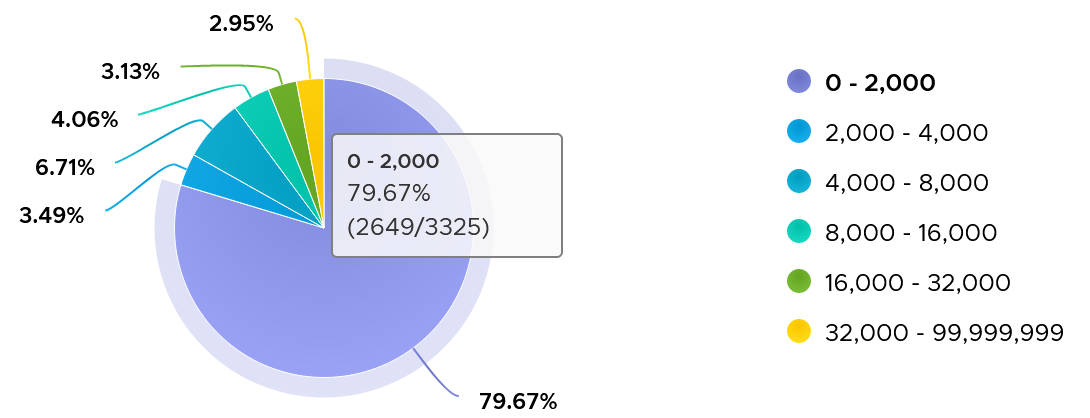
There are 3325 VM in the above chart. In the last 4 months, 97% of them have page-out rate of less than 32000 pages, on a 5-minute average basis.
How about the remaining 3%?
Surprisingly, a few of them can be well 500000, indicating there is a wide range. So majority of VMs do not page out, but those that do, they do it excessively.
The block size is likely 4 KB. Some applications like Java and databases use 2 MB pages. Using 8 KB as the average, 10000 pages per second sustained over 5 minutes means 80000 KB x 300 = 24 GB worth of data.
You can profile your environment to see which VMs are experiencing high paging. Create a view with the following 6 columns
-
Highest Page-In. Color code it with 1000, 10000, and 100000 as the thresholds. That means red is 10x orange, which in turn is 10x yellow.
-
Page-In value at 99th percentile. Same threshold as above.
-
Highest Page-Out. Same threshold as above.
-
Page-Out value at 99th percentile. Same threshold as above.
-
Sum of Page-In
-
Sum of Page-Out
Set the dates to the period you are interested, but make it at least 1 week, preferably 3 months. There 2016 data points in a week, so the 99th percentile ignores the highest 20 datapoints.
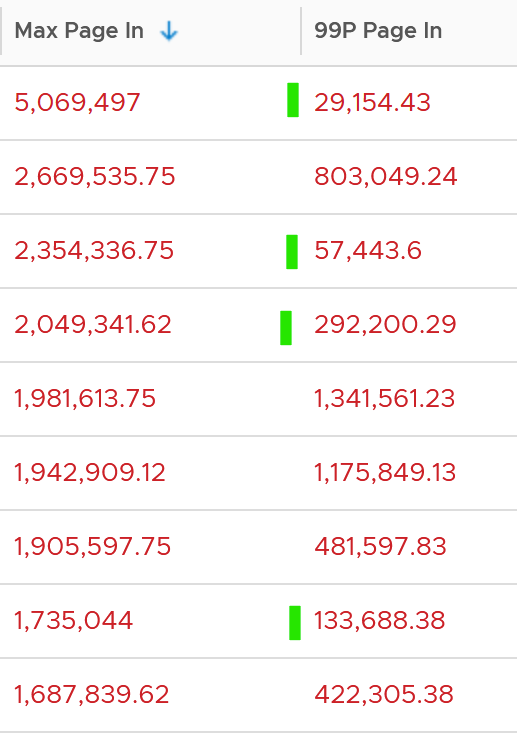
In the following example, I used 4 months. I listed the top VMs in terms, sorted by the highest page-in. What observation do you see?
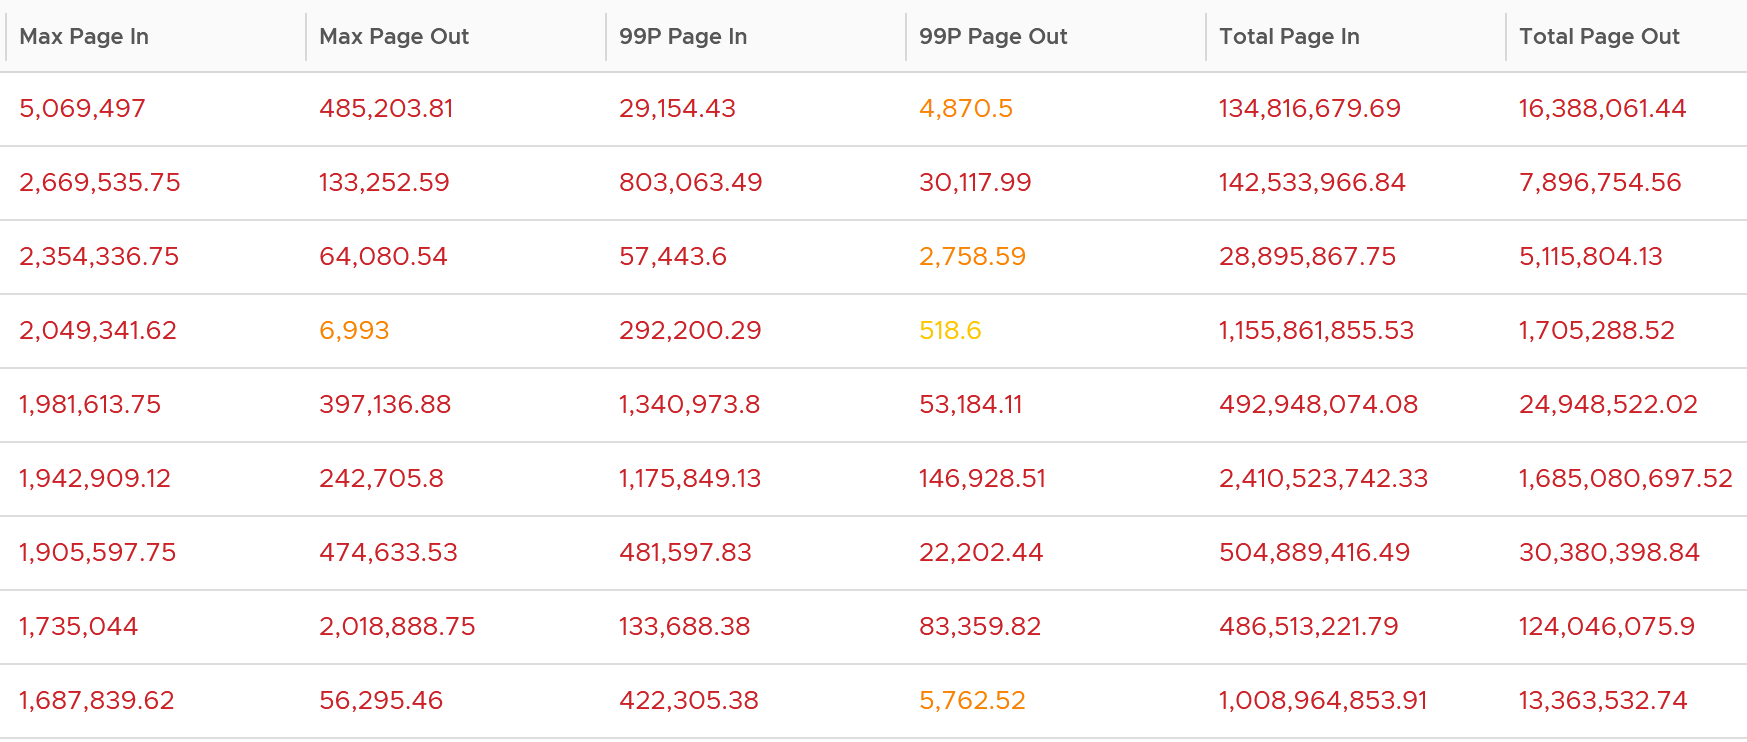
For a start, some of those numbers are really high!
They are above 1 millions. Assuming 8K block size, that’s 8 GB per second, sustained for 300 seconds.
What else do you notice?
Page-In is higher than Page-Out. I average all the 3K VMs and I got the following result:
Page-In is 4x higher in the max value. Page-In also sustains longer, while Page-Out drops significantly. At the 99th percentile mark, Page-In is 9x higher. I suspect it is the non-modifiable page, like binary. Since it cannot be modified, it does not need to be paged out. It can simply be discarded and retrieved again from disk if required.
The good news is both do not sustain, so the paging is momentary. The following shows that the value at 99th percentile can drop well below 5x.
To confirm the above, I downloaded the data so I can determine if the paging is indeed momentarily. Using a spreadsheet, I build a ratio between the 99th percentile value and the maximum value, where 10% means there is a drop of 10x. I plotted around 1000 value and got the following.
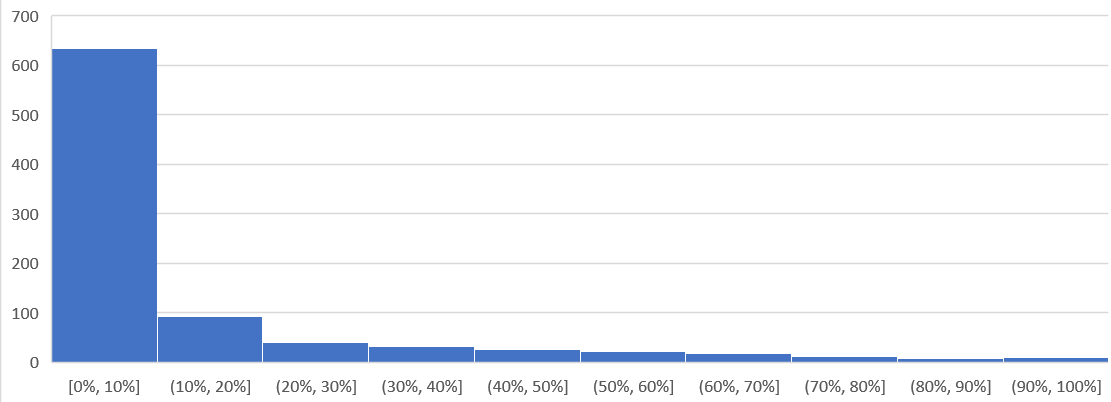
As you can see, majority of the paging drops drastically at 99th percentile.
Let’s dive into a single VM, so we can see pattern over time. I pick a database, as it does heavy paging. The following is a large Oracle RAC VM. Notice this has a closer ratio between page in and page out, and there is correlation between the two.
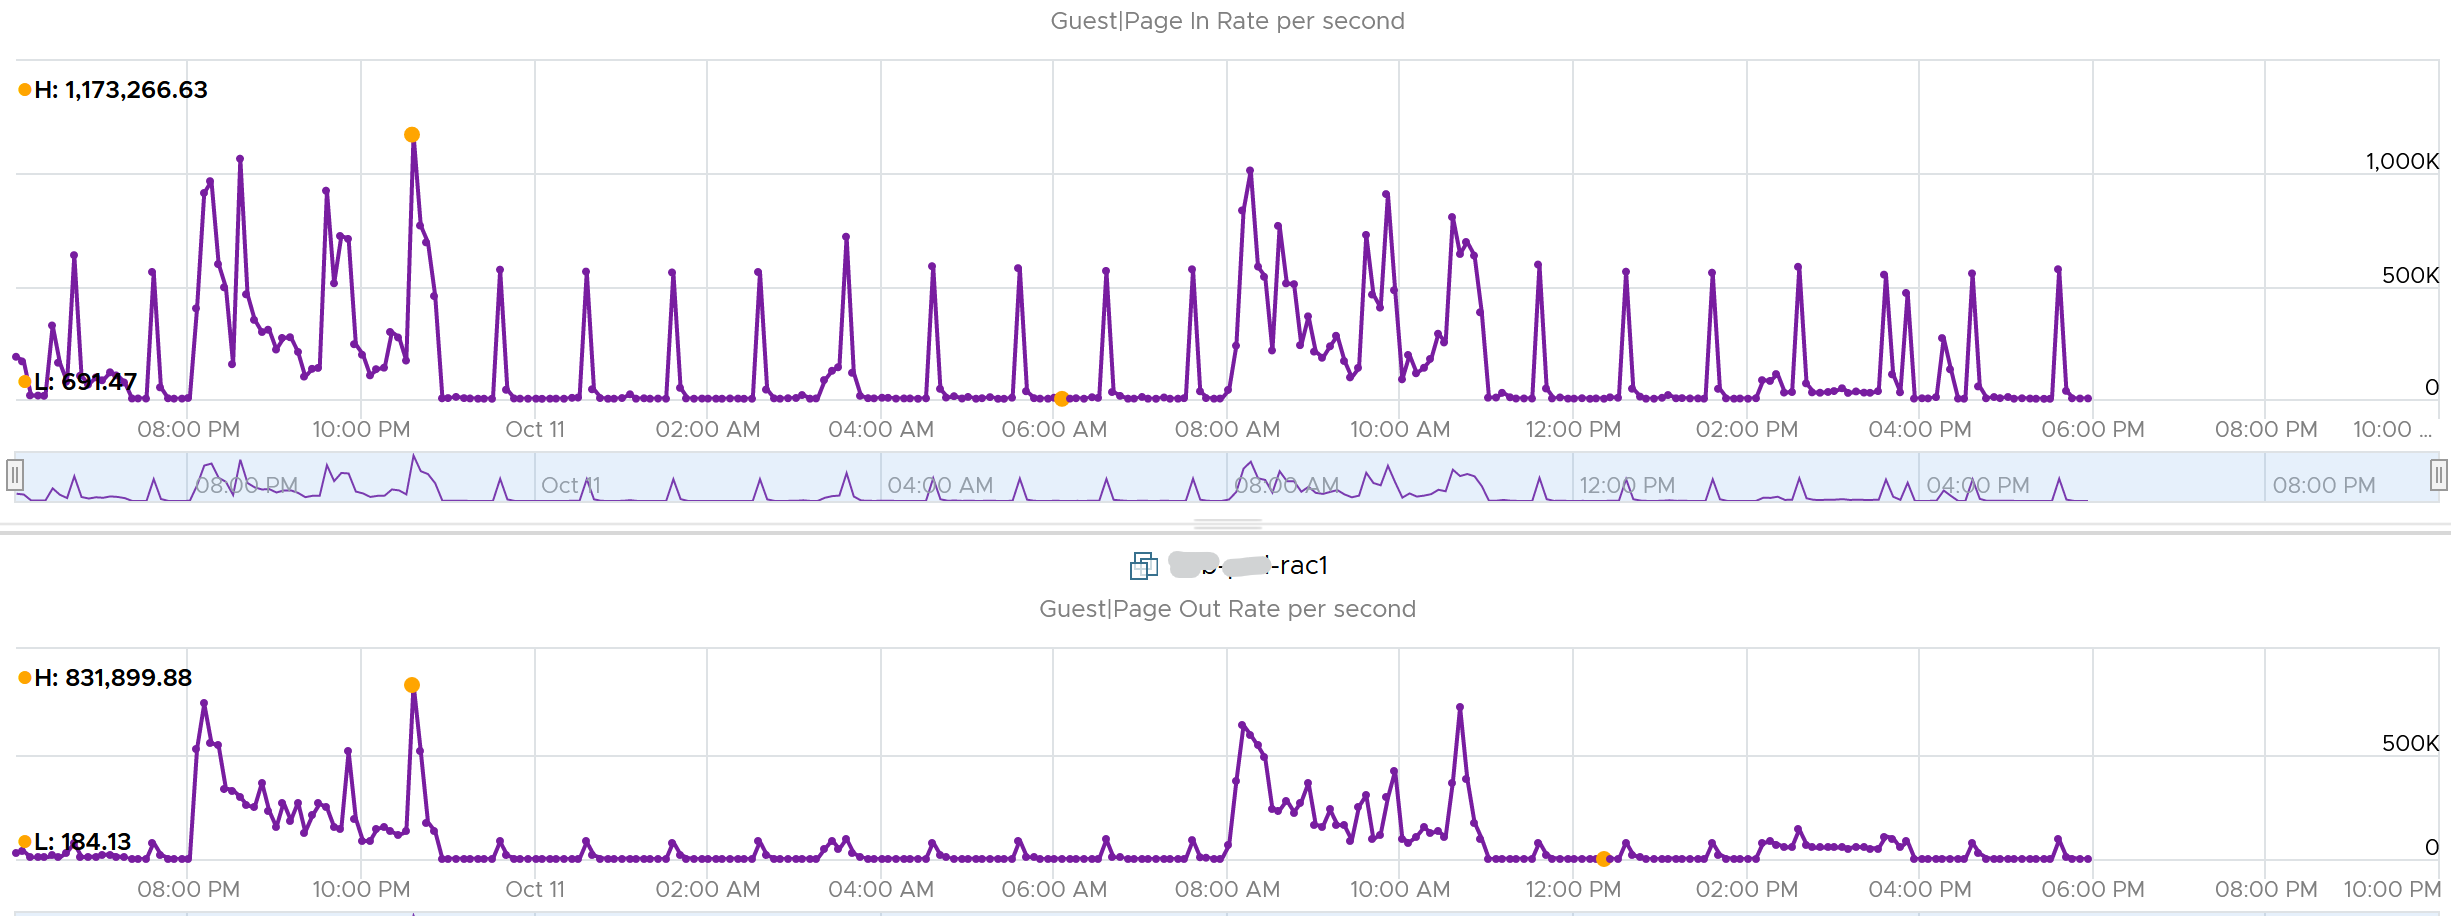
Assuming the page size is 4 KB, that means 100,000 pages = 400 MB/sec. Since VCF Operations averages the value over 300 seconds, that means 400 MB x 300 = 120 GB worth of paging in 5 minutes!
Active File Cache Memory
This is the actively in-use subset of the file cache. Unused file cache and non-file backed anonymous buffers (mallocs etc) are not included.
This is the size of the portion of the system file cache which is currently resident and active in physical memory. The System Cache Resident Bytes and Memory \ Cache Bytes metrics are equivalent. Note that this counter displays the last observed value only; it is not an average during the collection period.
For further reading, refer to Windows
Committed
Commit sounds like a guaranteed reservation, which means it’s the minimum the process can get.
This tracks the currently committed virtual memory, although not all of them are written to the pagefile yet. It measures the demand, so commit can go up without In Use going up, as Brandon Paddock shares here. If Committed exceeds the available memory, paging activity will increase. This can impact performance.
Commit Limit: Commit Limit is physical RAM + size of the page file. Since the pagefile is normally configured to map the physical RAM, the Commit Limit tends to be 2x. Commit Limit is important as a growing value is an early warning sign. The reason is Windows proactively increases its pagefile.sys if it’s under memory pressure.
The pagefile is an integral part of Windows total memory, as explained by Mark Russinovich explains here. There is Reserved Memory, and then there is Committed Memory. Some applications like to have its committed memory in 1 long contiguous block, so it reserves a large chunk up front. Databases and JVM belong in this category. This reserved memory does not actually store meaningful application data or executable. Only when the application commits the page that it becomes used. Mark explains that “when a process commits a region of virtual memory, the OS guarantees that it can maintain all the data the process stores in the memory either in physical memory or on disk”.
Notice the word on disk. Yes, that’s where the pagefile.sys comes in. Windows will use either the physical memory or the pagefile.sys.
So how do we track this committed memory?
The metric you need to track is the Committed Byte. The % Committed metric should not hit 80%. Performance drops when it hits 90%, as if this is a hard threshold used by Windows. We disabled the pagefile to verify the impact on Windows. We noticed a visibly slower performance even though Windows 7 showing >1 GB of Free memory. In fact, Windows gave error message, and some applications crashed. If you use a pagefile, you will not hit this limit.
We have covered Free Memory and Committed Memory. Do they always move in tandem? If a memory is committed by Windows, does it mean it’s no longer free and available?
The answer is no. Brandon Paddock demonstrated here that you can increase the committed page without increasing the memory usage. He wrote a small program and explained how it’s done. The result is Windows committed page is double that of memory usage. The Free Memory & Cached Memory did not change.
Needed Memory
This is not a raw counter from Windows or Linux. This is a derived counter provided by VMware Tools to estimate the memory needed to run with minimum swapping. It’s a more conservative estimate as it includes some of the cache. It has 5% buffer for spike, based on the general guidance from Microsoft. Below this amount, the Guest OS may swap.
= physical memory - Maximum of (0, ( Unneeded - 5 % of physical ))
where Unneeded = Free + Reserve Cache + Normal Priority Cache
Example: the VM has 10 GB of RAM. So the Physical RAM = 10 GB
So 5% of physical = 0.5 GB
*Situation 1: max memory utilization.*
Memory Available = 0 GB.\
Tools will calculate Needed memory as\
= 10 GB - Maximum (0, 0 – 0.5)\
= 10 - Maximum (0, -0.5)\
= 10 - 0 GB\
= 10 GB\
Needed memory is the same as it’s already maxed.
*Situation 2: high memory utilization.*
Memory Available = 2 GB.\
Tools will calculate Needed memory as\
= 10 GB - Maximum (0, 2 – 0.5)\
= 10 - Maximum (0, 1.5 GB)\
= 10 - 1.5 GB\
= 8.5 GB\
You actually still have 2 GB here. But Tools adds around 5%
*Situation 3: low memory utilization.*
Memory Available = 8 GB.\
Tools will calculate Needed memory as\
= 10 GB - Maximum (0, 8 – 0.5)\
= 10 - Maximum (0, 7.5 GB)\
= 10 - 7.5 GB\
= 2.5 GB\
Again, Tools adds around 5%.
We’ve covered that you need to look at more than 1 metric before you decide to add more memory. I’m afraid it is case by case, as shown in the following table. All these VMs are low on free memory, but other than VM on row no 3, the rest has sufficient memory.
Storage
This is the layer that application team care as it is what is presented to them.
| Questions | Description |
| Configuration | For each partition, need to know name, filesystem type (e.g. NTFS, ext4), network or local, block size. Ideally, we get the mapping between partition and virtual disk. |
| Capacity | For each partition, need to know the configured space and used space. For free space, we need to know both in absolute (GB) and relative (%). Need to alert before running out of disk space, else the OS crashes. We should not include the networked drive in Guest OS capacity, because the networked drive is typically shared by many. An exception is in VDI use case, where the user personal files is stored on the network. |
| Reclamation | This can be determined from the free space. Reclamation is tricky as it needs to shrink partition. |
| Performance | Queue, Latency (read and write), IOPS, Throughput |
Disk Queue
With VMware Tools, you get Guest OS visibility into the partitions and disk queue. The first one is critical for capacity, while the second is critical for performance.
This counter tracks the queue inside Linux or Windows storage subsystem. It’s not the queue at SCSI driver level, such as LSI Logic or PVSCSI. If this is high then the IO from applications did not reach the underlying OS SCSI driver, let alone the VM. If you are running VMware storage driver, such as PVSCSI, then discuss with VMware Support.
There are actually 2 metrics: One is a point in time and the other is average across the entire collection cycle. Point in time means the snapshot at the collection period. For example, if the collection is every 5 minute, then it’s number on the 300th second, not the average of 300 numbers.
Windows documentation said that “Multi-spindle disk devices can have multiple requests active at one time, but other concurrent requests await service. Requests experience delays proportional to the length of the queue minus the number of spindles on the disks. This difference should average < 2 for good performance.”
| guest.disk.queue | Win32_PerfFormattedData_PerfDisk_PhysicalDisk.Name = \_Total\#CurrentDiskQueueLength" from WMI |
|----|----|
| guest.disk.queueAvg | Win32_PerfFormattedData_PerfDisk_PhysicalDisk.Name = \_Total\#AvgDiskQueueLength" from WMI |
High disk queue in the guest OS, accompanied by low IOPS at the VM, can indicate that the IO commands are stuck waiting on processing by the OS. There is no concrete guidance regarding these IO commands threshold as it varies for different applications. You should view this in relation to the Outstanding Disk IO at the VM layer.
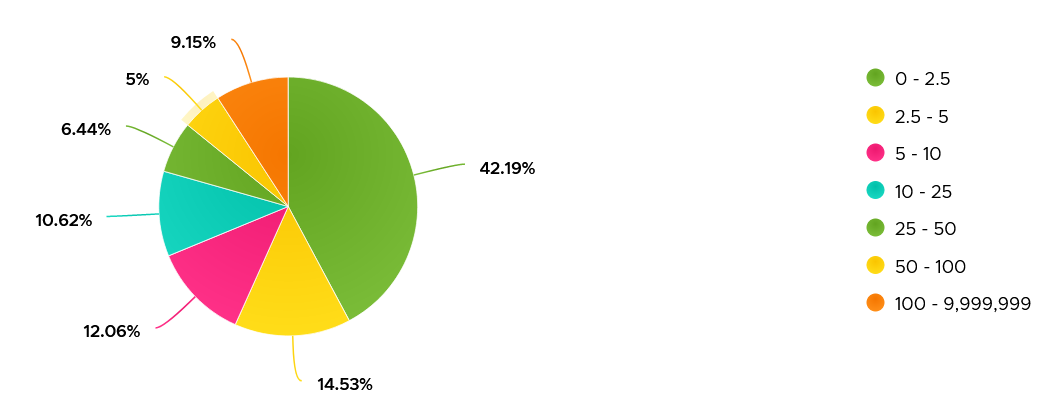
Based on 3000 production VMs in the last 3 months, the value turn out to be sizeable. Almost 70% of the value is below 10. Around 10% is more than 100 though, which I thought it’s rather high.
Strangely, there are values that seem to off the chart. I notice this in a few metrics already, including this. Look at the values below. Do they look like a bug in the counter, or severe performance problem?
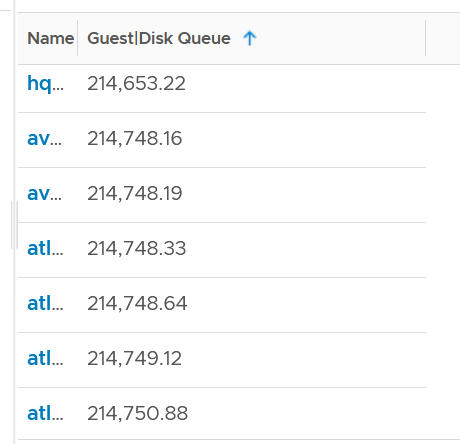
Unfortunately, we can’t confirm as we do not have latency counter at Guest OS level, or even better, as application level. I am unsure if the queue is above the latency, meaning the latency counter does not start counting until the IO command is executed.
I plot the values at VM level, which unsurprisingly does not correlate. The VM is tracking IO that has been sent, while Guest OS Disk Queue tracks the one that has not been sent.
The preceding line chart also reveals an interesting pattern, which is disk queue only happens rarely. It’s far less frequent than latency.
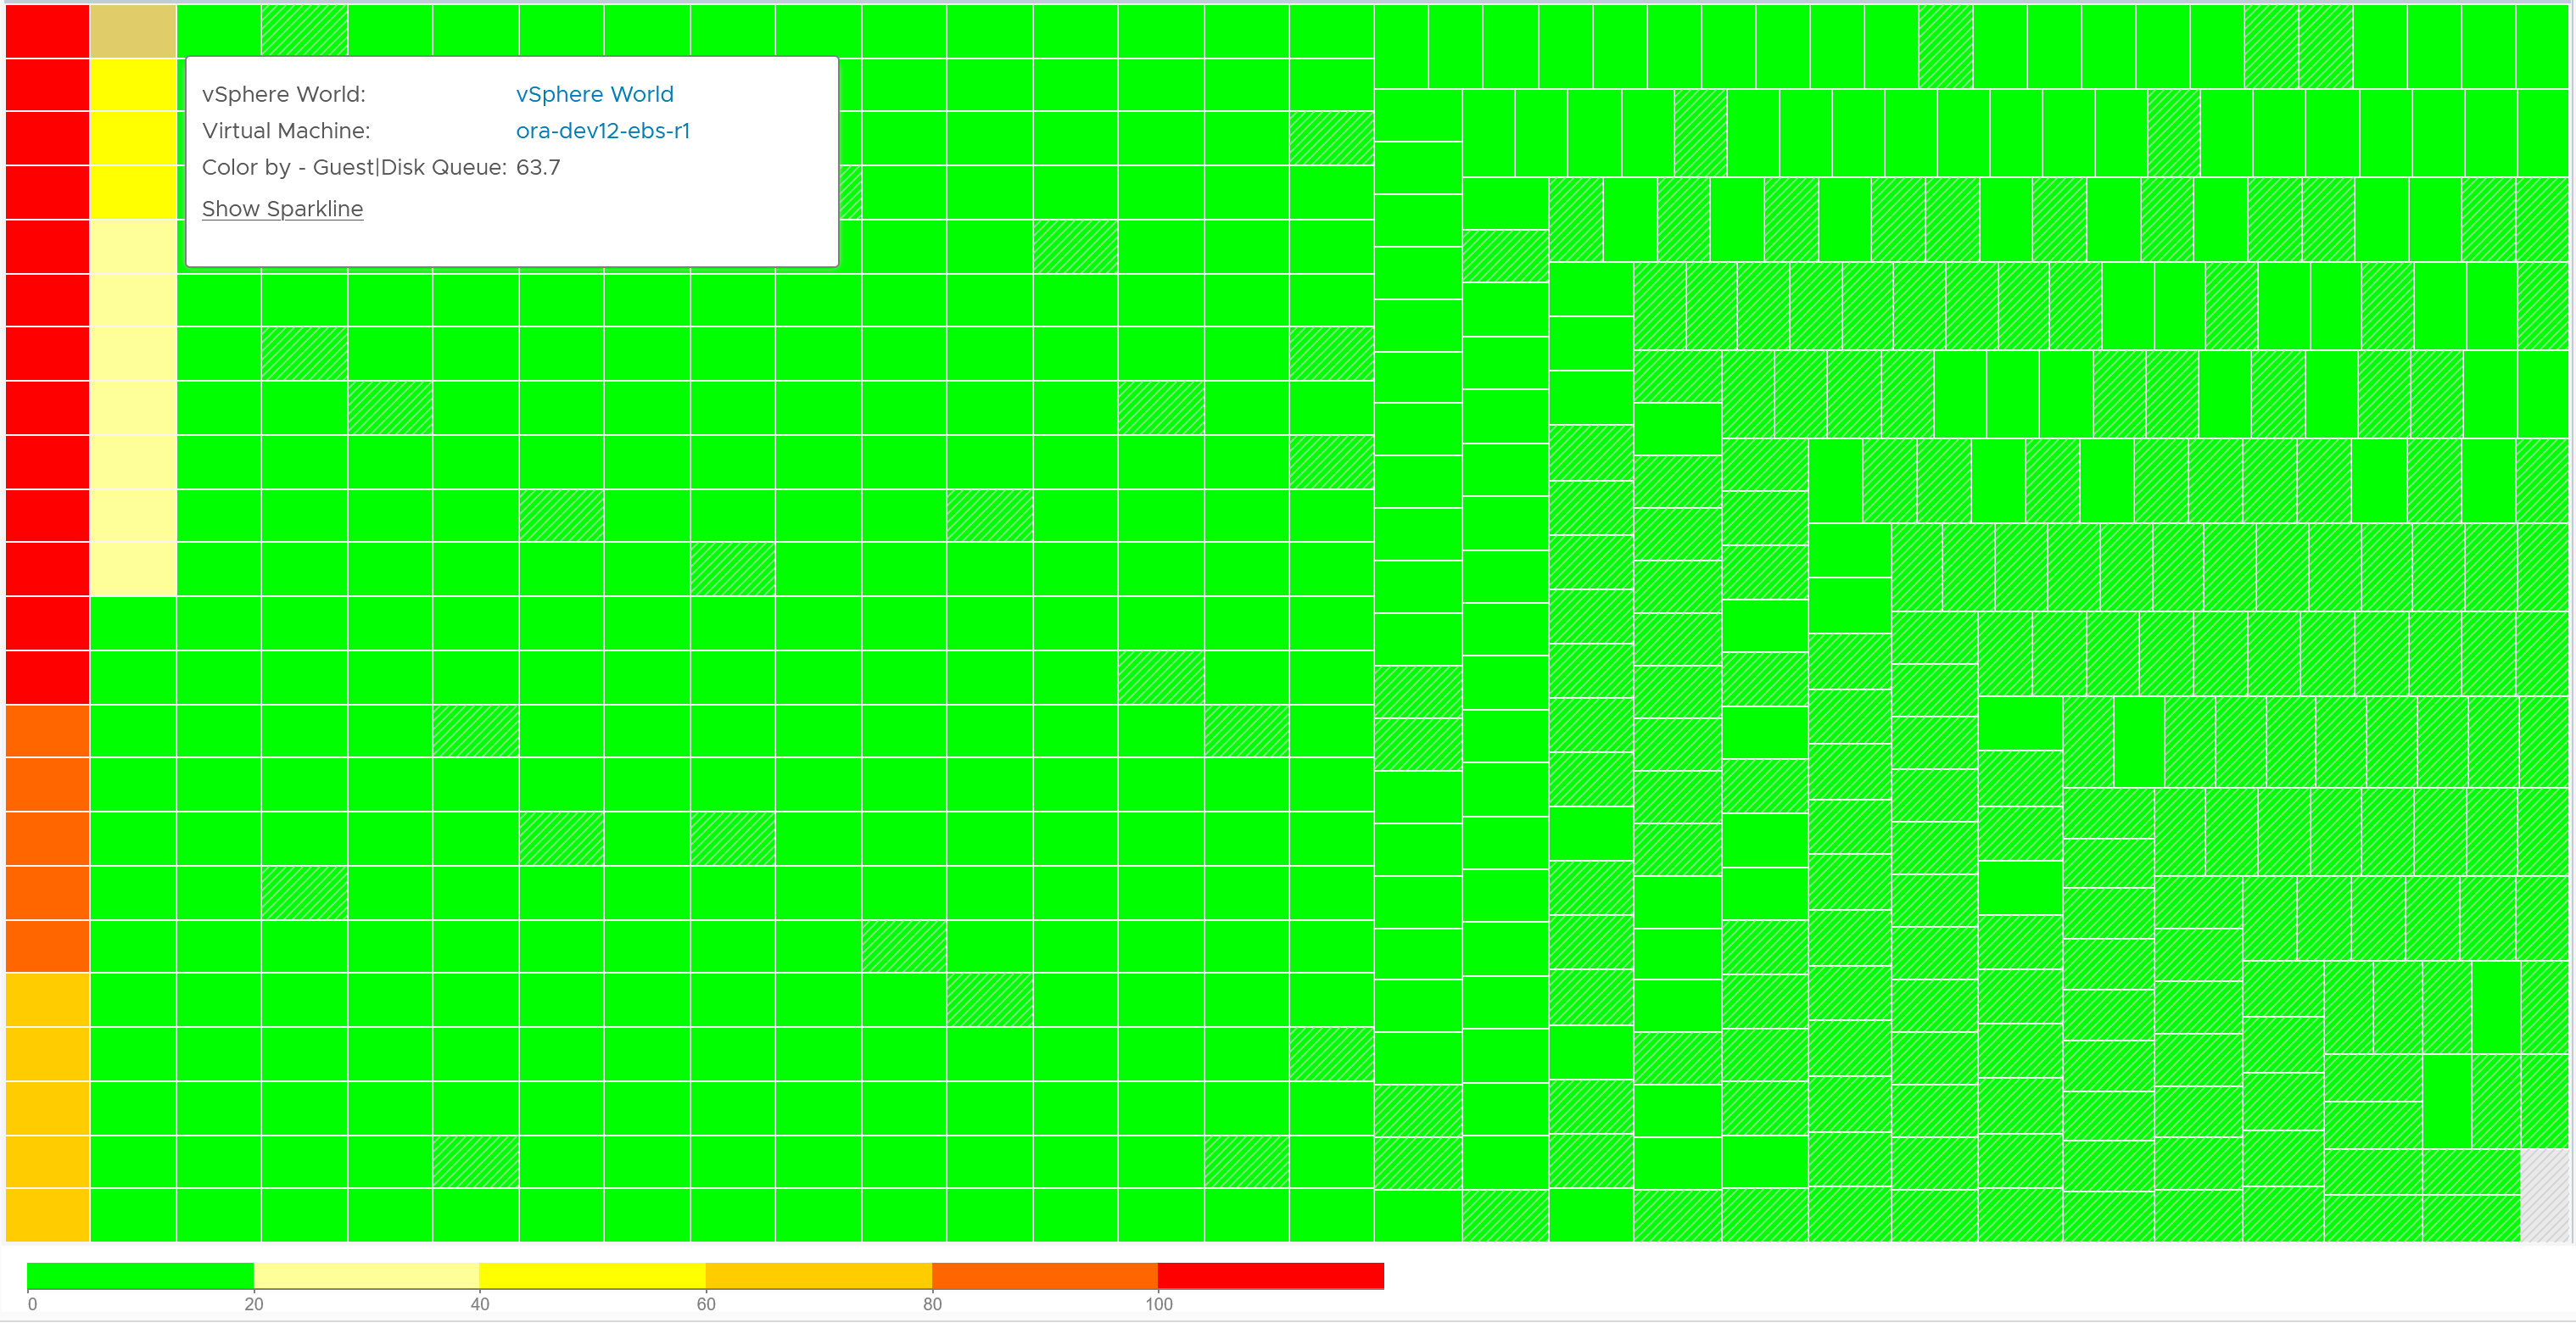
Let’s find out more. From the following heat map, you can see there are occurrences where the value is >100.
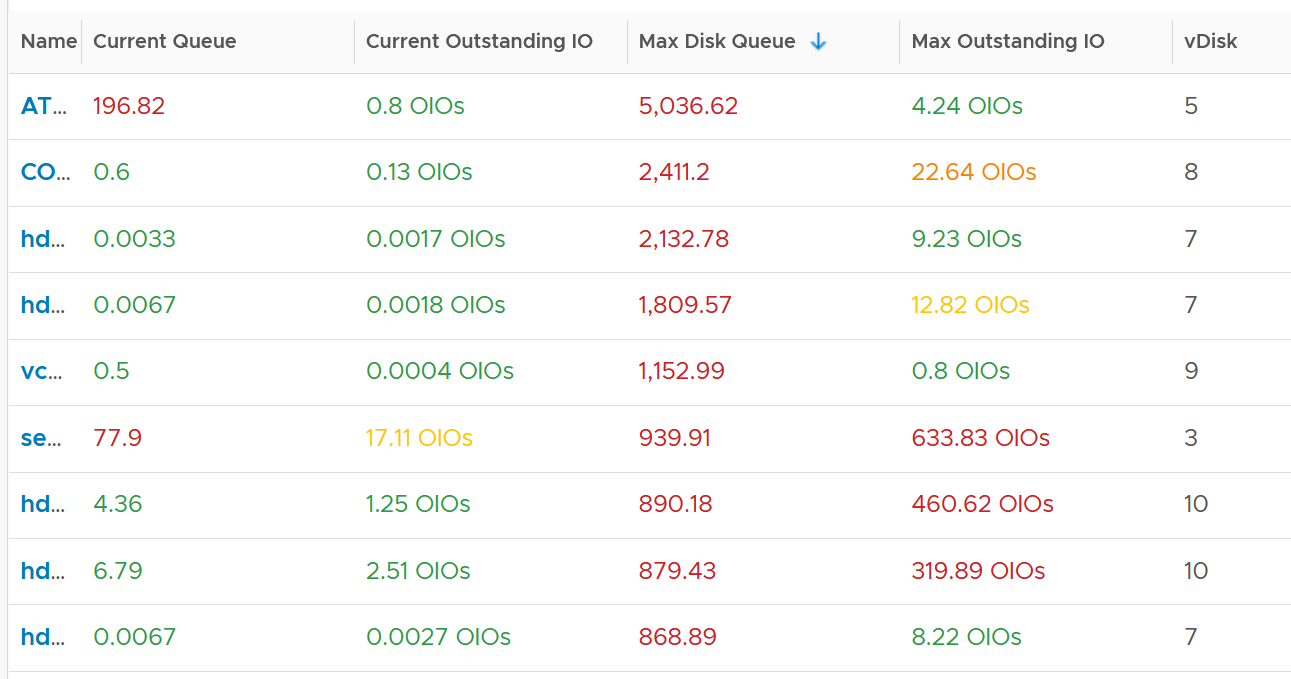
However, when we compare between current value and maximum value, the value can be drastically different.
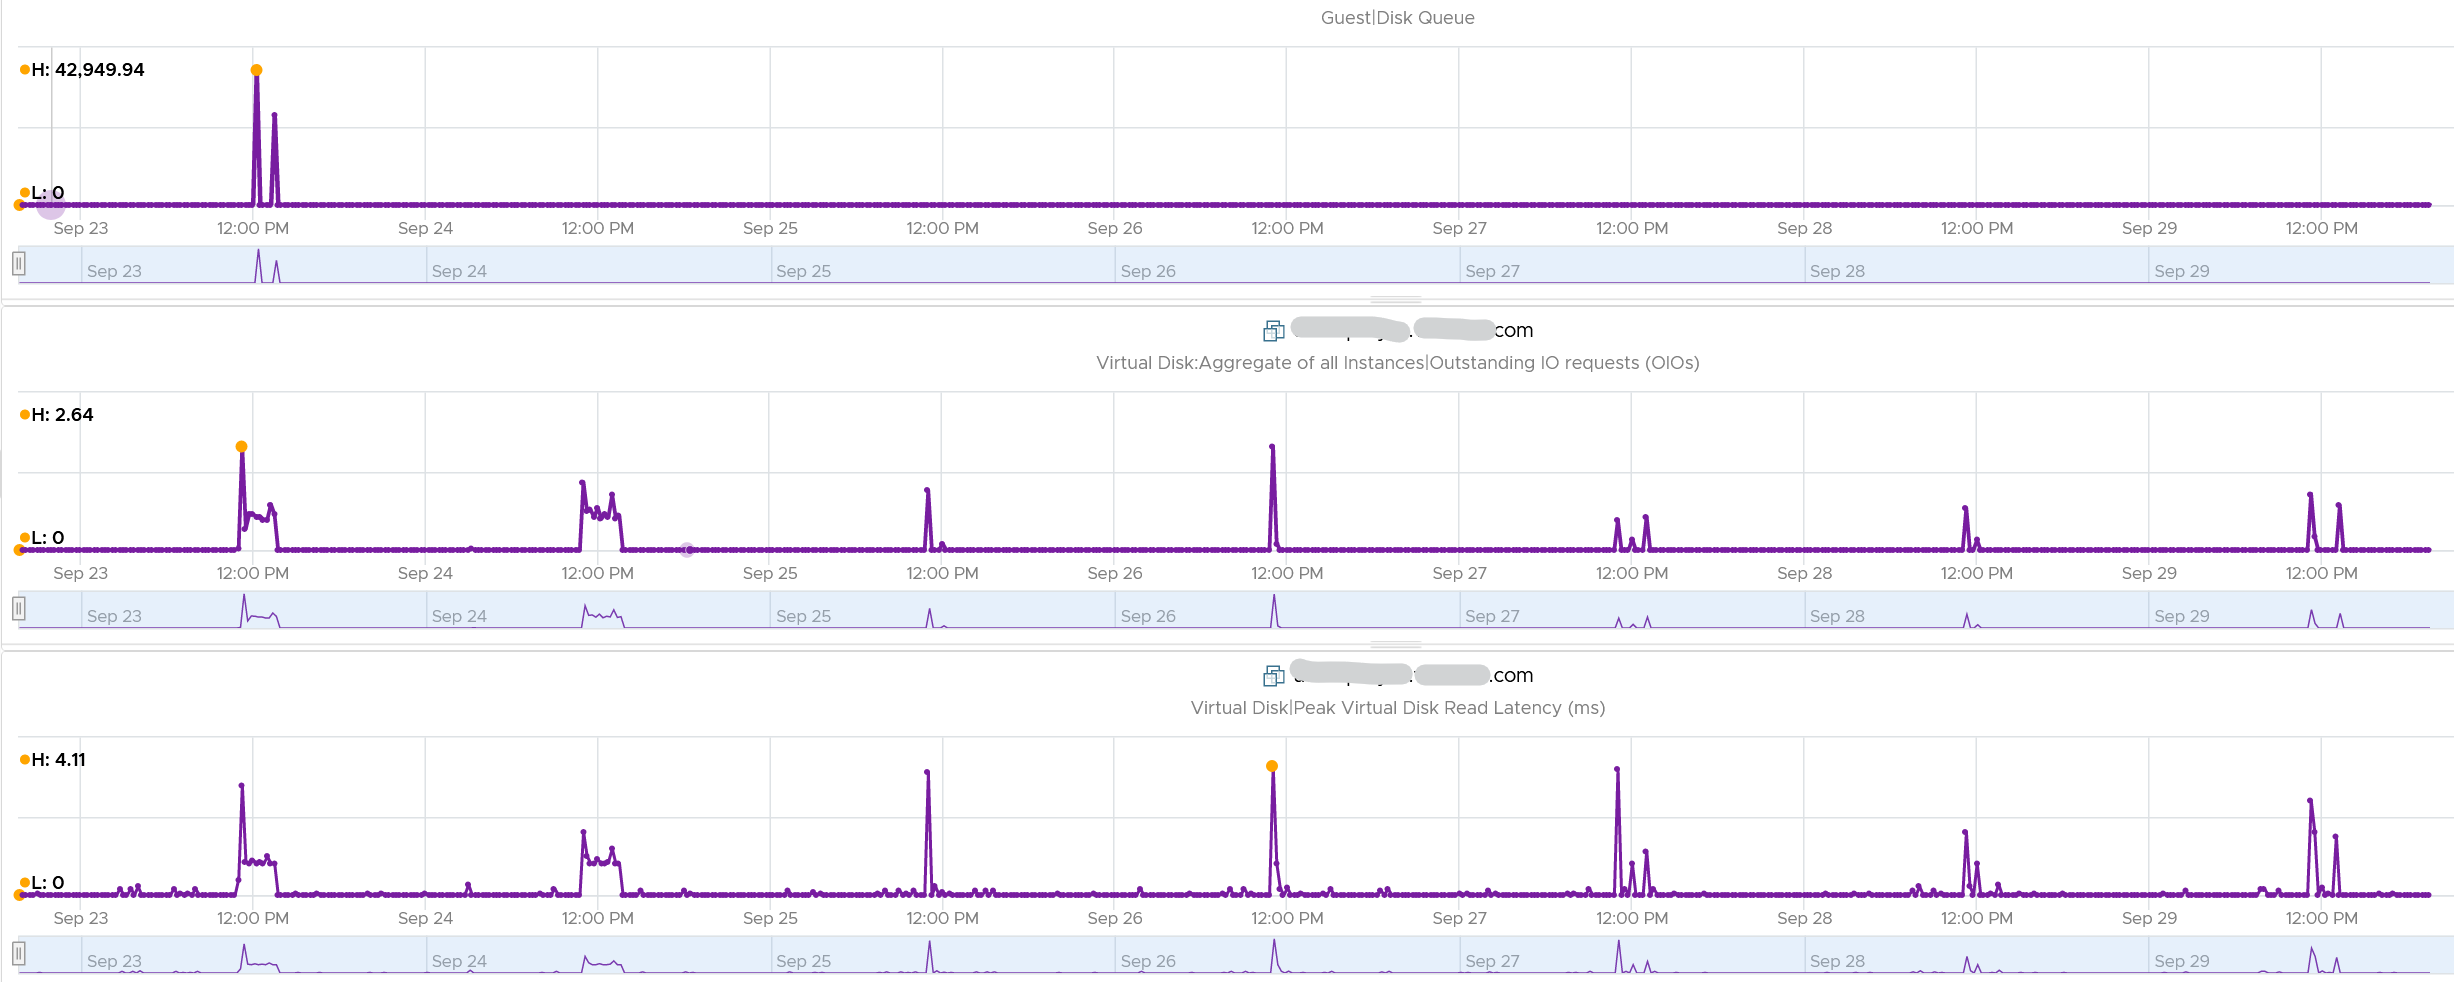
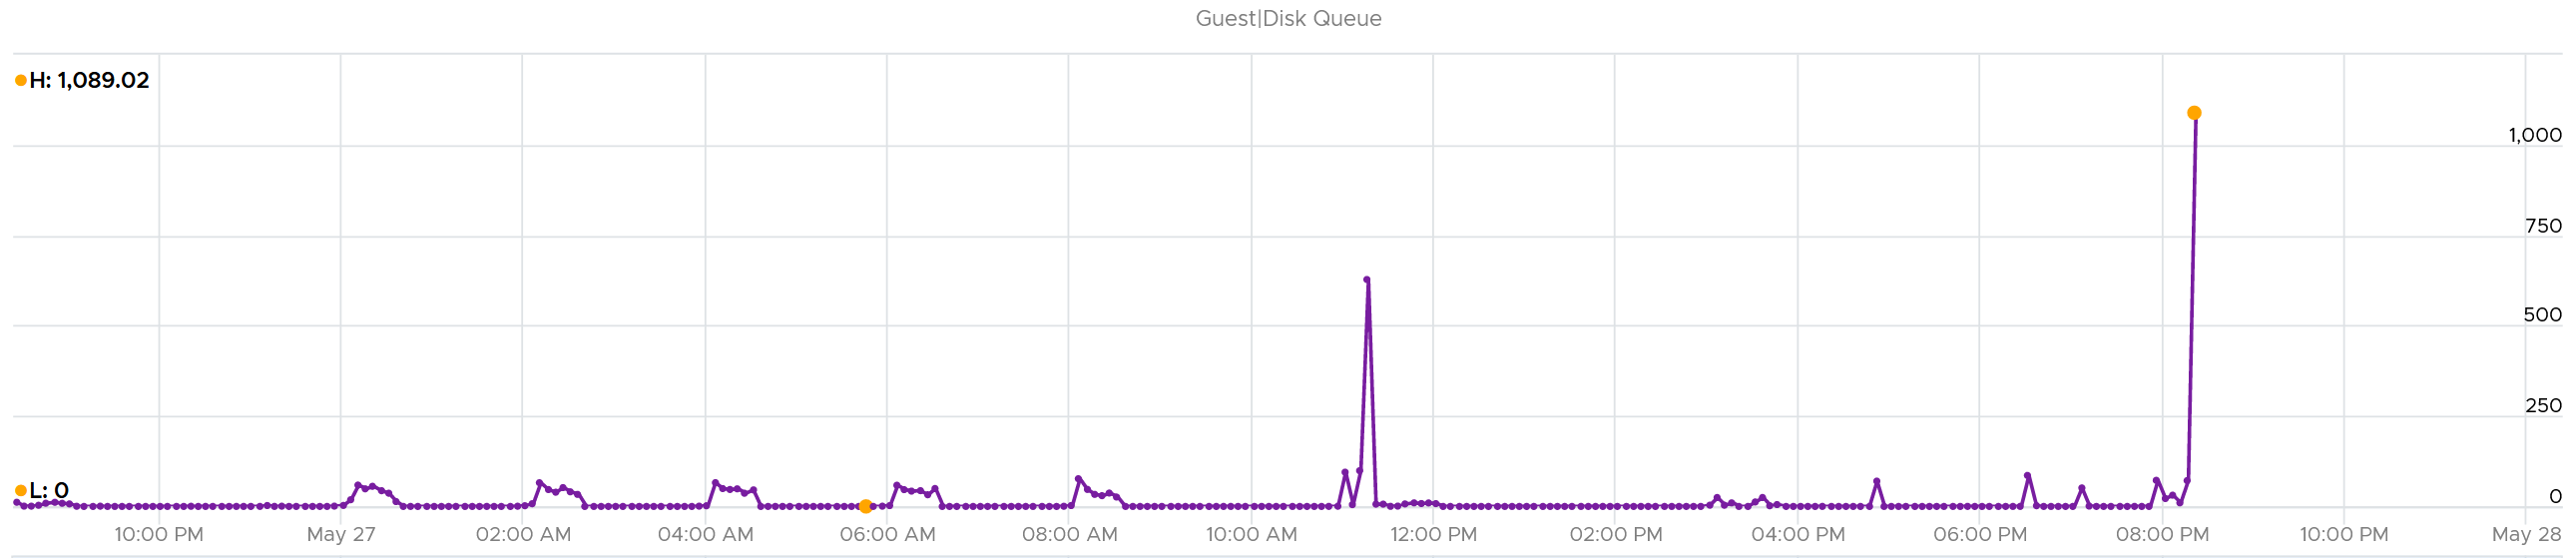
Let’s take one of the VMs and drill down. This VM has regular spikes, with the last one exceeding 1000.
Their values should correlate with disk outstanding IO. However, the values are all low. That means the queue happens inside the Guest OS. The IO is not sent down to the VM.
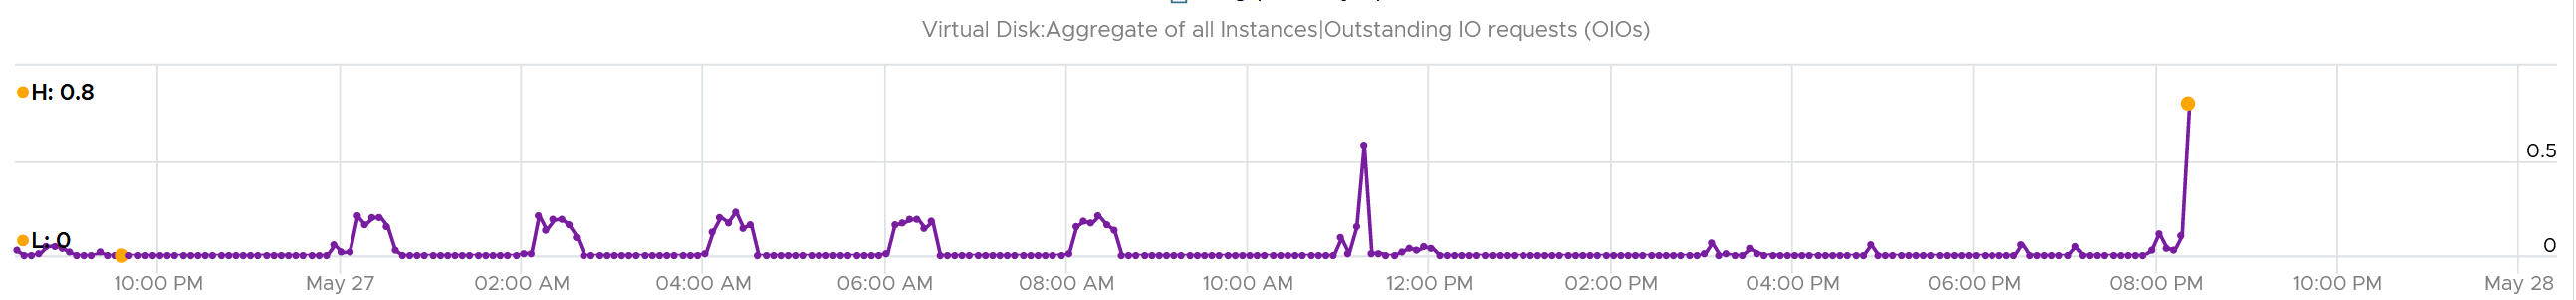
Which in turn should have some correlation with IOPS, especially if the underlying storage in the Guest OS (not VM) is unable to cope. The queue is caused by high IOPS which cannot be processed.
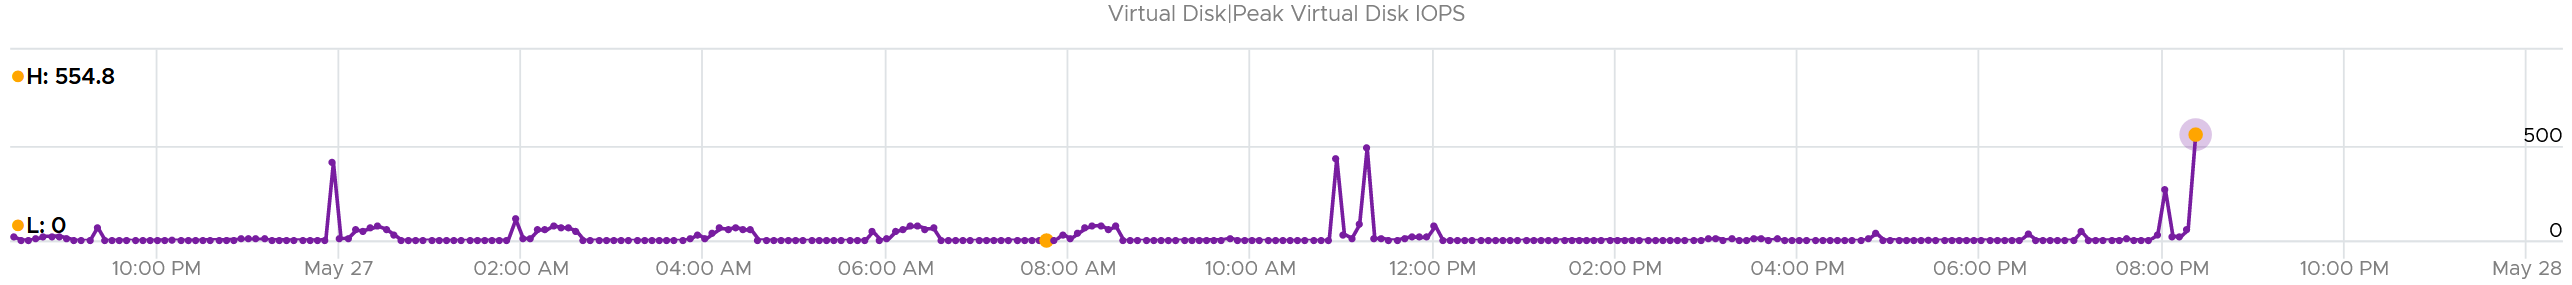
Finally, it would manifest in latency. Can you explain why the latency is actually still good?
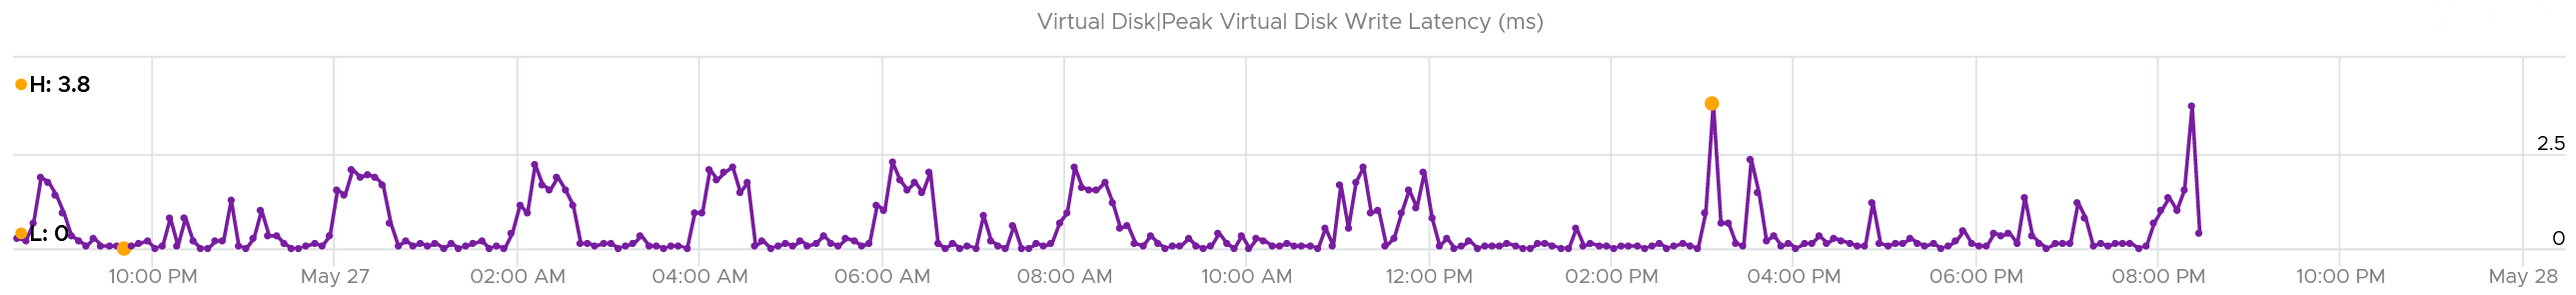
It’s because that’s from the IO that reaches the hypervisor. The IO that was stuck inside Windows is not included here.
The application feels latency is high, but the VM does not show it as the IO is stuck in between.
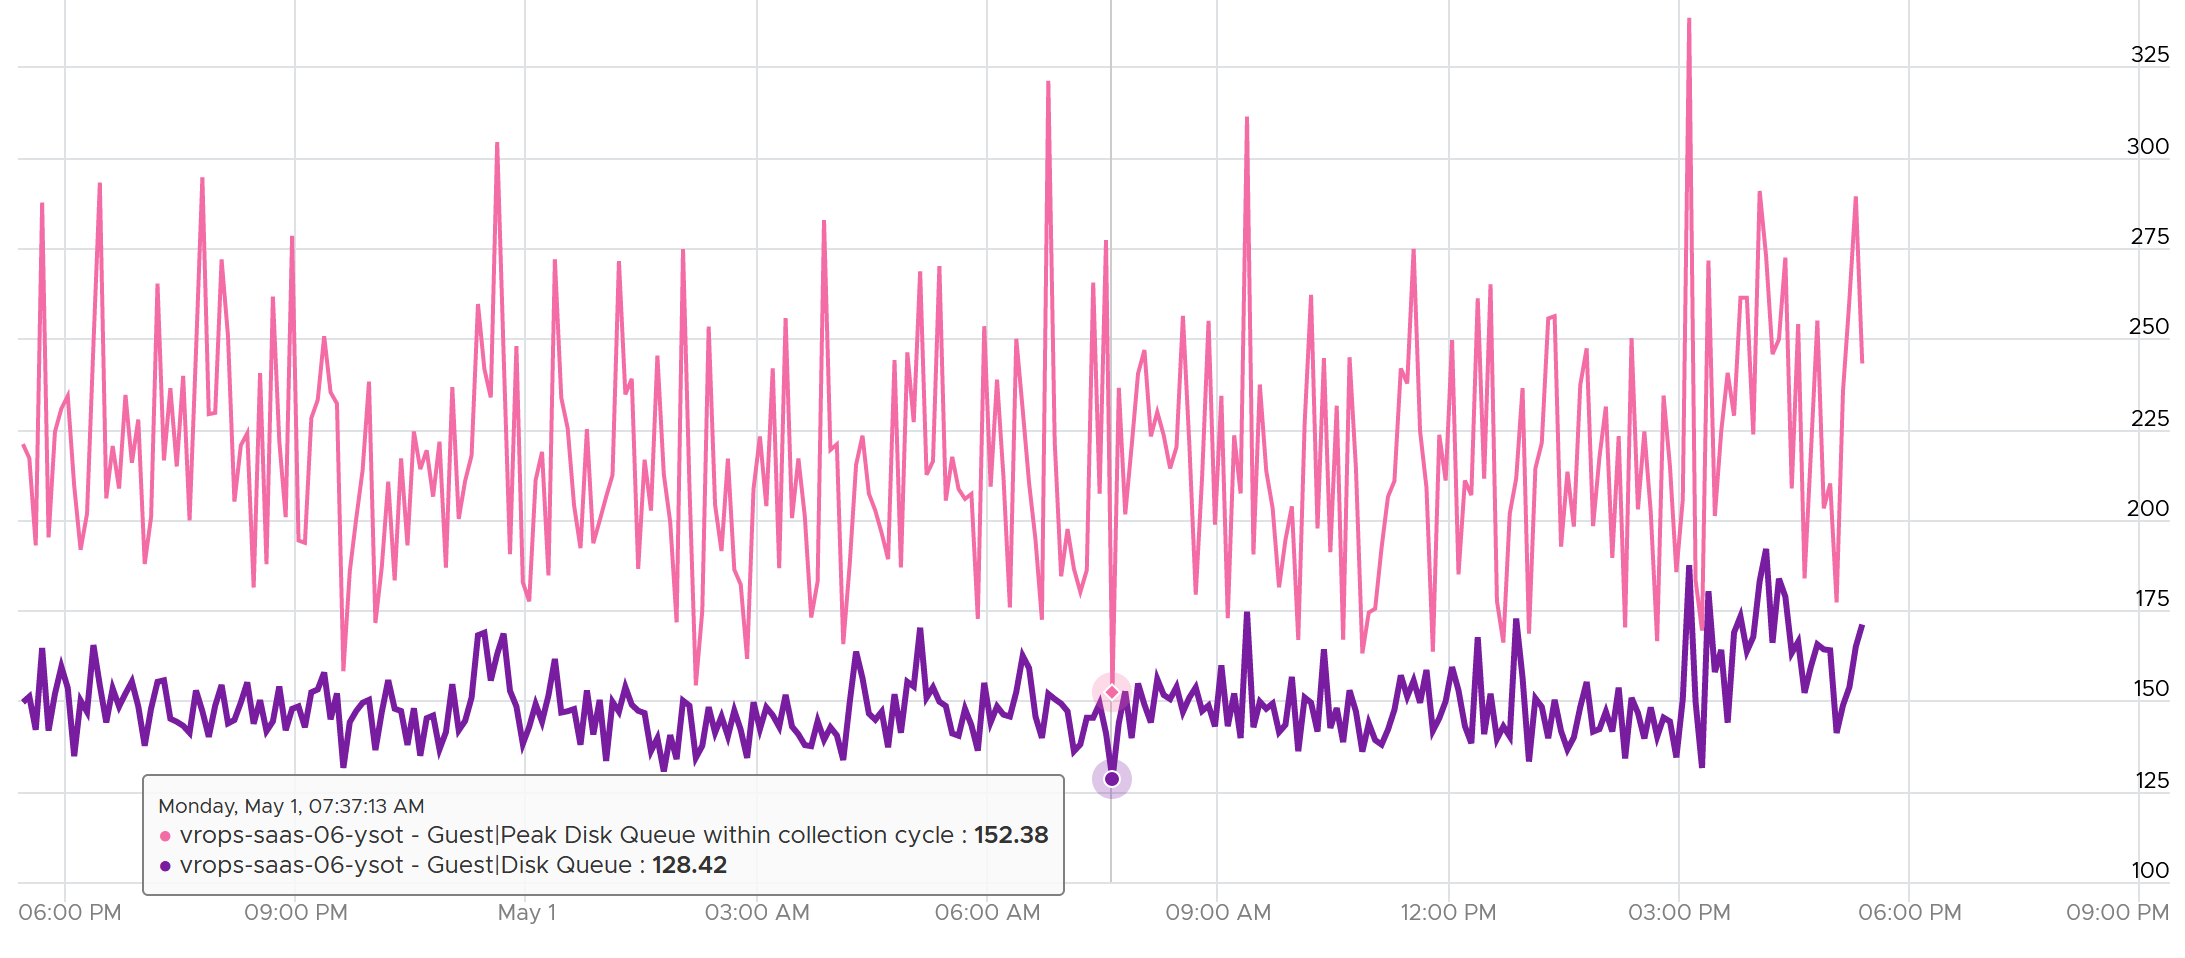
Can the disk queue be constantly above 100?
The following VM shows 2 counters. The 20-second Peak metric is showing ~200 – 250 queue, while the 5-minute average shows above 125 constantly. The first counter is much more volatile, indicating the queue did not sustain.