Memory
Architecture
The purpose of memory is to act as disk cache. So you want to utilize all the cache given to you. 100% usage results in faster performance than 99%, all else being equal.
Let's now take a trip down memory lane, pun intended.
Memory differs from CPU as it is a form of storage.
-
CPU is transient in nature. Instructions enter and leave the execution pipelines in less than a nanosecond. That’s why CPU reservation becomes not applicable when the VM is not using it.
-
Memory behaves more like disk space. Memory reservation could remain in place even if the VM has not read or written the page in days.
As a storage, memory is basically a collection of blocks in physical DIMM. Information is stored in memory in standard block sizes, typically 4 KB or 2 MB. Each block is called a page. At the lowest level, the memory pages are just a series of zeroes and ones. MS Windows initializes its pages with 0, hence there is a zero-page counter in ESXi.
Keeping this concept in mind is critical as you review the memory metrics. The storage nature of memory is the reason why memory monitoring is more challenging than CPU monitoring. Unlike CPU, memory has 2 dimensions:
| Speed | Nanoseconds | The only counter ESXi has is Memory Latency. This counter increases when the time to read from the RAM is longer than usual. The counter tracks the percentage of memory space that’s taking longer than expected. It’s not tracking the actual latency in nanosecond. This is the opposite of Disk, where we track the actual latency, but not the percentage of amount of space that is facing latency. Both are storage, but “server people” and “storage people” measure them differently 😊 |
|---|---|---|
| Space | Bytes | This is the bulk of the metrics |
| As storage, it’s relatively static. As a result, you can create a heat map that plots all your Guest OS or VMs memory consumption. You want it near 100% while making sure the page in and page out rate within normal expectation. |
The 4 Layers
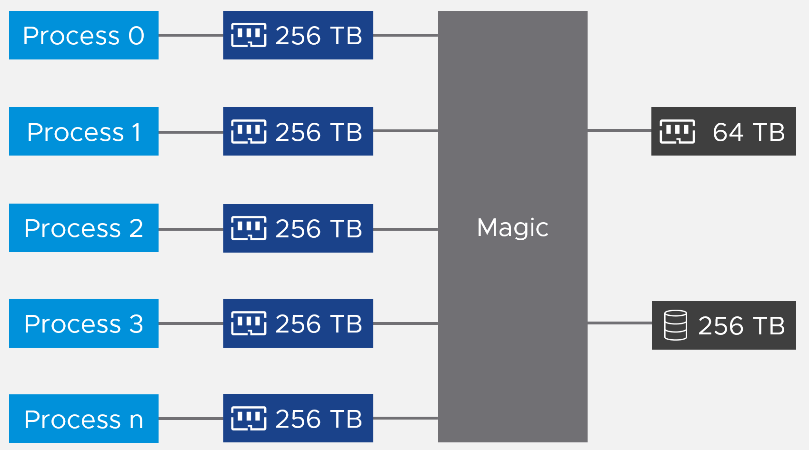
With virtualization, there are 2 additional layers added. This brings the total to 4 from Process 🡪 Guest OS 🡪 VM 🡪 ESXi.
No, a container does not have its own memory management system. Because a container shares the host OS kernel, it relies entirely on the parent OS kernel to allocate, track, and manage physical memory.
However, the parent OS uses specific kernel features to make the container think it is isolated and to strictly limit how much memory it can use.
The only layer that manages the actual physical memory is the last layer. This is why the term “Guest physical memory” is illogical.
Each layer has their own viewpoint. Understanding the vantage point is required to make sense of the metrics. It will prevent you from comparing metrics that are not comparable (e.g. granted vs consumed) as they have different context.
Each of these layers have their own address space. And that’s where the fun of performance troubleshooting begins 😉
Virtual Memory
Virtual memory is an integral part of memory management. The following[^14] shows how Windows or Linux masks the underlying physical memory from processes running on the OS.
From the process’ point of view, this technique provides a contiguous address space, which makes memory management easier. It also provides isolation, meaning process A can’t see the memory of process B. This isolation provides some level of security. The isolation is not as good as isolation by container, which in turn is inferior to isolation by VM.
Virtual memory abstraction provides the possibility to overcommit. Microsoft Windows may only have 16 GB of physical RAM, but by using pagefile the total memory available to its processes can exceed 16 GB. The process is unaware what is backing its virtual address. It does not know whether a page is backed by Physical Memory or Swap File. All it experiences is slowness, but it won’t know why as there is no counter at process level that can differentiate the memory source.
On the other hand, some applications manage its own memory and do not expose to the operating system. Example of such applications as are database and Java VM. Oleg Ulyanov shared in this blog SQL Server has its own operating system called SQLOS. It handles memory and buffer management without communicating back to underlying operating system.
From the VMs point of view, it provides a contiguous address space and isolation (which is security). The underlying physical pages at ESXi layer may not be contiguous, as it’s managed differently.
| VM memory | Metrics tracks the VM Pages. There are 2 sets, one for each VM, and one a summation at ESXi level for all running VMs. Do not confuse the summation with ESXi memory metrics. Examples: Granted or Memory Shared |
|---|---|
| ESXi memory | Metrics tracks the ESXi Pages. There are also 2 sets, but the summation at ESXi level contains the kernel own memory and VM overhead Examples: Consumed or Memory Shared Common |
ESXi uses 3 levels to manage memory:
| TPS | Transparent Page Sharing (TPS) happens automatically even if ESXi has plenty of RAM as it makes sense to do so. It’s not an indicative of unmet demand. Sharing the same page is the right thing to do, and not something that should be started only when physical pages are running low. See more here. |
| Tiered Memory | This also happens transparently to the VM. ESXi moves inactives pages to the NVMe device. |
| Balloon | The first sign of unmet demand. It happens proactively, before ESXi is unable to meet Demand. Ballooning reduces cache. It does not mean ESXi unable to meet Demand. Demand is not met when Contention happen. That’s the only time it is not met. |
| Compress/Swap | This happens proactively too. It does not mean VMs were contending for RAM. It merely means ESXi Consumed is very high. That Consumed can contain a lot of cache |
| If there is a host cache, ESXi uses this first. |
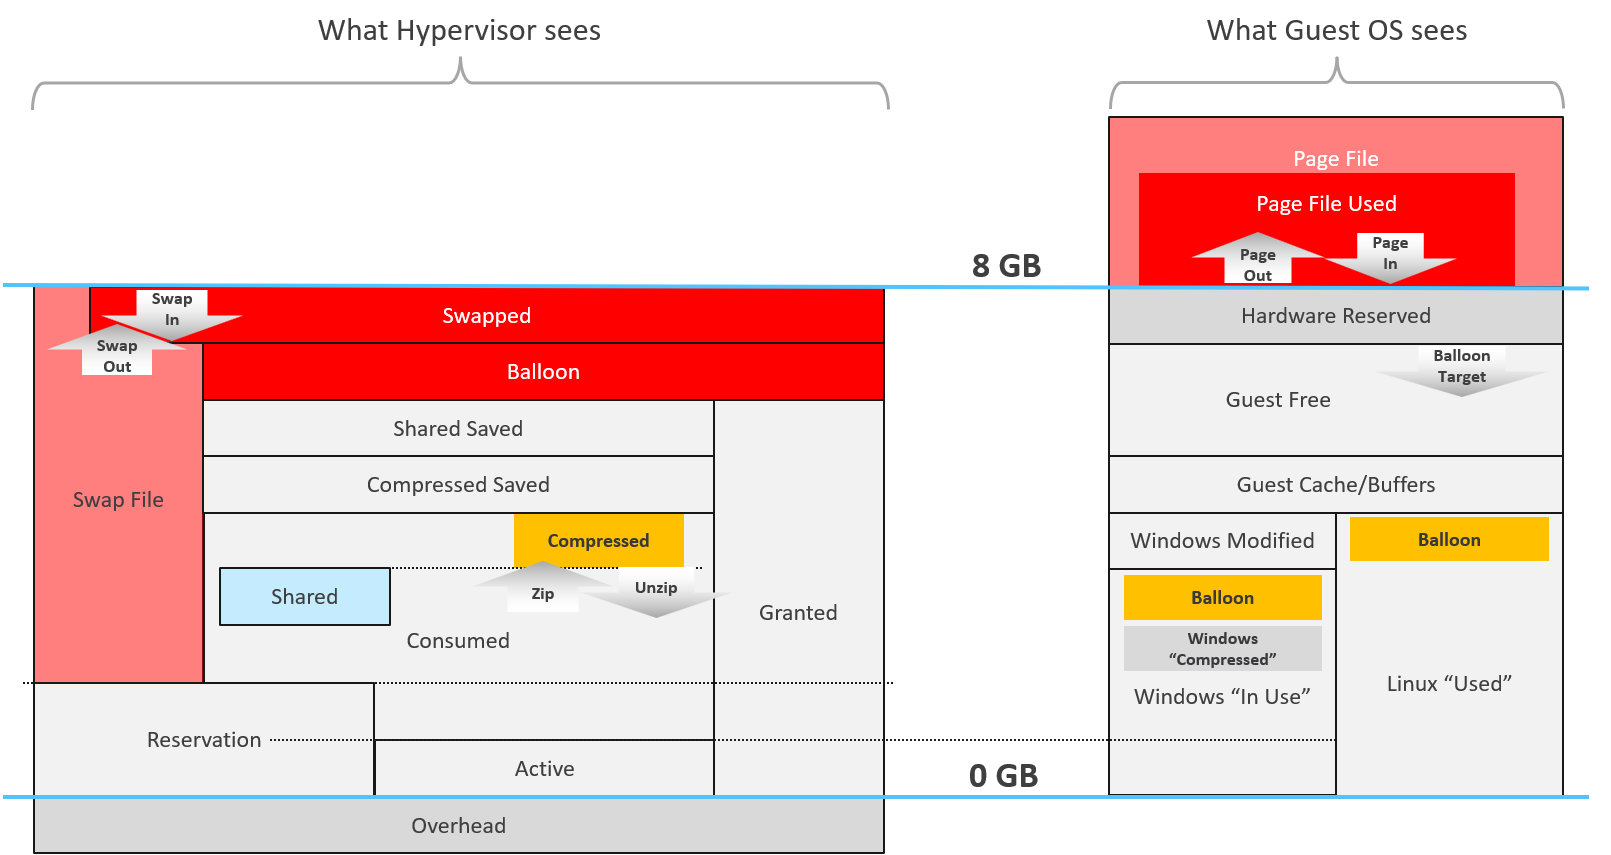
This abstraction provides the possibility to overcommit, because the VM is unaware what is backing the physical address. It could be physical memory on DIMM, swap file, Copy-on-Write, zipped, or ballooned. The following is taken from VMware vSphere 6.5 Host Resources Deep Dive[^15]. I have highlighted in green the part you need to pay attention.
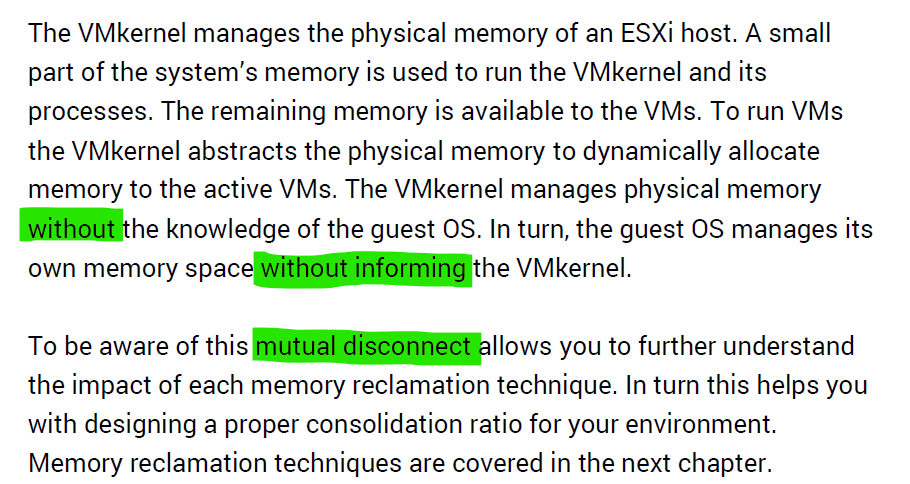
Read further and you will see that the kernel large page setting contributes more to ESXi capacity and the VM performance.
Relationship
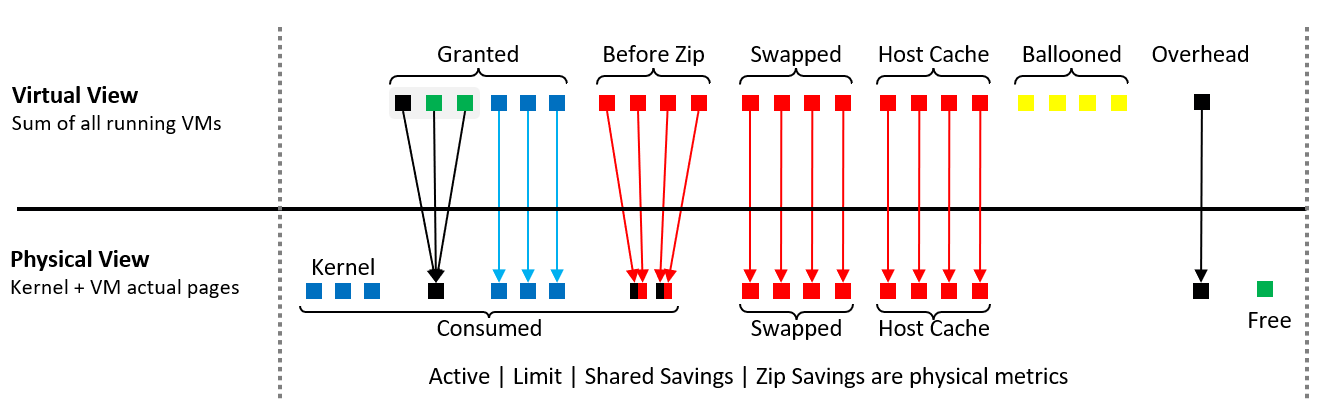
Let’s put the 4 layers in a diagram[^16], showing how a page maps across the 4 layers.
What do you notice?
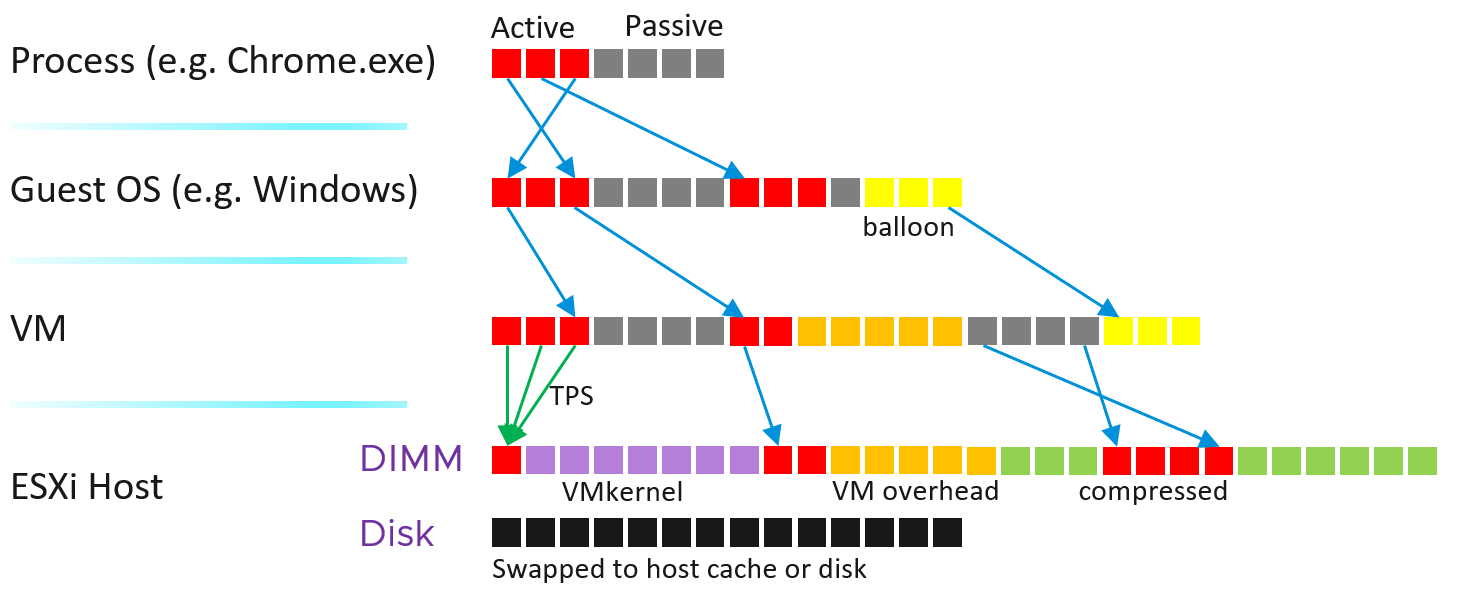
Yup, a few things:
-
Balloon did not map to physical layer. Notice there is no arrow on the yellow blocks
-
The physical memory is “shared” between VM and hypervisor own processes, meaning you need to manage them as one. Sum their utilization to form the total consumption.
-
At the physical layer, there can be host cache and tiered memory, and not just DIMM. If you use memory tiering, be on guard when active memory metric crosses 50%. The NVMe latency should be low also.
-
Just to be complete, the mapping may not be to the closest DIMM. You can have NUMA effect.
The VM Monitor for each VM maps the VM pages to the ESXi pages[^17]. This page mapping is not always 1:1. Multiple VM pages may point to the same ESXi pages due to transparent page sharing. On the other hand, VM page may not map to ESXi page due to balloon and swapped. The net effect is the VM pages and ESXi pages (for that VM) will not be the same, hence we need two sets of metrics.
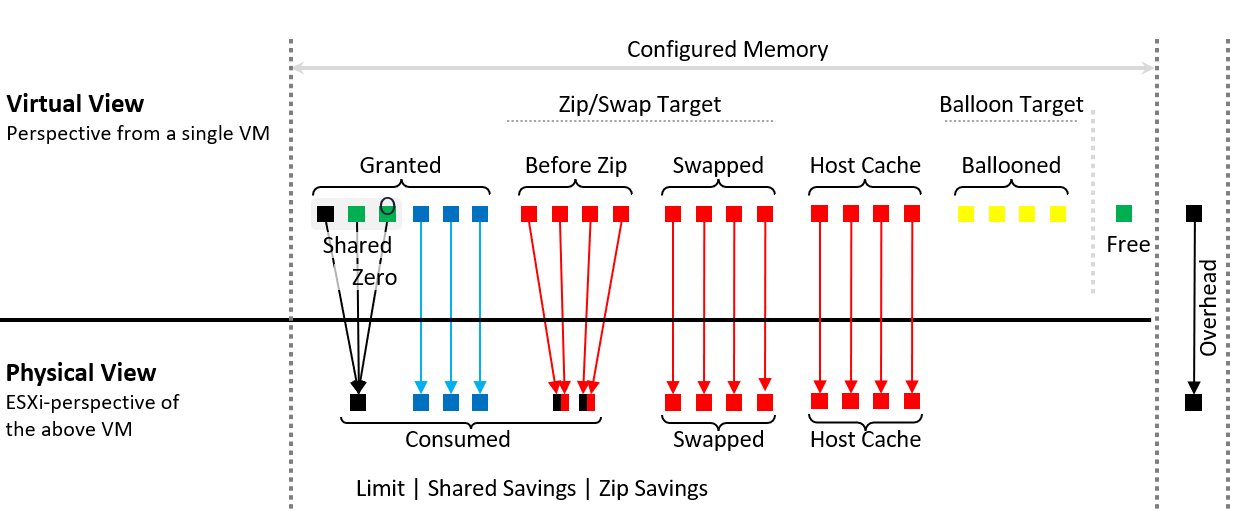
Let’s zoom into the key metrics that form a single VM.
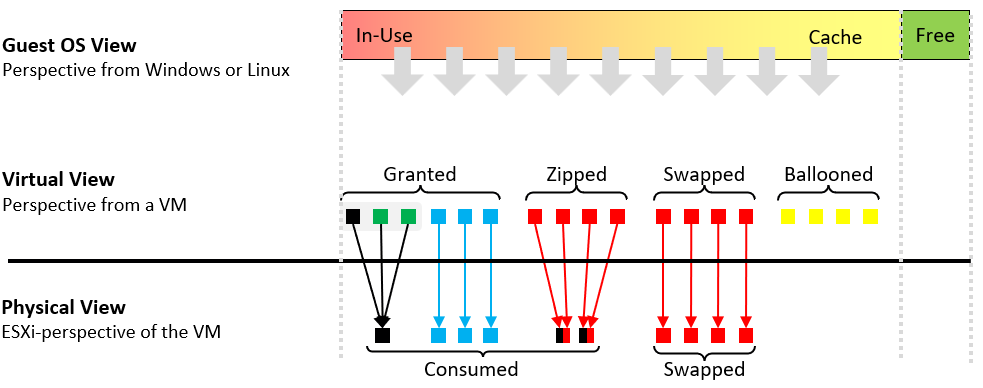
Take note the difference between the VM perspective and the ESXi perspective.
-
The VM looks at the “input”, while ESXi looks at the “output”. For example, VM metrics will report 3 pages being shared, while ESXi will report 1 page of the result shared page.
-
Balloon does not exist at physical view as the page has been removed. It’s not pointing to any block in the ESXi memory address space.
Further reading: vSphere Resource Management technical paper.
Guest OS vs VM
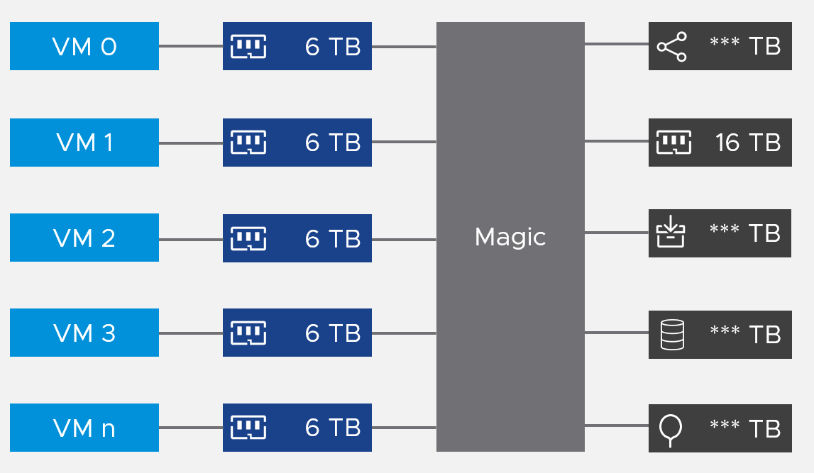
Both come with dozens of metrics. Compared with Guest OS such as Windows, can you notice what’s missing and what’s added?
The following diagram compares the memory metrics between VM and Guest OS,
Guest OS and VM metrics do not map to each other. Neither the kernel nor the Guest OS have full visibility into each other.
Right off the bat, you will notice that popular metrics such as Consumed, Shared, and Reservation do not even exist in Windows.
| Type | Guest OS Metric | VM Metrics |
|---|---|---|
| Contention | Paging | None |
| None | Latency | |
| Utilization | In Use | None |
| Cache | None | |
| Free | None | |
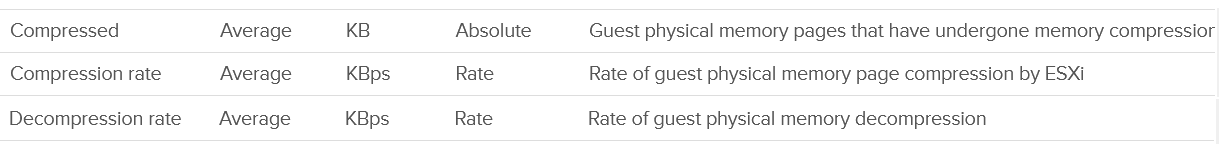
| Compressed | None | |
| None | Swapped or Compressed |
ESXi Host cannot see how the Guest OS manages its memory pages, how it classifies the pages as Use, Modified, Cache and Free. ESXi also cannot see the virtual memory (page file).
ESXi can only see when the Guest OS performs reads or writes. That’s why vSphere VM main metrics are basically what is active recently and what has been active. The first one is called Active, the second is called Consumed. All other metrics are about ESXi memory management, and not about VM memory utilization. VM memory utilization impacts ESXi memory management, but they are clearly not the same thing.
Example: Guest OS More Accurate
Let’s take an example with a simple Microsoft Windows server running Active Directory. It has 4 GB of memory as it’s just serving a small number of objects in the Singapore office lab. Look at the following table, where I compared the counter from inside the Guest OS and the VM memory active counter.
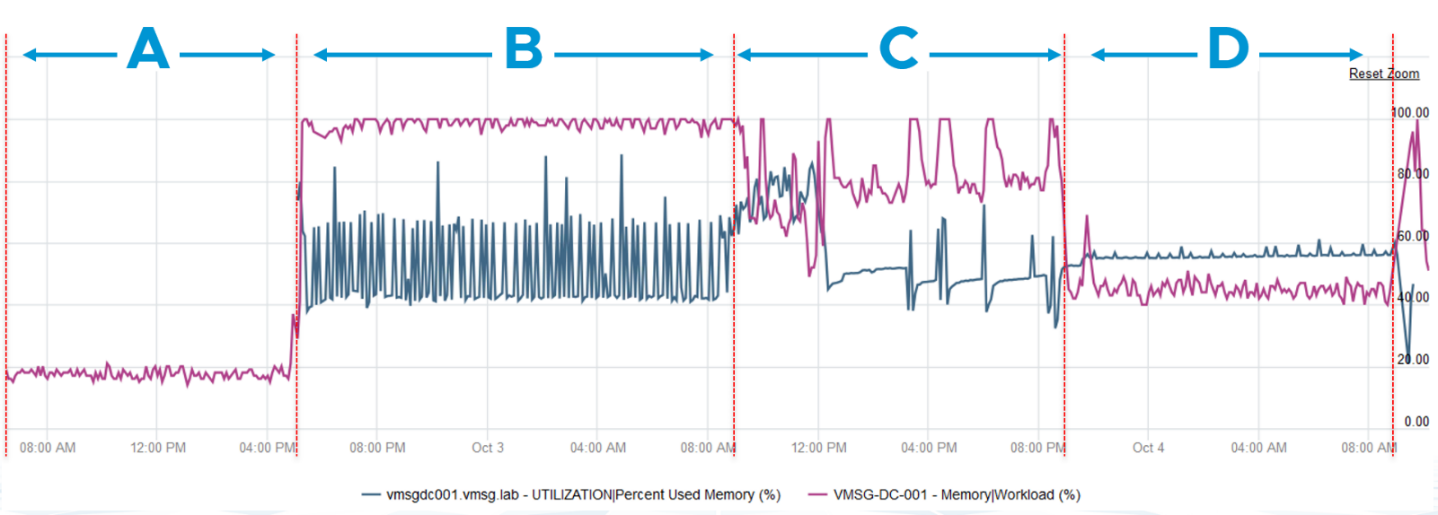
There are four periods above where I made changes inside Windows. Let’s step through them.
| Period | What happened |
| A | Microsoft AD server in normal running condition. vCenter is reporting low utilization, around 15-20%. Note vCenter users the Active metric, not Consumed. |
| B | I installed the VCF Operations agent, which is based on the open source Telegraf. This gives the Guest OS metric, which is shown in blue. The agent collects data every 5 minutes, hence the regular spike. So far so good. Notice the value from VM Active metric jumps to 100%. That’s fine, but then it stays at 100% for more than 12 hours. All I did was installing a small collection agent and that’s it. I actually got an alarm in vCenter, even though the VM does not need the RAM obviously. What happened here prove that the Active counter is based on sampling, and that sampling could be wrong. |
| C | The next morning, I decided to generate some load as the pattern does not change at all. Since Windows has not been patched for a long time, I started Windows patch. The entire process is mostly downloading and installing, which last for several hours. The two metrics show no correlation at all. |
| D | After several hours, the entire Windows update process is completed. |
Example: VM More Accurate
Let’s now look inside the VM. I will use another VM to show a different example. This time around, I will take an idle VM so we can see how the metrics behave. An idle VM will have minimal or 0 activity.
You can see that this Windows Server 2016 VM has 16 GB, but 0 GB is active. It is expected as we know the Guest OS is idle as nothing is installed. vCenter is showing the data correctly. So far so good….
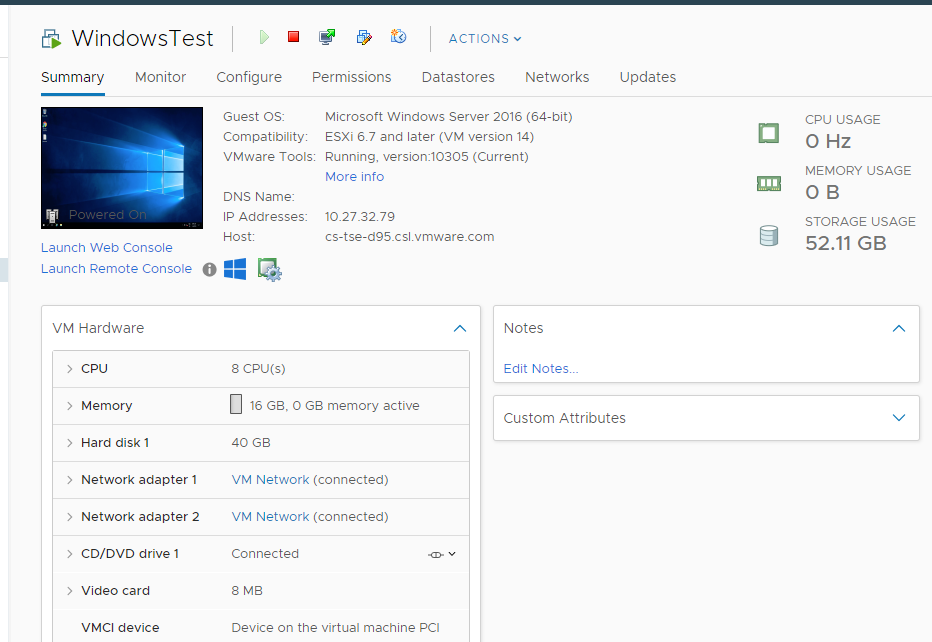
What do you think you will see inside Windows?
Will the Windows In Use counter show that it’s using 0 GB or somewhere near there? You know that it won’t show 0 GB as it’s impossible that any OS does not use any memory while it’s running. So what number will the In Use counter show?
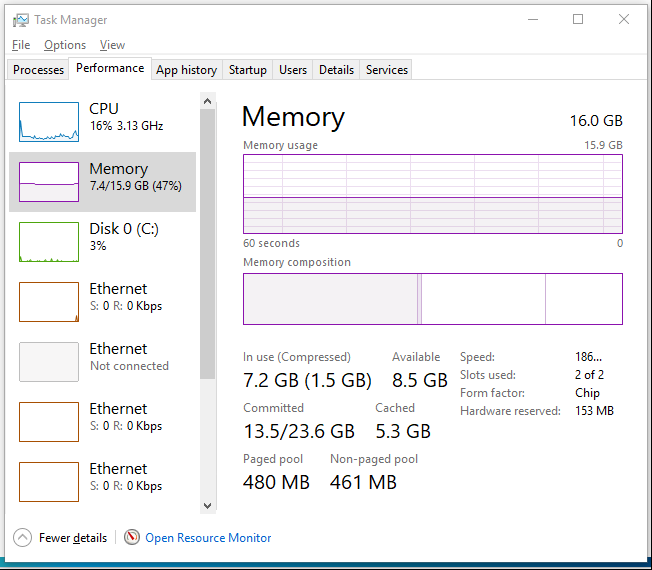
It’s showing 7.2 GB! That’s nowhere near 0%.
Look at the chart. What do you notice?
It portrays that it has been constantly or actively using that much of memory. In reality, we know it’s idle because ESXi is the one doing the actual reading and writing. The other proof that it is idle is Windows actually compressed 1.5 GB of this 7.2 GB.
One possible reason why Windows is showing high usage when there is none is applications that manage their own memory. These applications will ask for the memory upfront in 1 contiguous block. You can see in the example below:
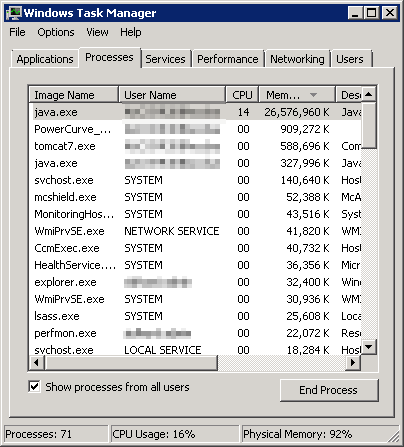 | You can see that java.exe takes up 26 GB. JVM (Java Virtual Machine) manages that memory and Windows can’t see inside this block. Windows sees the entire block as used and committed, regardless of the application actually uses it or not. BTW, the above is taken from old blog article of Manny Sidhu. The blog no longer available, hence I could not provide the link. |
|---|
I hope the above simple experiments shows that you should use the right counter for the right purpose.
VM
Just like the case for CPU, some metrics are for the kernel consumption, not your operations.
Overview
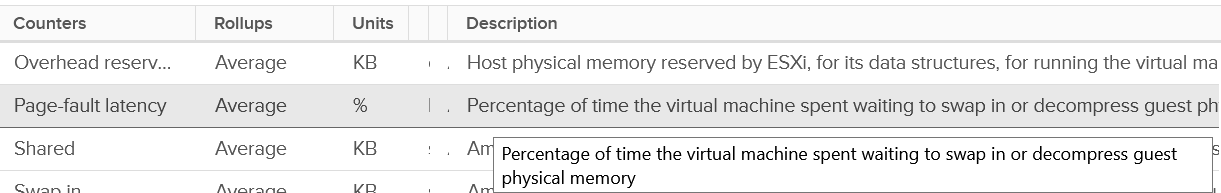
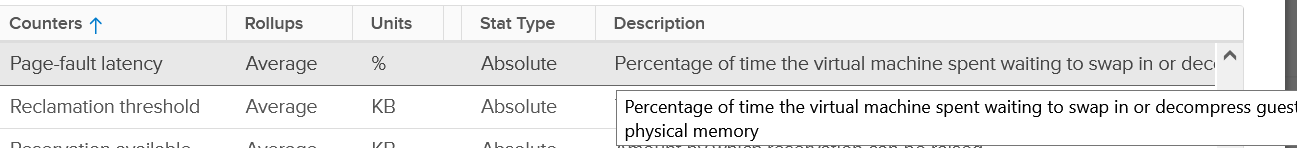
For performance use case, the only counter tracking actual performance is Page-fault Latency.
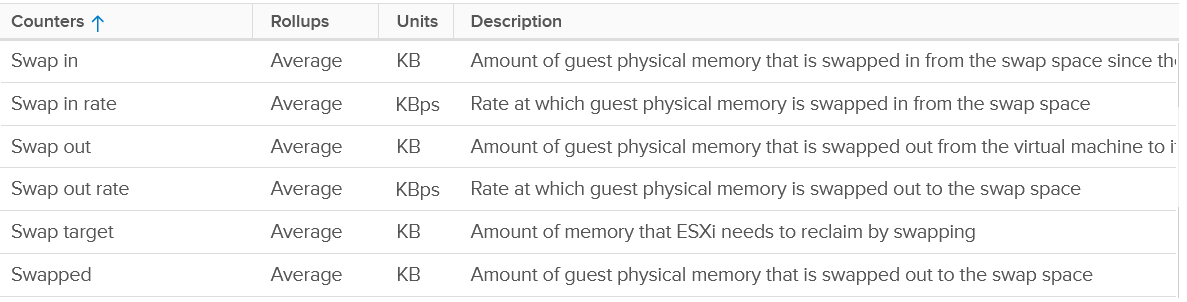
Next, check for swapping as it’s slower than compressed. You get 6 metrics for it
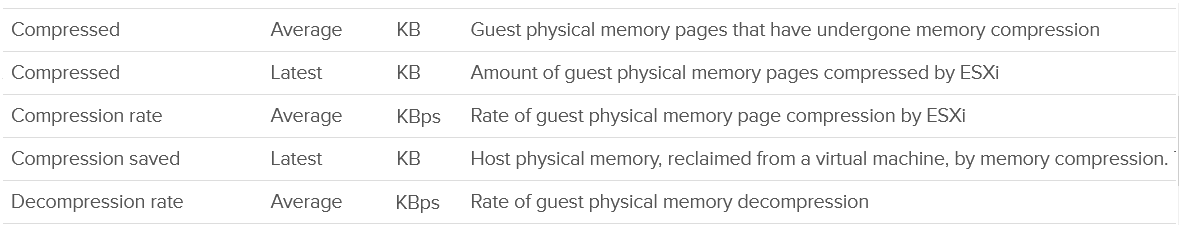
Next is compressed
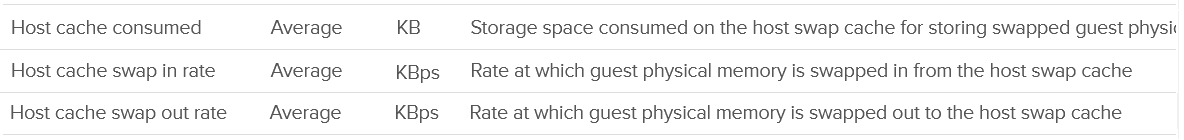
Host Cache should be faster than disk (at least I assume you designed it with faster SSD), so you check it last.
Lastly, there is the balloon.
Wait! Where is the Intel Optane memory metrics?
It does not exist yet, as that’s supposed to be transparent to ESXi.
Performance is essentially the only use case you have at VM level. For Capacity, you should look at Guest OS. The VM capacity metrics serve as input to the host capacity and are used in determining the VM memory footprint (e.g. when migrating to another ESXi).
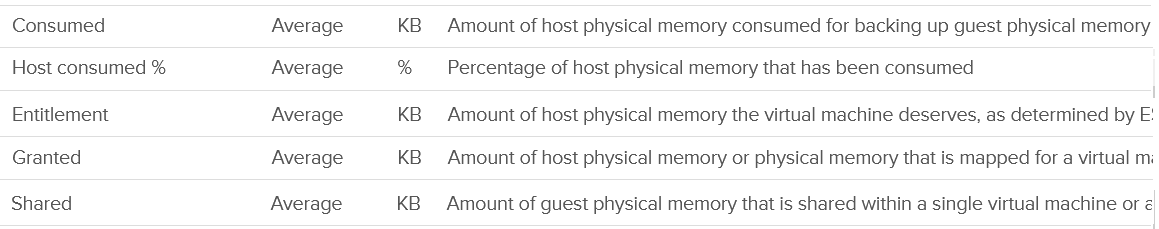
You’ve got 5 metrics, with consume being the main one.
I’m going to add Active next, although I don’t see any use case for it. It’s an internal counter used by the kernel memory management.
Lastly, you get the shared pages and 0 pages.
Now that we’ve got the overview, let’s dive into the first counter!
“Contention” Metrics
I use quote because the only true contention counter is latency. The second reason is VCF Operations has a metric called Contention[^18], which is actually vCenter counter called latency.
Latency
Memory Latency, aka "Page-fault latency" is tracking the amount of time a vCPU spends waiting on the completion of a page fault. Its value is mostly swap wait, with a bit of page decompression / copy-on-write-break. The counter is called %LAT_M in esxtop.
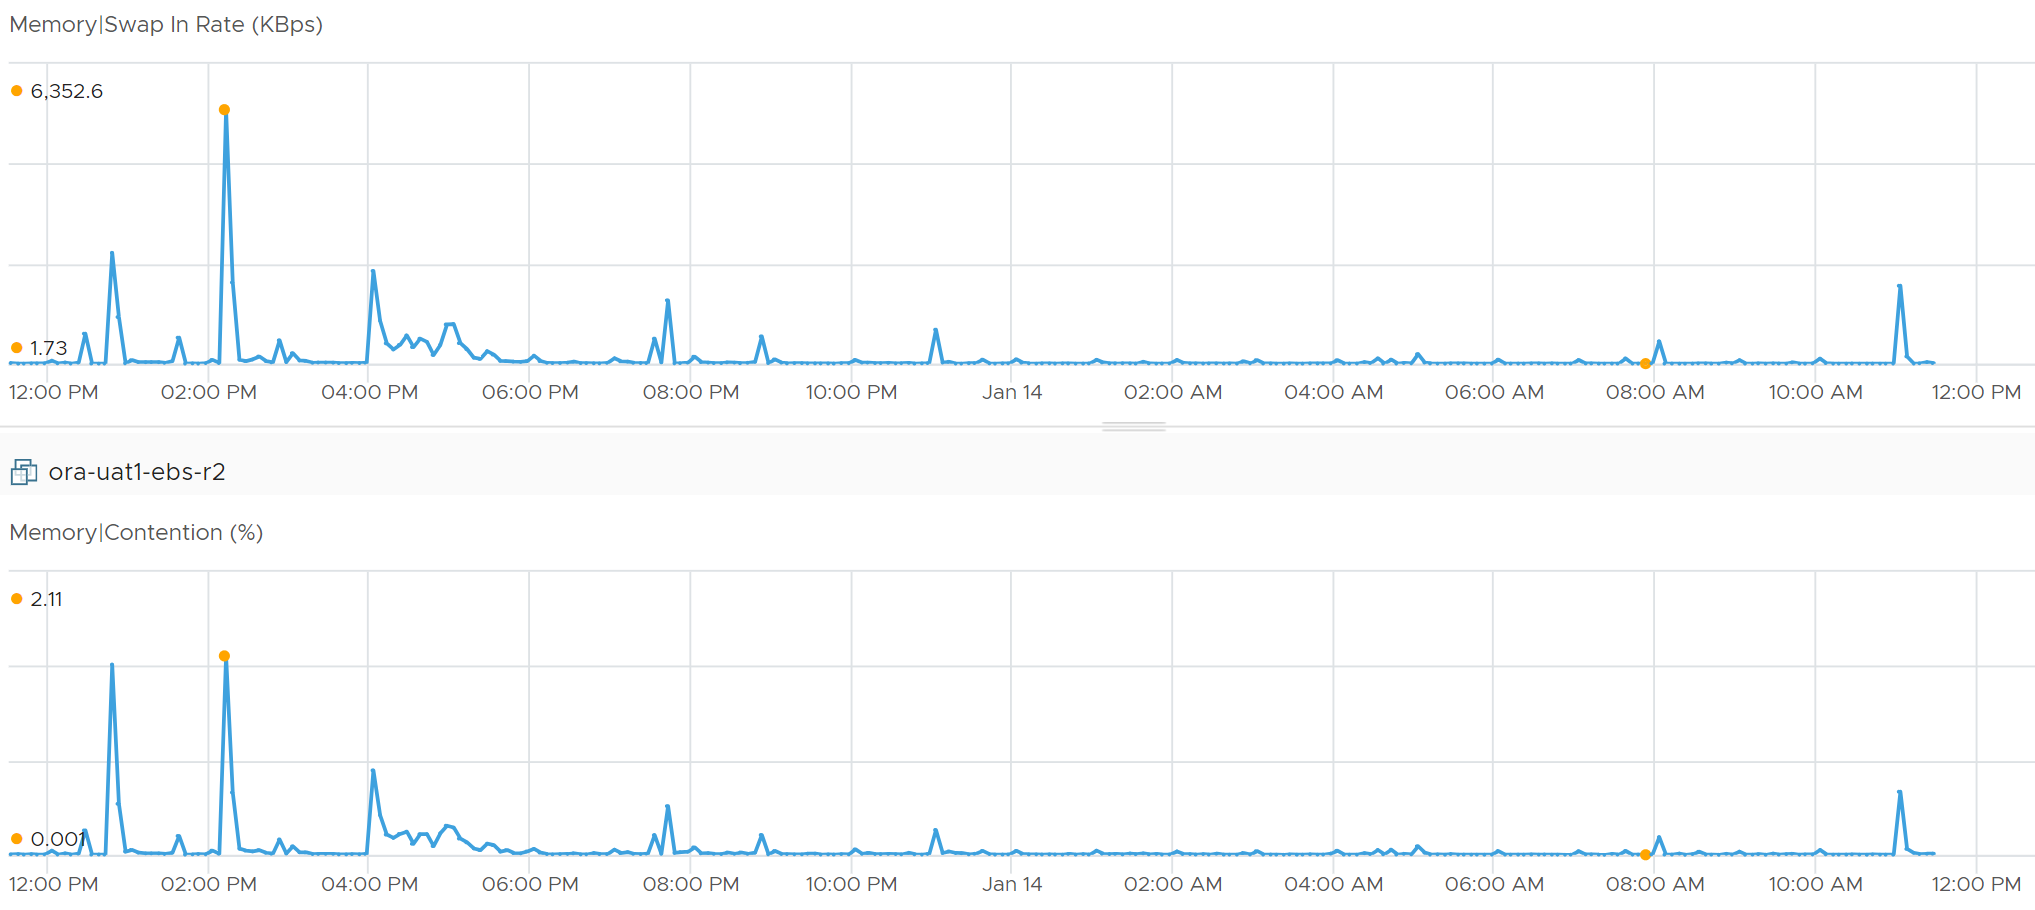
The latency metric is highly corelated with the swap-in rate.
This is the only performance counter for memory. Everything else does not actually measure latency. They measure utilization, because they measure the disk space occupied. None captures the performance, which is how fast that memory page is made available to the CPU.
Consider the hard disk space occupied. A 90% utilization of the space is not slower than 10%. It’s a capacity issue, not performance.
If a page is not in the physical DIMM, the VM has to wait longer. It could be in Host Cache, Swapped or Compressed. It will take longer than usual. vSphere tracks this in 2 metrics: CPU Swap Wait and RAM Latency.
-
CPU Swap Wait tracks the time for Swapped In.
-
RAM Latency tracks the percentage of time VM waiting for Decompressed and Swapped In. The RAM Latency is a superset of CPU Swap Wait as it caters for more scenarios where CPU has to wait. VCF Operations VM Memory Contention metric maps to this.
Latency is >1000x lower in memory compared to disk, as it's CPU basically next to the CPU on the motherboard. Time taken to access memory on the DIMM bank is only around 200 nanoseconds. Windows/Linux does not track memory latency. The closest counter is perhaps page fault. The question is does page fault includes prefetch? If you know, let me know please.
This counter has the effect of reduced value of the Compressed metric and/or Swapped metric, and increased the value of Consumed & Granted.
Latency does not include balloon as that’s a different context. In addition, the hypervisor is not aware of the Guest OS internal activity.
Actions you can do to address high value:
-
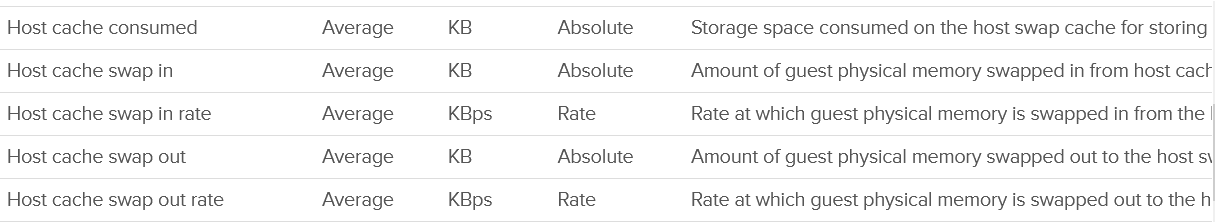
Store vswp file on higher throughput, lower latency storage, such as using Host Swap Cache.
-
Increase memory shares and/or reservation to decrease amount of swapping. If the VM belongs to a resource pool, ensure the resource pool has sufficient for all its VMs.
-
Reduce assigned memory. By rightsizing, you reduce the size of memory reclamation, hence minimizing the risk.
-
Remove VM Limit.
-
Unswap the swapped memory. You cannot do this via API, but you can issue the command manually. Review this article by Duncan Epping and Valentin Bondzio.
-
If possible, reboot the VM as part of regular maintenance. This will eliminate the swap file, hence avoiding future, unexpected swap wait on that swapped page. Note this does guarantee the same page to be swapped out again.
Best Practice
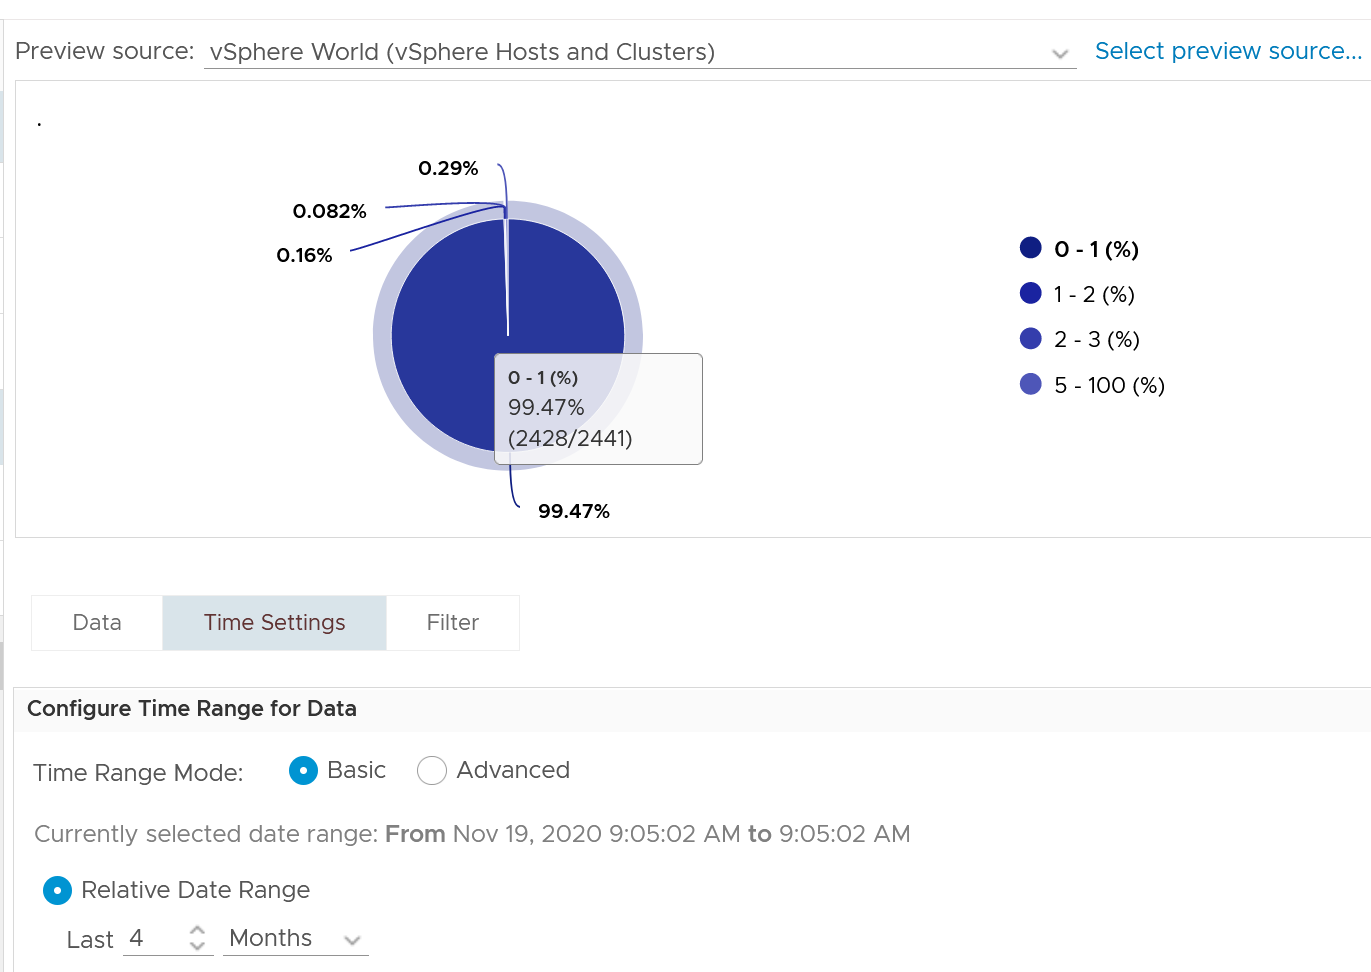
In an environment where you do not do memory overcommit and place limit, the chance of hitting memory contention will be basically 0. You can plot the highest VM Memory Contention counter in all clusters and you will basically see a flat line. That would be a lot of line charts, so I’m using a pie chart to analyze 2441 VM in the last 4 months. For each VM, I took the highest value in the last 4 months. Only 13 VM had its worst VM Contention above 1%.
Balloon
Balloon is an application (kernel driver to be precise) running inside the Guest OS, but it can take instruction from the kernel to inflate/deflate.
When it receives an instruction to inflate, it asks the Guest OS to allocate memory to it. This memory in the Guest OS is not backed up by physical memory in ESXi, hence it is available for other VMs. When ESXi is no longer under memory pressure, it will notify the Balloon to release its requested page inside Guest OS. This is a proactive mechanism to reduce the chance of the Guest OS doing paging. Balloon will release the page inside the Guest OS. The Balloon counter for the VM will come down to 0.
It is the Guest OS that initiates memory reallocation. Therefore, it is possible to have a balloon target value of 0 and present balloon value greater than 0. The counter Balloon Target tracks this target, so if you see a nonzero value in this counter, it means that the hypervisor has asked this VM to give back memory via the VM balloon driver.
Just because Balloon asks for 1 GB of RAM, does not mean ESXi gets 1 GB of RAM to be freed. It can be less if there is TPS.
Guest OS will start allocating from the Free Pages. If insufficient, it will take from Cache, then Modified, then In Use.
To use ballooning, Guest OS must be configured with sufficient swap space.
How much will be asked depends on Idle Memory Tax. I do not recommend playing with this setting.
Performance Impact
Balloon by itself does not cause performance problem. What will cause performance is when the ballooned page is requested by Windows or Linux. The following shows a VM that is heavily ballooned as limit was imposed on it. Notice the actual performance happens rarely.
The higher the value is for balloon, swapped, and compressed, the higher the chance of a performance hit happening in the future if the data is requested. The severity of the impact depends on the VM memory shares, reservation, and limit. It also depends upon the size of the VM's configured RAM. A 10-MB ballooning will likely have more impact on a VM with 4 GB of RAM than on one with 512 GB.
How high?
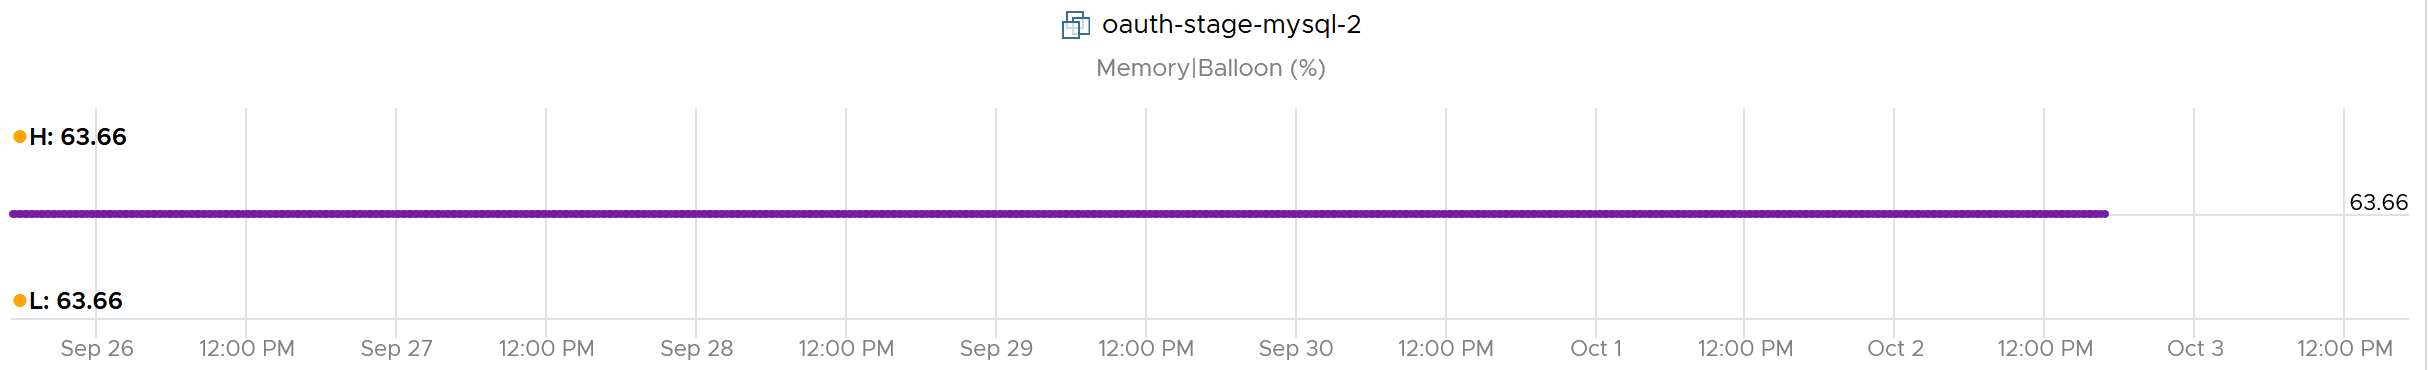
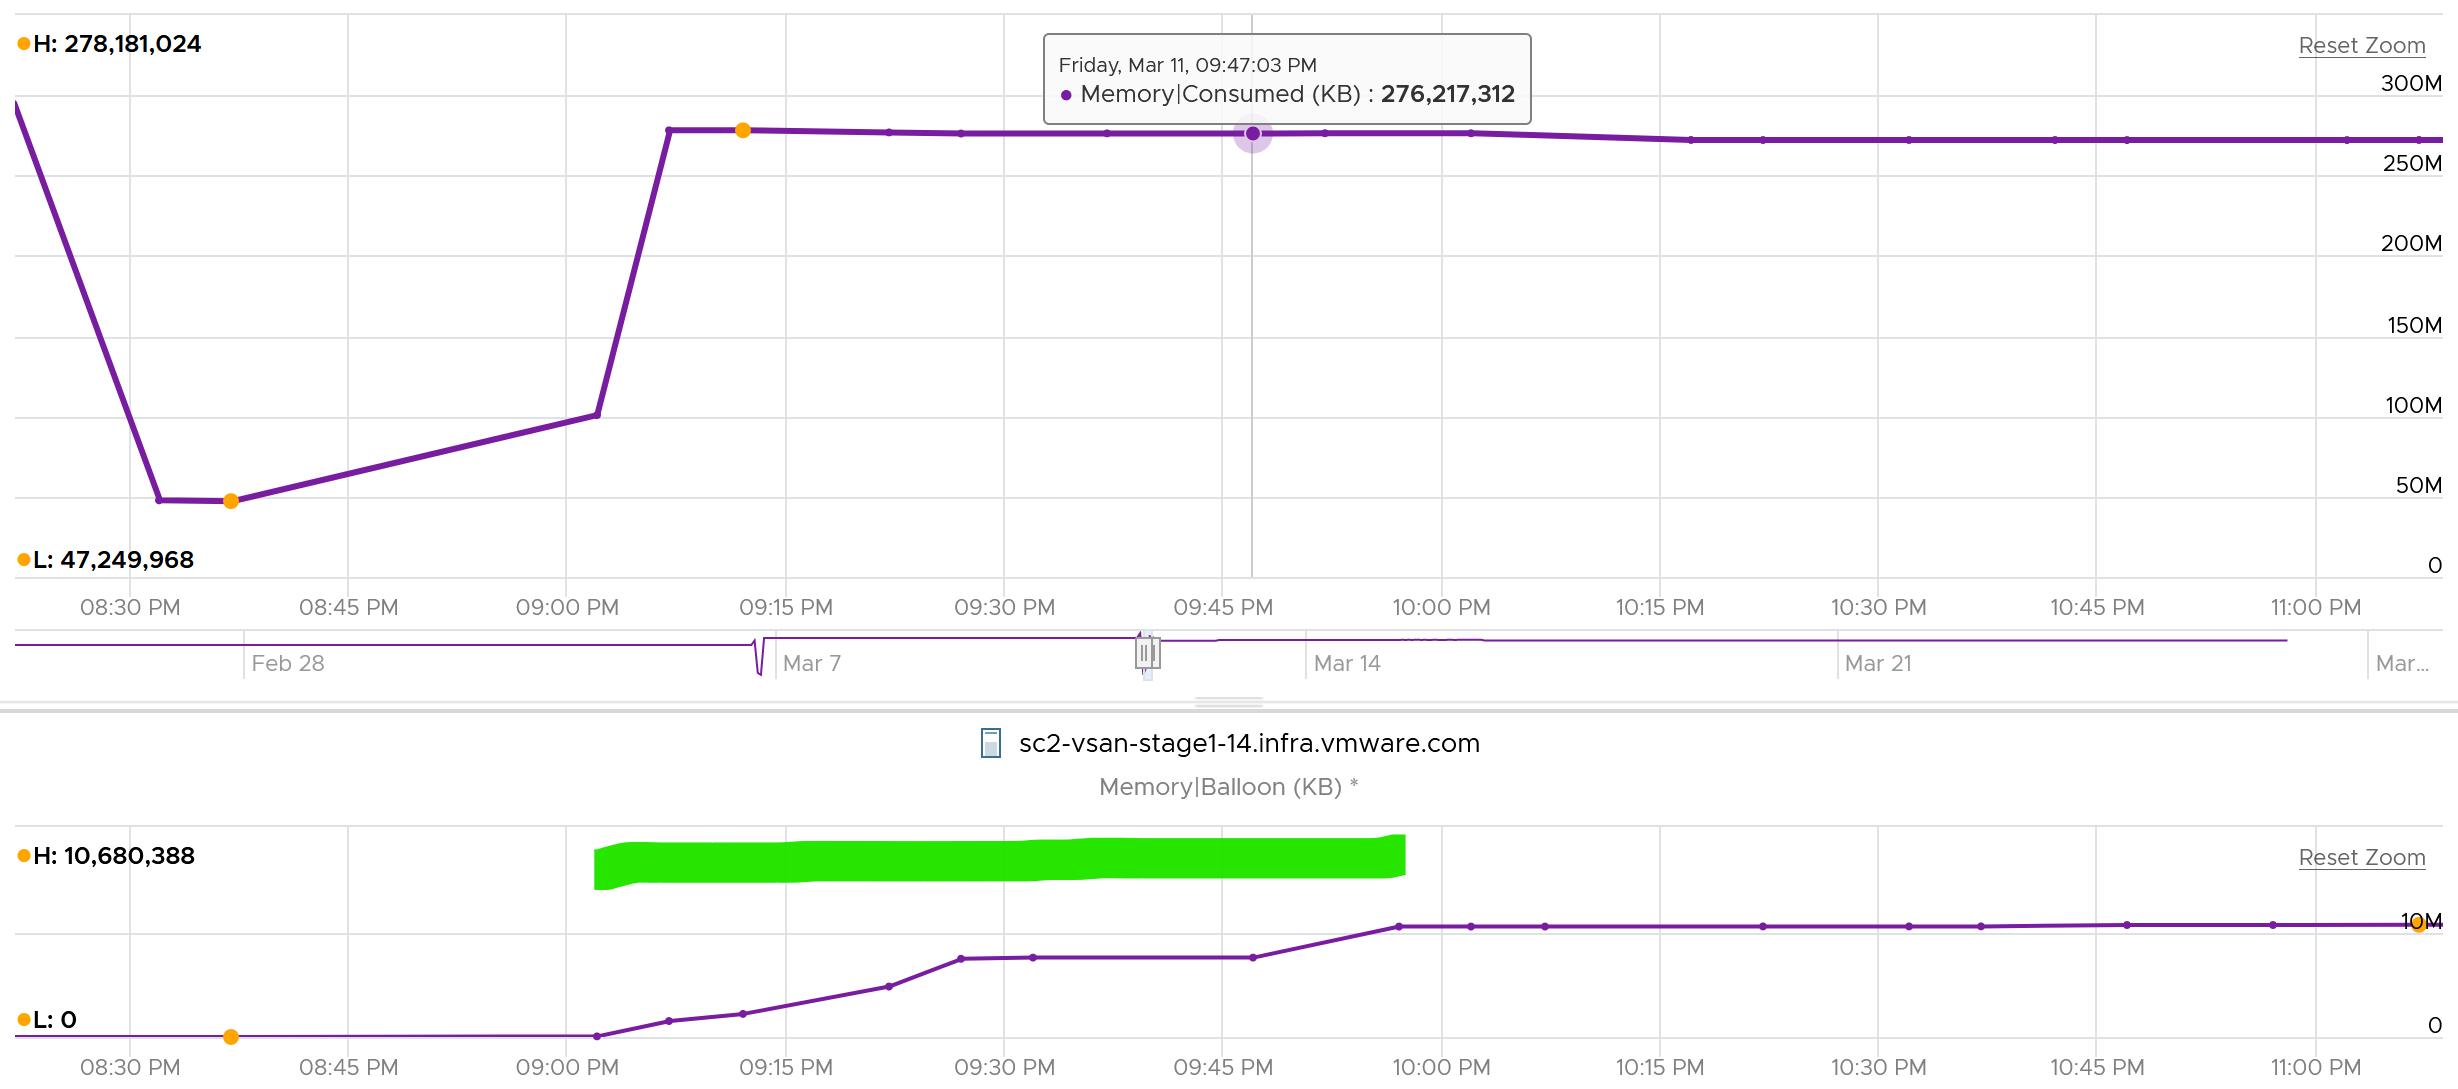
Let’s take a VM and plot its value over time. The VM is configured with 16 GB memory. As you can see, the value in the last 4 weeks is a constant 16 GB.
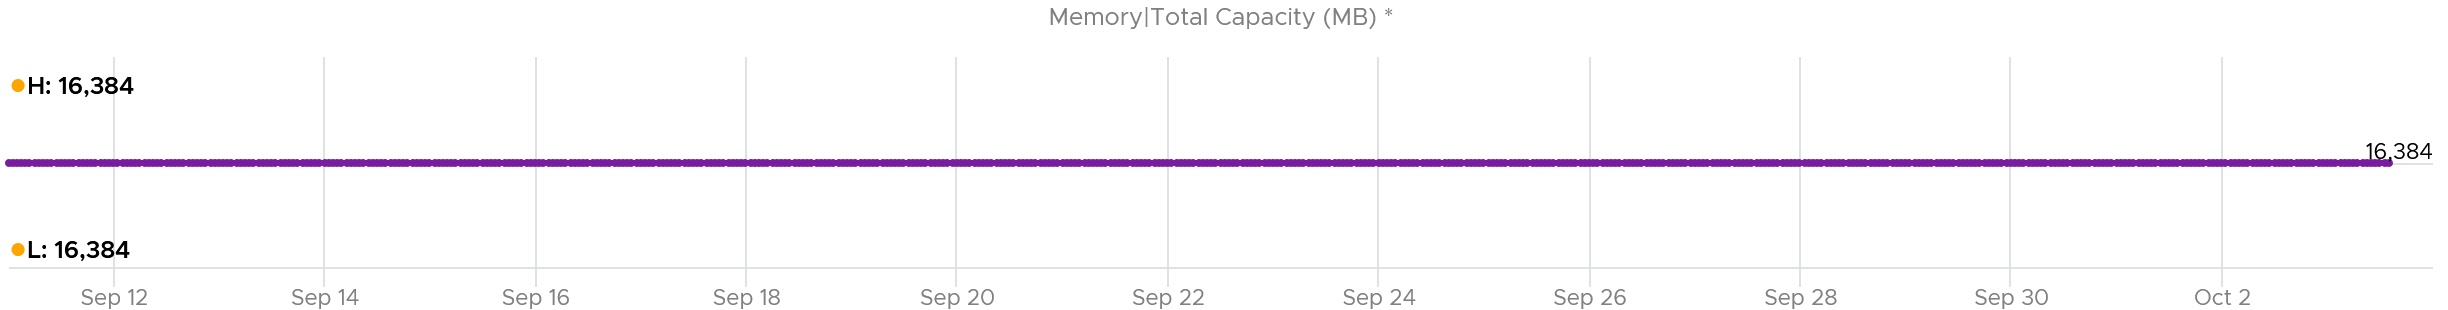
The line is a perfect flat. Both the Highest value and Lowest value show 16,384 MB.
The VM was heavily ballooned. 63.66% of its memory was reclaimed. That’s a whopping 10,430 MB!
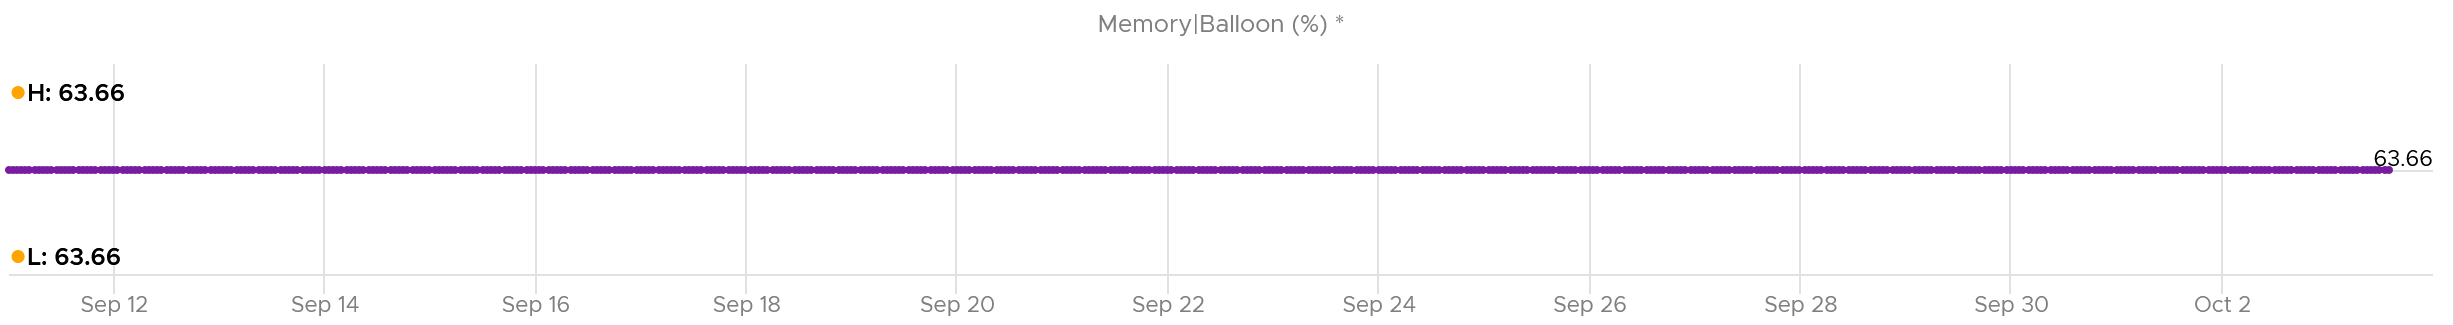
Notice something strange.
The Ballooned did not change at all for 4 weeks.
That likely means the Guest OS is not active. It never needs any of those 10+ GB that was ballooned out.
So Guest was playing with the remaining 6 GB. It never page in those pages.
So what do you expect if we plot Granted + Swapped + Compressed?
You got it. A flat line.
Capacity Impact
Balloon is a memory request from ESXi. So it’s not part of the application. It should not be included in the Guest OS sizing, hence it’s not part of reclamation.
Balloon impacts the accuracy of Guest OS sizing. However, there is no way to measure it.
When Balloon driver asks for pages, Guest OS will allocate, resulting in In Use to go up. This is because the balloon driver is treated like any other processes.
If the balloon driver page comes from Free, then we need to deduct it from In Use.
If the page comes from In Use, then it gets tricky as the value of In Use does not change. The Guest OS pages out, so we need to add Page Out or Cache.
Swap + Compress
Swap and Compress go hand in hand as the block that cannot be compressed go into swapped. The size of a memory page or block is only 4 KB. When the compression does not result in savings below 2 KB, then it makes no sense to compressed and the page is moved to swapped file.
There are 2 levels of compression (4:1 and 2:1), so a 4 KB page may end up as 1 KB or 2 KB. The reason there is no 3:1 compression
If the compression result is less than that, the page will be swapped instead as that’s a cheaper operation. So it’s completely possible to have 0 swapped as all the pages were compressed instead.
Large page (2 MB) is not compressed directly. Instead, it will be split into 4 KB page first.
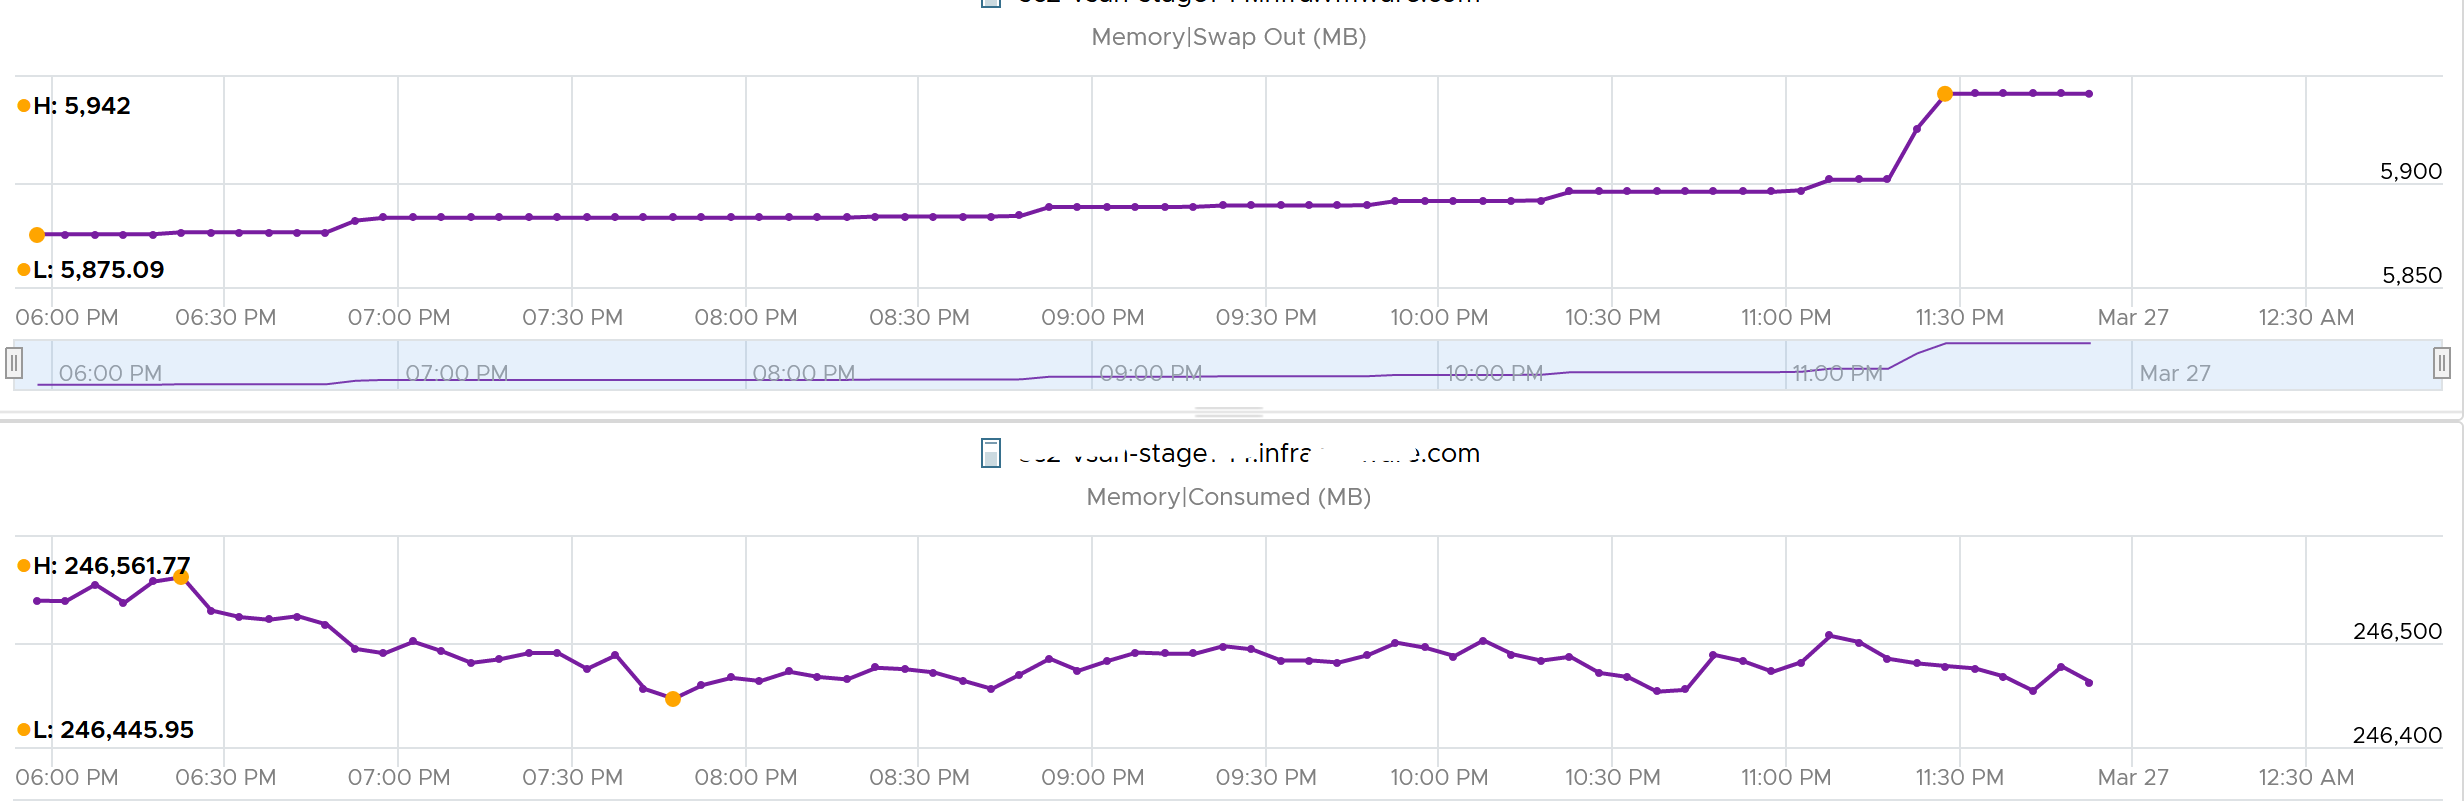
The following screenshot shows how the 2 counters moved in tandem.
The above are the main metrics that you should track. vSphere provides additional visibility as swap and compress are complex process.
Transition
Read the following carefully, as there will be a quiz after this.
| Input | This is the number of pages that will be subjected to compression and swapping. It’s not the number of pages that was processed already. The metric is called Swap Target. Think of it as Compress-Swap Target as the page that cannot be compressed is swapped. |
| Process | You need metrics to track the progress as it’s happening. This complements the result as it covers how much memory is compressed or swapped at any given period. A 10 MB compressed in 1 second is different to 10 KB compressed over 1000 seconds. Both results in the same amount, but the problem is different. One is an acute but short fever; the other is low grade but persistent fever. You don’t want neither, but good to know what exactly you’re dealing with. This is the rate of
The In and Out can happen at the same, as they typically involve different pages. You can have 10 MB being decompressed and another 10 MB being compressed. Your swap file size is unchanged but the content has changed. This is why Swapped is not Swapped In – Swapped Out. Swap-out does not mean there is contention. If you are lucky, the page being swapped is not required. However, swap out means the ESXi was under memory pressure or the VM hit a limit. Swap-in means there is contention. The page was called for, hence it was brought in. Plot them together and you will see a high correlation. Swap-in doesn't happen because there's memory pressure on the host. Swap-in just means there was memory pressure in the past and now the guest OS wants some of that data. |
| Output | You need a metric to track the result and the savings. For swap, 3 counters are provided
For compress, the compressed-in and compressed-out are not provided. You do get the savings from compression. |
Example
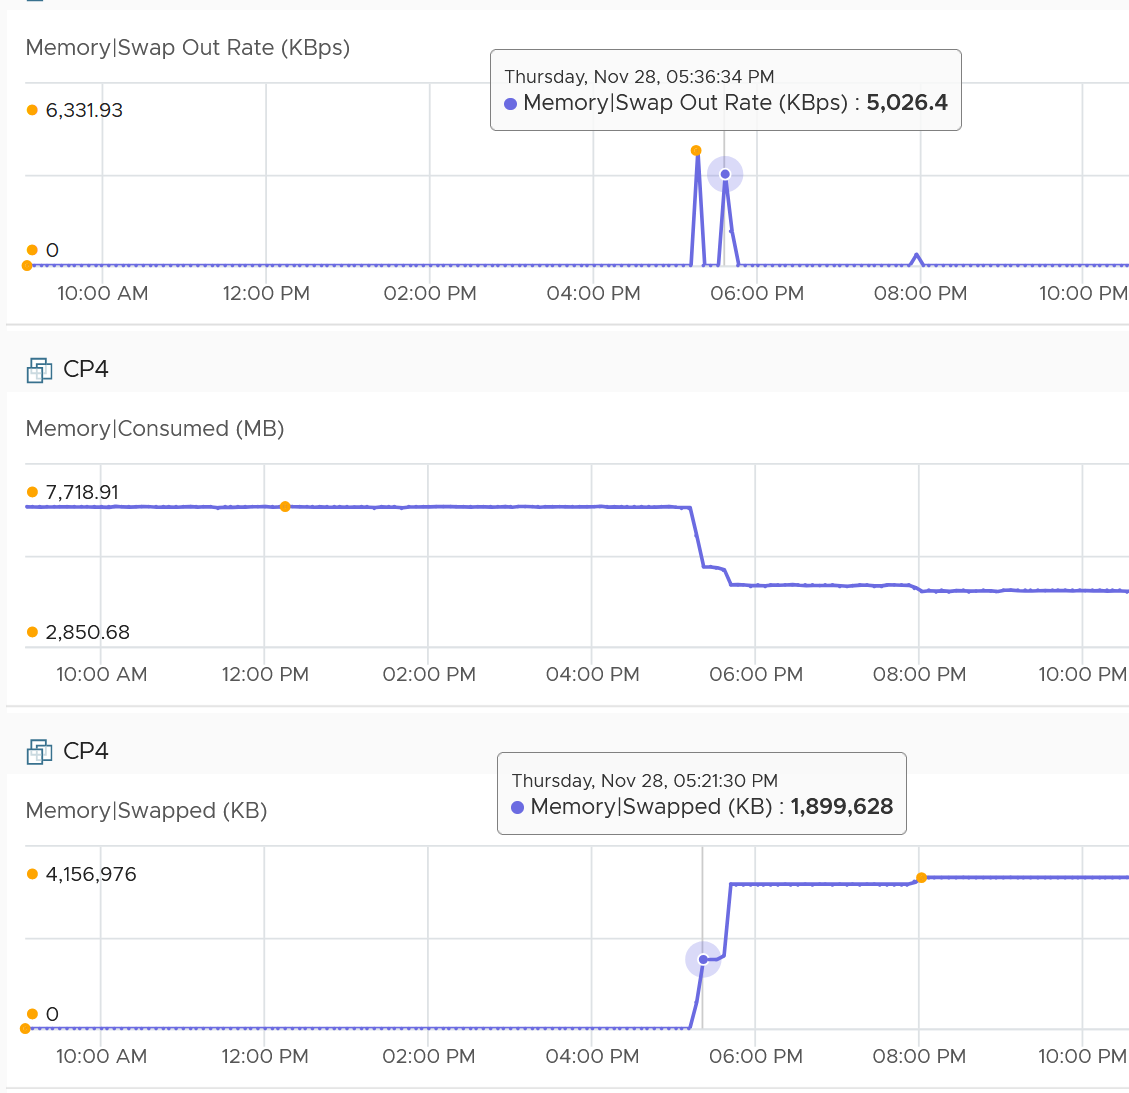
Swapped Out Rate was 6331.93 + 5026.4 + 1882.13 + 615.86. This gives a total of 13856. Since it’s sustained for 300 seconds, we multiply by 300 and then divide by 1024 to get the total of 4059 MB being swapped out. This is pretty close to the 4157 MB of Swapped.
There is no Swap In. The rate metric was showing 0 during the entire period.
Consumed drops by 4868 MB (7719 – 2851). There were other factors impacting it.
Quiz
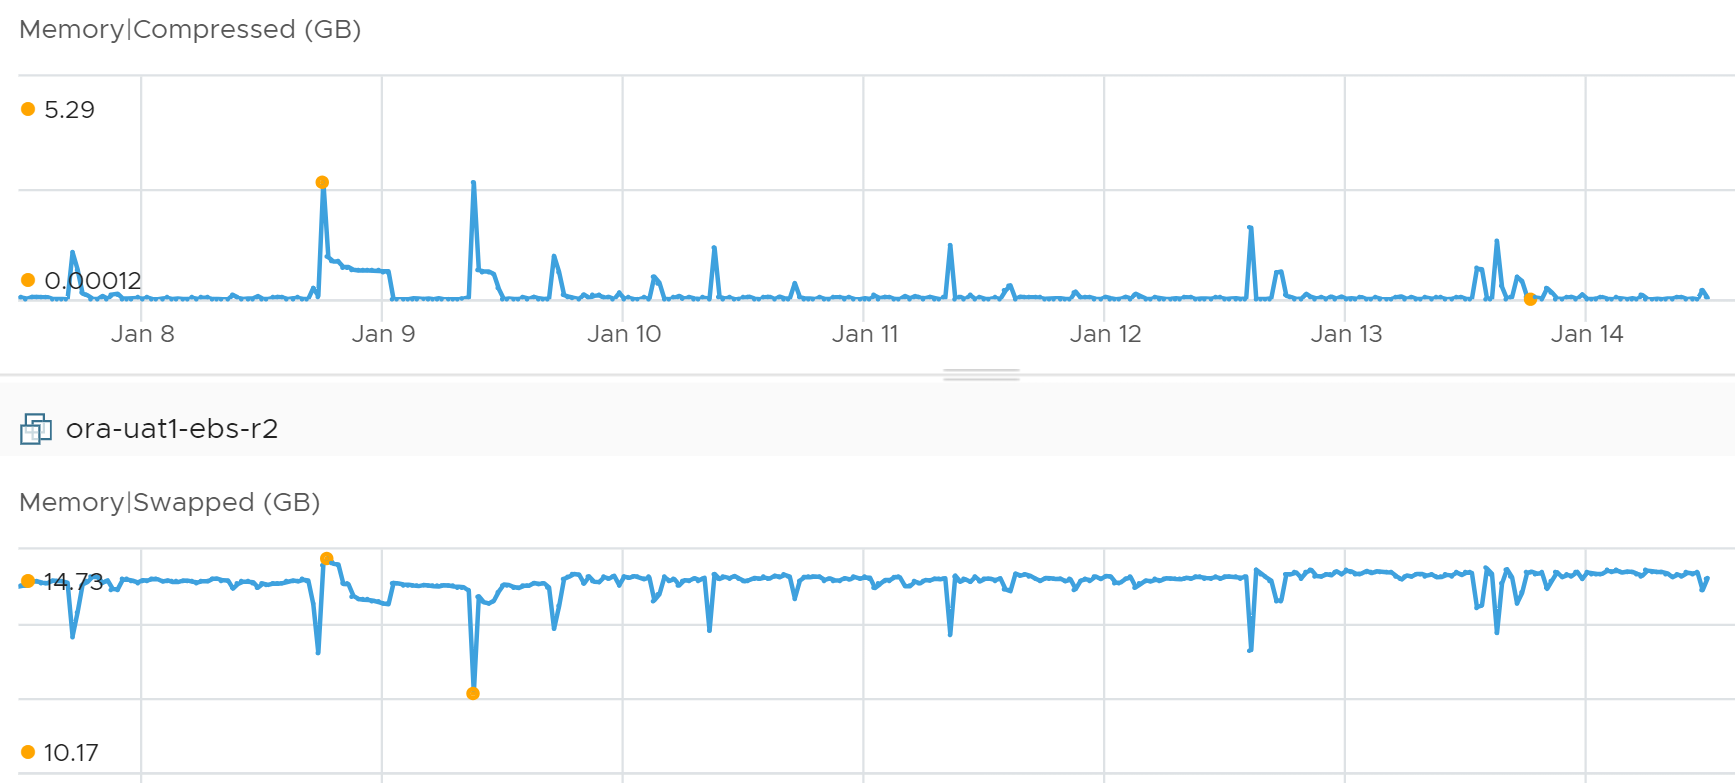
Explain why swap and compress move in opposite direction in the following chart.
This VM is configured with 64 GB of memory. So it experienced high amount of swapping and compressed in the last 7 days. It peaked at 20 GB, which is really bad.
Let’s plot consumed and granted. What’s your conclusion?
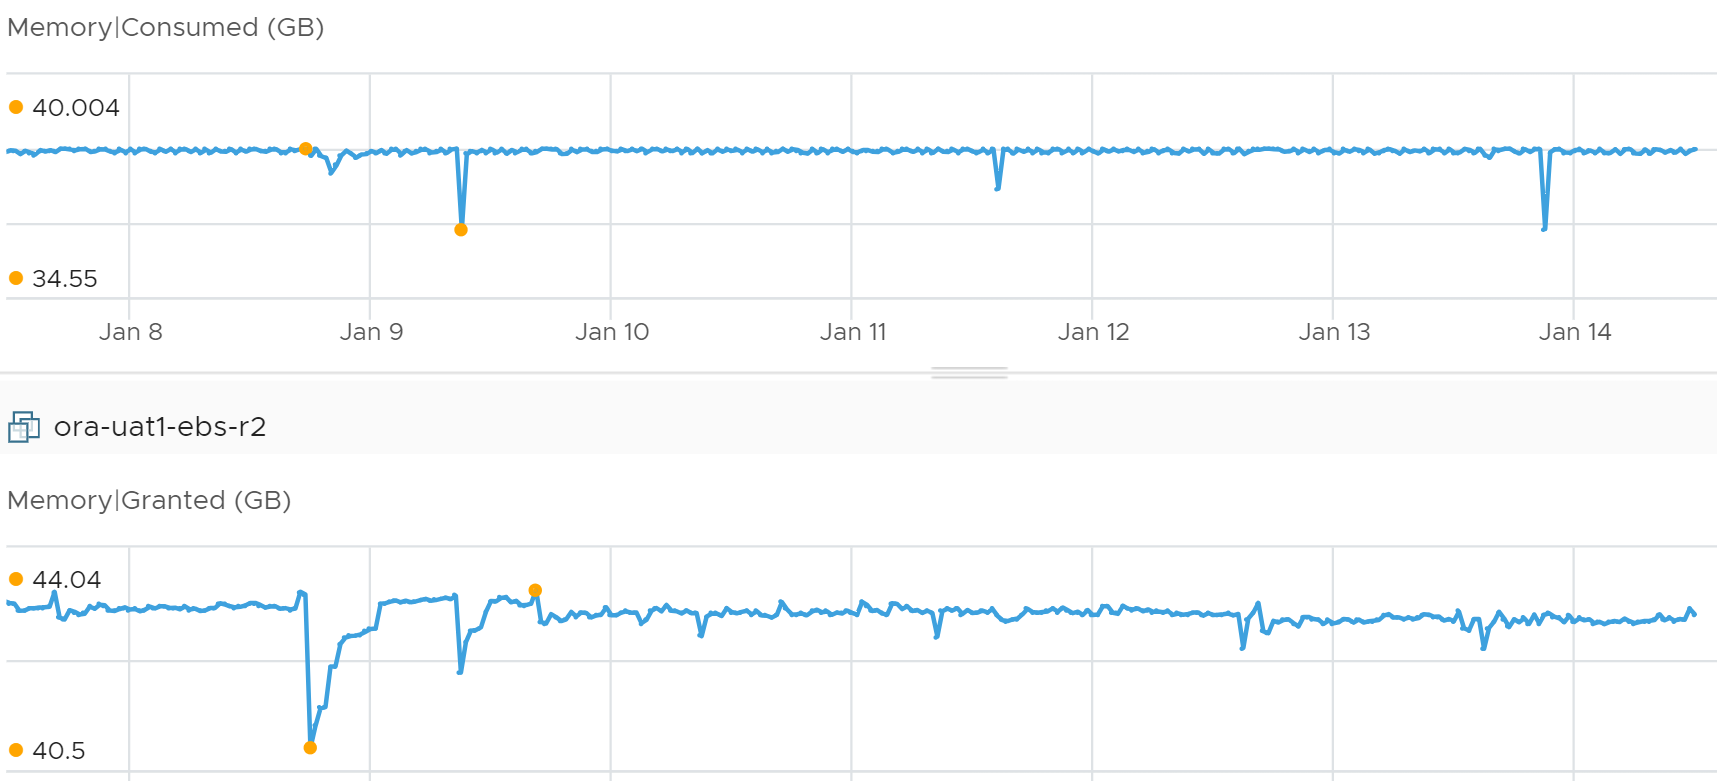
Why is consumed basically flat for 7 days?
Granted looks rather normal as it hovers above consumed, with some movement.
If you guess Limit, you’re right! Let’s plot all the counters together now.
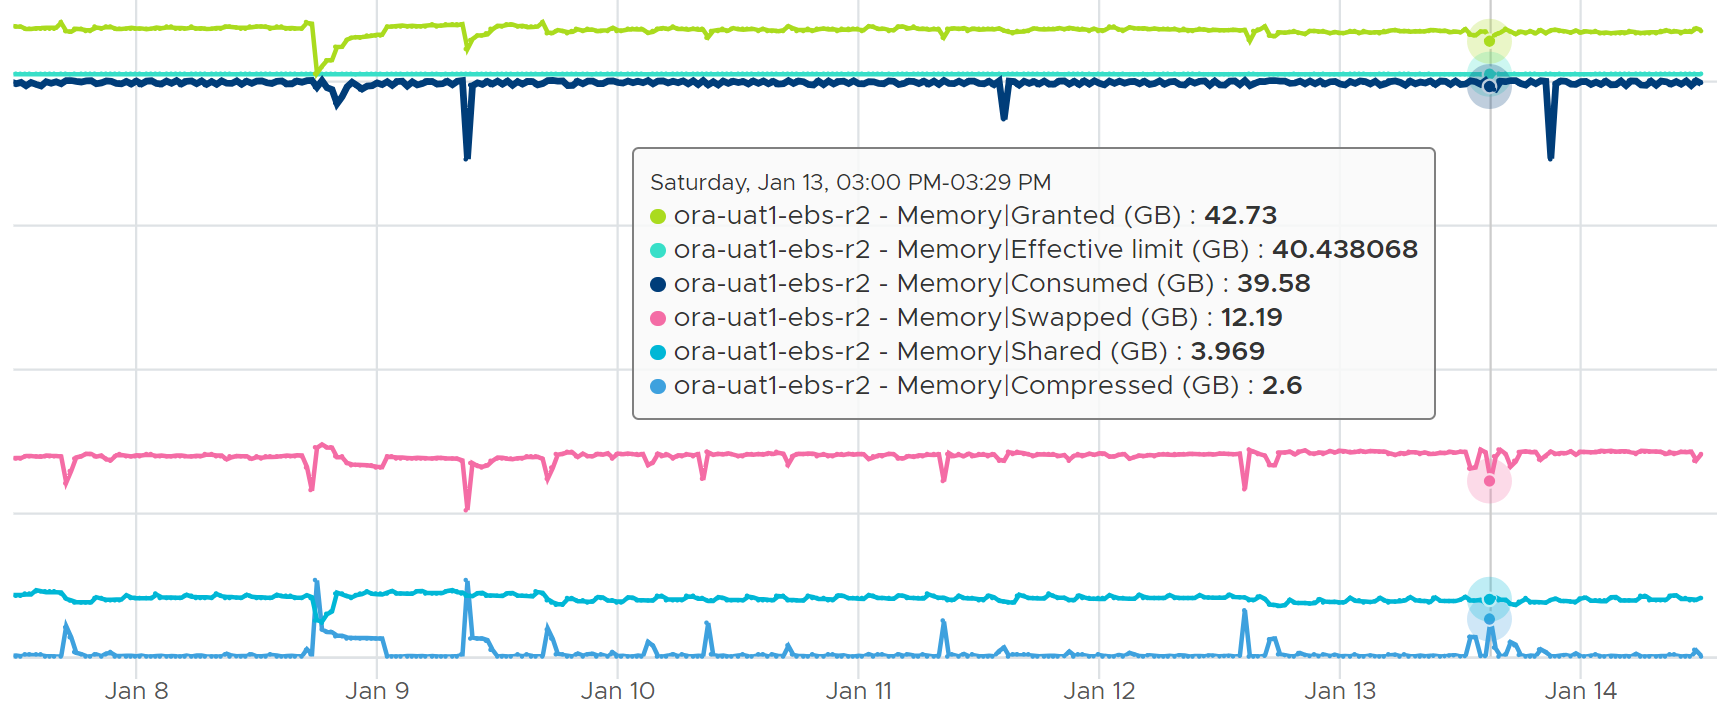
Because of Limit, Consumed can’t go above it. The tiny gap is the hypervisor overhead for this VM.
Now, because Guest OS is actively using pages, this results in movement in both directions. Some pages are brought in from swapped files. To make space, other pages are subjected to compression & swap decision.
Balloon
Compressed and Swapped are different from ballooning, as the hypervisor has no knowledge of the free memory inside the Guest OS. It will randomly compress or swap. As a result, any value in this counter indicates that the host is unable to satisfy the VM memory requirement. This can have potential impact on performance.
It is possible to have balloon showing a zero value while compressed or swapped are showing nonzero values—even though in the order of ESXi memory reclamation techniques, ballooning occurs before compression. This indicates that the VM did have memory pressure in the past that caused ballooning, compression, and swapping then, but it no longer has the memory pressure. These events could have happened at different time. Data that was compressed or swapped out is not retrieved unless requested, because doing so takes CPU cycles. The balloon driver, on the other hand, will be proactively deflated when memory pressure is relieved.
Limit
Does limit result in Balloon?
The answer is no. Why not?
Go back to the 4 layers of memory. They are at different level on memory management. Limit results in swapped or compressed.
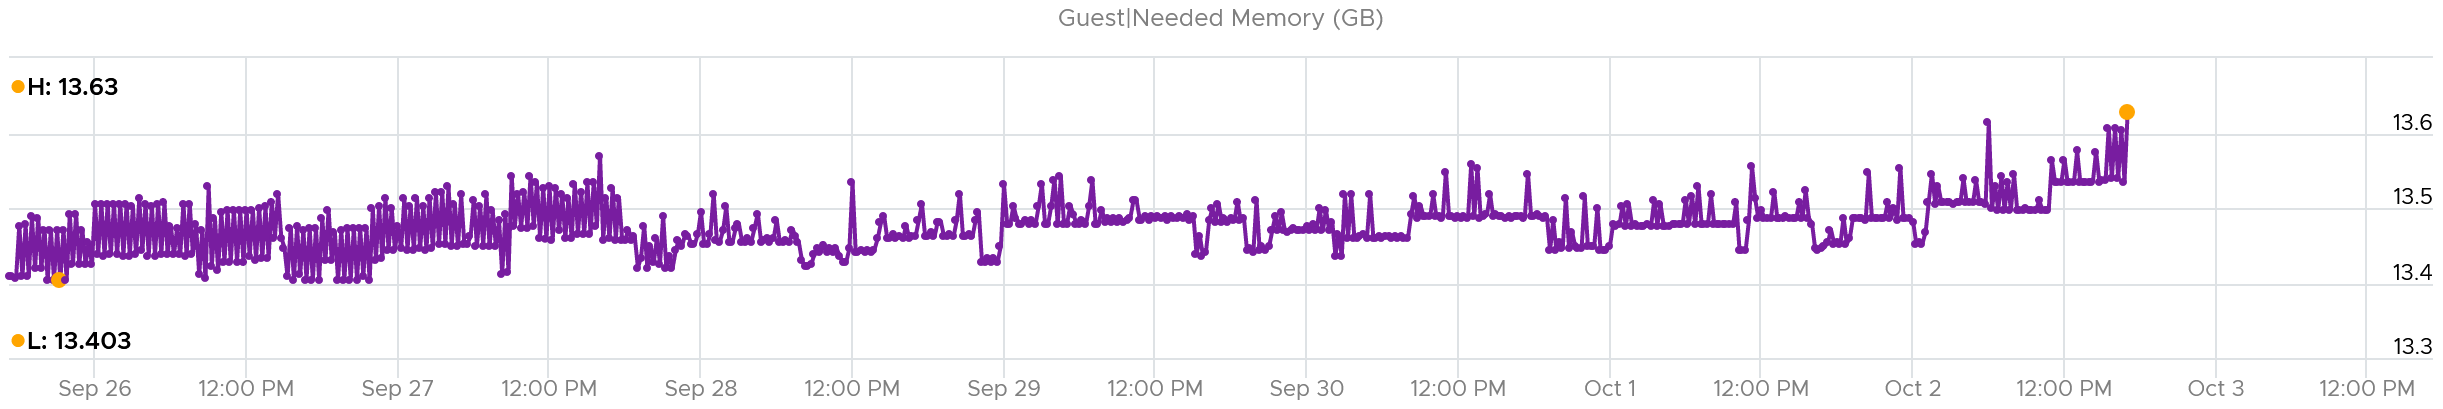
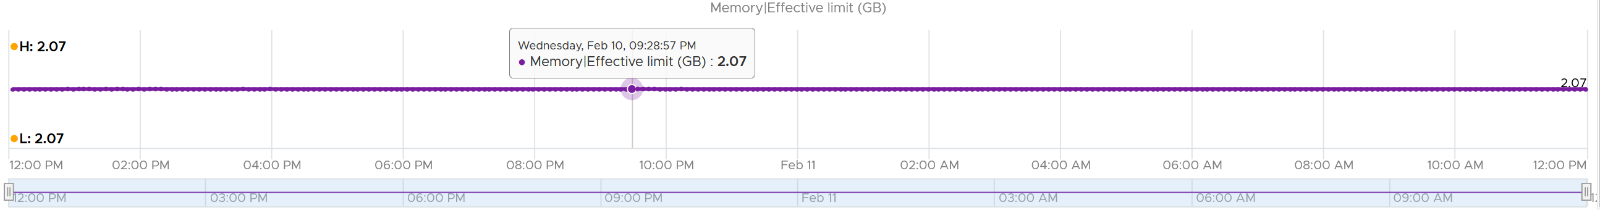
Let’s take an example with a VM that is configured with 16 GB RAM. This is a My SQL database running on RHEL. You can see in the last 7 days, it’s using around 13.4 GB and increasing to 13.6 GB.
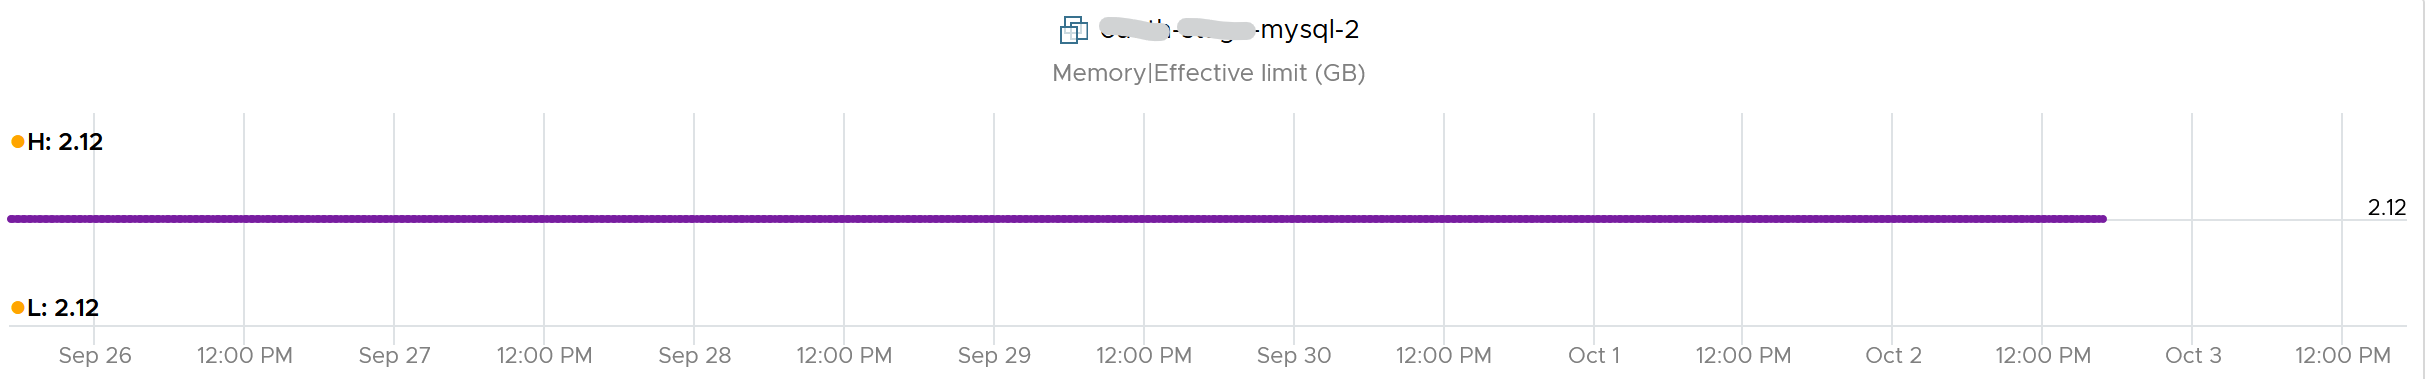
It’s given a bad limit of 2 GB.
In the last 7 days, we can see the limit is a perfectly flat line. It’s 2.12 GB as it includes the overhead value.
The VM, or rather the Guest OS, did ask for more. You can see the demand by looking at the Granted or Compressed or Swapped metrics. I’m only showing Granted here:
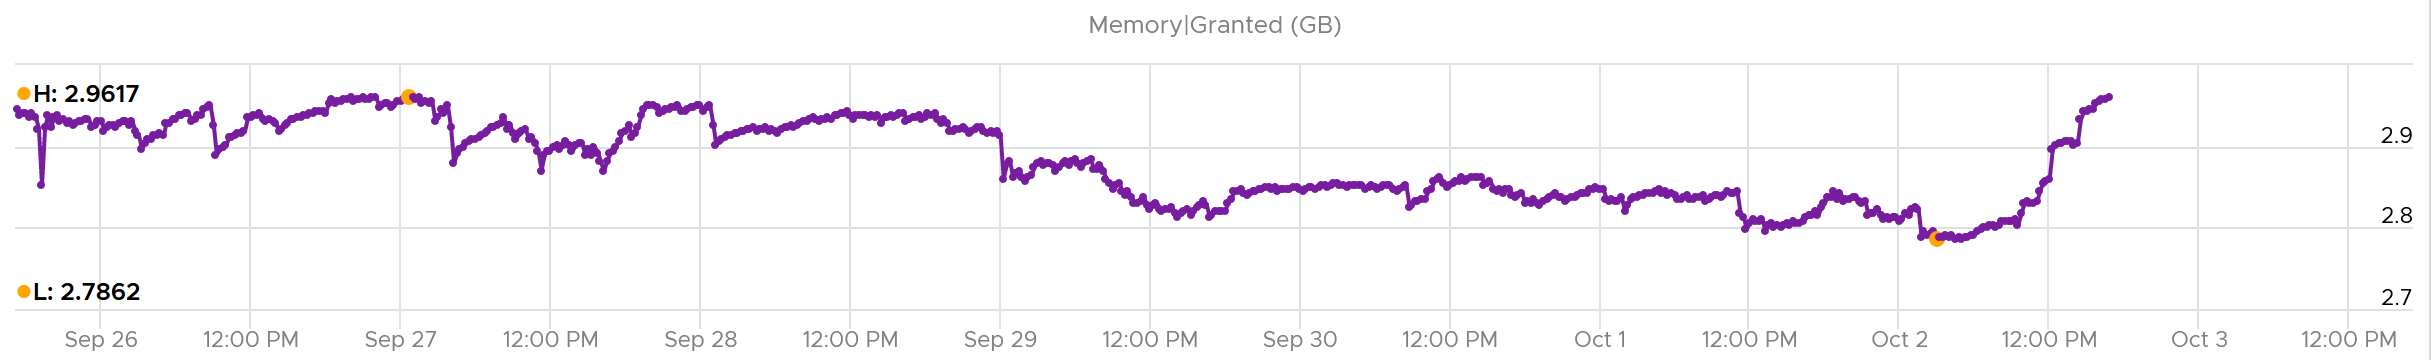
Because of the limit, the Consumed counter did not past the 2 GB. It’s constantly hovering near it as the VM is asking more than that.
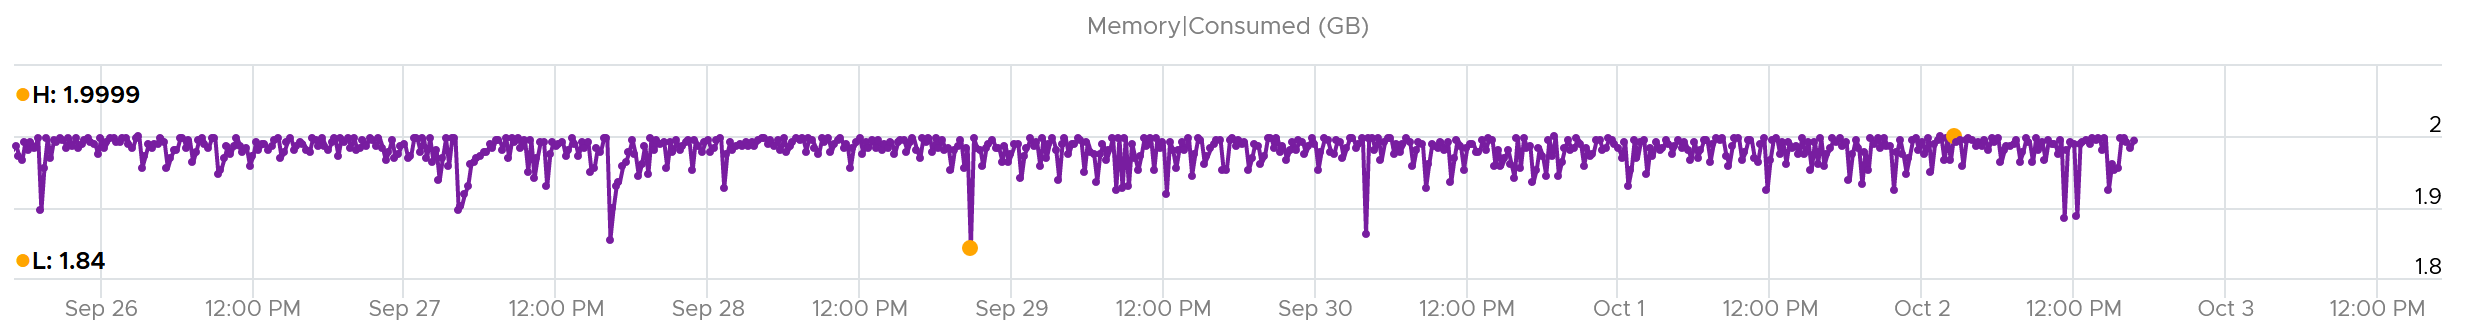
What do you expect to see the Balloon value?
If Balloon has something to do with it, it would not stay a perfectly flat line.
But this is what you got. A perfectly flat line, proving Limit had nothing to do with Balloon.
Consumption Metrics
| Configured | What the Guest OS can see is what is configured by vSphere. Guest OS can’t see the hypervisor memory overhead. |
|---|---|
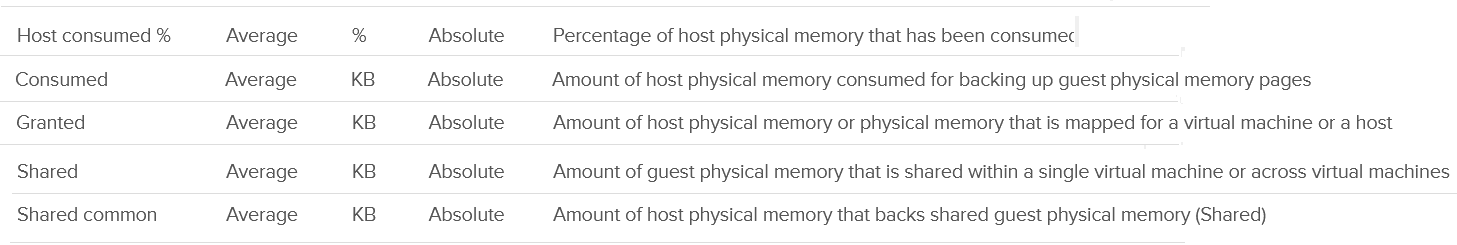
| Granted | This is page granted to the VM, minus Ballooned, Swapped, Compressed, and swapped to host cache. Take note of the process of transitioning during swap. During this process, the value of granted includes them |
| Shared | The number of memory pages that are pointing to the same underlying block. Many of these pages are likely the 0000 page. |
| Compressed | These 2 are mutually exclusive and go together. What can’t be compressed will be swapped. Compressed is preferred as unzipping memory from DRAM is faster than bringing it from SSD disk. Notice Windows even compressed its In Use pages. Compressed is the output (result of compression), not the input (memory subjected to compressed as that contains swapped also) |
| Swapped | |
| Entitlement | = Granted + Overhead. Overhead is mostly negligible, as it’s just storing metadata or index information required by virtualization, such as the shadow page tables. Overhead value goes up as you configure more vCPUs and memory. My guess is this excludes limit as you’re not entitled beyond the limit. |
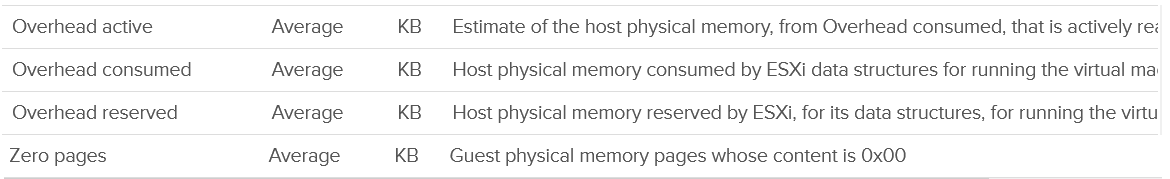
| Ballooned | The page was reclaimed by the balloon driver. It has not been asked back by the Guest OS, hence it’s just seating there collecting pixie dust. I colored the box yellow as that’s not a good (green) situation. The bigger the balloon size, the higher the chance a page will be required in the future. |
| Overhead | Virtualization overhead is operationally negligible. |
| “Free” | The VM never touches or uses the page since it’s powered on. After a while, as Guest OS starts paging in and out, this value will grow to near 0. |
Granted
Granted and Consumed are not similar. The former looks at from consumer layer, while the later looks from provider layer.
The formula is
Granted = normal page + shared page + zero page + being swapped-in + tiered page
Normal page is single pages being backed by physical DIMM. This metric is not exposed on its own.
Being swapped in means a staging stage between unmapped and normal. Once the transition is complete, it becomes a normal page.
Tiered is the memory tiering. Unlike swapped, memory tiering is “in-line” hence it is considered as part of granted.
Over time, a guest OS touches a large fraction of its address space through normal operations — OS initialization, memory zeroing, page table setup, file caching, and application allocations. As pages are touched, VMkernel creates physical page frame mappings. This what Granted metric is. Many of these mapped pages end up containing zeroes or are shared across VMs via transparent page sharing (TPS), consuming negligible physical RAM — but they still count toward Granted.
If the parent ESXi is not under physical memory pressure, VMkernel does not aggressively reclaim these zero/shared pages because they are cheap to maintain. Generaly speaking, for a VM that has been running for some time, its granted counter gradually increases toward the configured size, as that’s the upper limit.
Granted does not care about page savings at physical layer its vantage point is the VM, not ESXi. The following shows Granted is perfectly flat. Consumed goes down as the amount of shared page goes up.
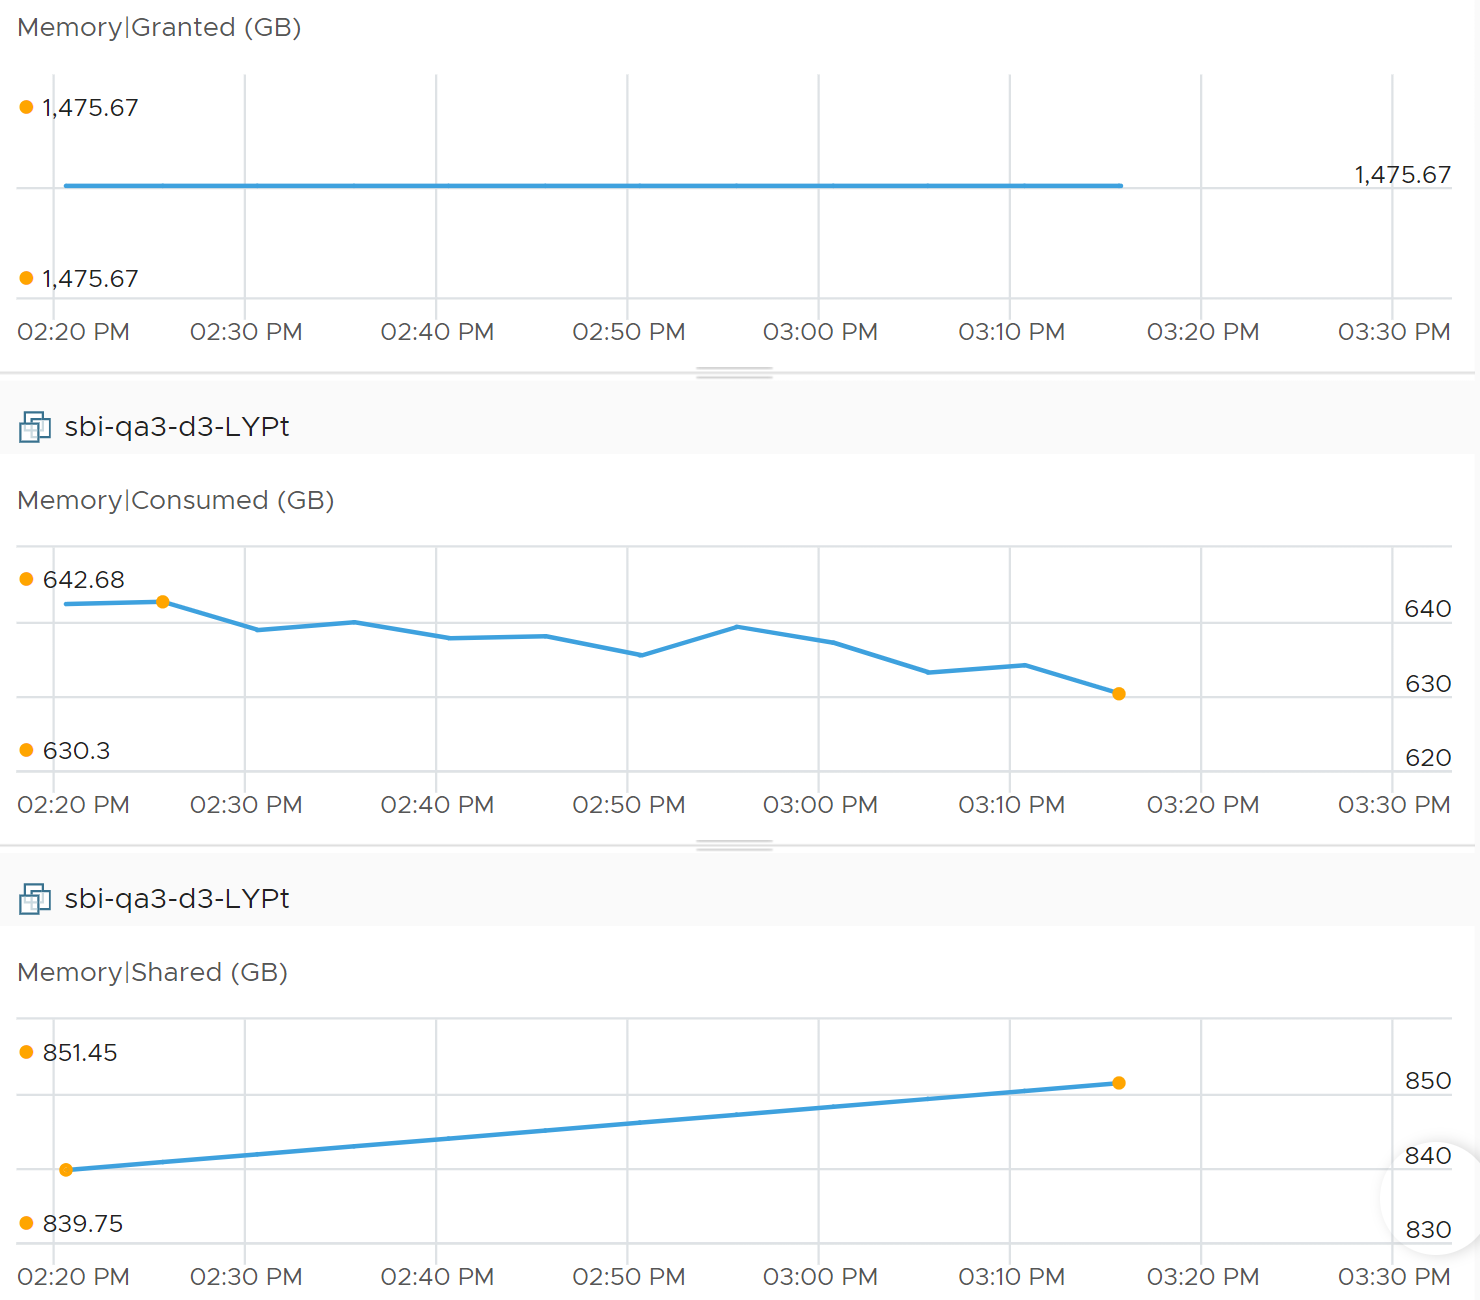
The same vantage point reason is why Limit impacts Consumed, but not Granted. The following is VM is a Windows 2016 server, configured with 12 GB of RAM, but was limited to 8 GB. Limit is shown as the flat line in cyan near the bottom, hovering just above the pink line).
The purple line jumping up and down is Granted. Granted ignores the limit completely and runs way above it.
Notice Consumed (KB) is consistently below Limit. Granted does not exceed 12 GB as it does not exceed configured.
Compressed + Swapped
Granted does not include Compressed + Swapped because the page is no longer directly accessible without some extra processing.
The following shows Granted move up while the other 2 metrics went down.
Summing up the above resulted in a delta of 0.7 MB.
Ballooned
Balloon driver removes page from the granted list. Granted does not include ballooned as the page is not functionally used. Technically, Guest OS memory counters include it so don’t forget to exclude it when working out the Guest OS utilization.
Shared
Shared counts the amount subjected to sharing. It does not count the actual savings post sharing.
There are 2 types of sharing that can happen to a page:
| Intra-VM sharing | sharing within the same VM. By default, each page is 4 KB. If Guest OS uses the Large Page, then it’s 2 MB. The chance of sharing in 4 KB page is logically much higher than in 2 MB. |
|---|---|
| Inter-VM sharing | Due to security concern, this is by default disabled in vSphere |
| For accounting purpose, the Shared page is counted in full for each VM. This means if you sum the number from all VMs you’re going to get inflated value at the ESXi level |
Example:
-
VM 001 has 1 GB private.
-
The 100 MB is the amount that is being shared internally within the VM. If not shared, they would consume 100 MB.
-
There is additional 10 MB that is subjected to sharing with other VMs. It could be shared with 1 VM or many VM; it does not matter as far this VM 001 concern. The Shared counter merely counts that this 10 MB is being shared.
Using the above, the shared page for VM 001 is 110 MB.
Savings
The calculation has to be done on each block that points to the same destination page. For example, if there are 10 pages pointing to the same physical DIMM, then the savings is 9 pages worth of memory.
The above process is repeated for all the shared page.
The result is some savings. But how much savings?
Here is a summary from 7500 VMs.
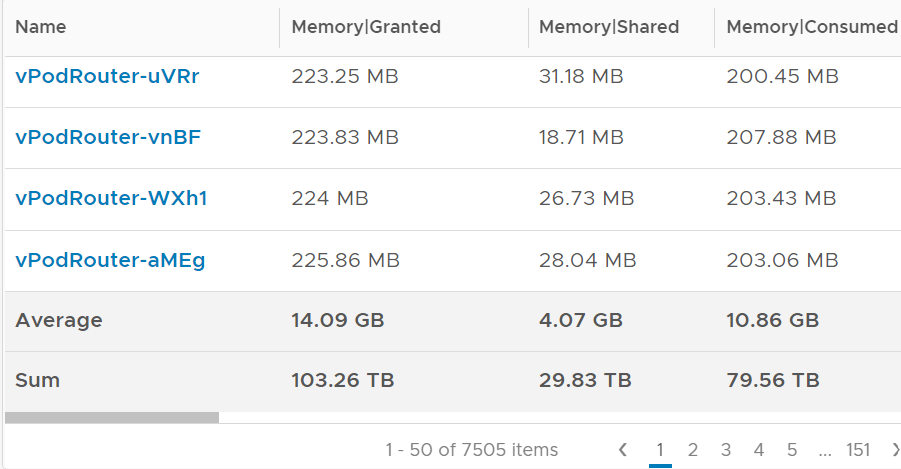
Review the last row. What are the total savings?
Granted – Consumed = (103.26 – 79.56) = 23.7 TB
Savings = 29.83 TB – 23.7 TB = 6.13 TB.
That’s around 6% saving.
Profile your own environment. What savings do you get?
Savings does not include compressed as that is not true saving. Zipped results in performance impact, while saving should not.
Zero
A commonly shared page is certainly the zero page. A common technique to initialize space is to simply write 0.
The following screenshot shows the 2 moved in tandem over several days.
Consumed
Consumed = Granted – Savings.
Consumes tracks the ESXi Memory mapped to the VM. ESXi assigns large pages (2 MB) to VM whenever possible; it does this even if the Guest OS doesn’t request them. The use of large pages can significantly reduce TLB misses, improving the performance of most workloads, especially those with large active memory working sets. The drawback is VM consumes more memory than what Guest OS does.
Consumed does not include overhead memory, although this number is practically negligible. Think of the word consume as delivering benefit to the VM. Since overhead is transparent to Guest OS, it’s excluded.
Consumed does not include swapped memory, for the same reason above. The swapped pages are not readily available for use. As for compressed, I’m unsure if it includes the portion that is the DIMM. It does not include the portion that was subjected to compression. For example, a 4 KB page was compressed to 1 KB. The 0.75 KB is not in Consumed as it’s no longer in the DIMM.
Consumed includes memory that might be reserved.
Do not use the metric Guest \ Memory Usage. That’s the same as Consumed.
Guest OS
When a Guest OS frees up a memory page, it normally just updates its list of free memory, it does not actually update the content. This list is not exposed to the hypervisor, and so the physical page remains claimed by the VM. This is why the Consumed is higher than the Guest OS In Use, and it remains high when the Active counter has long dropped.
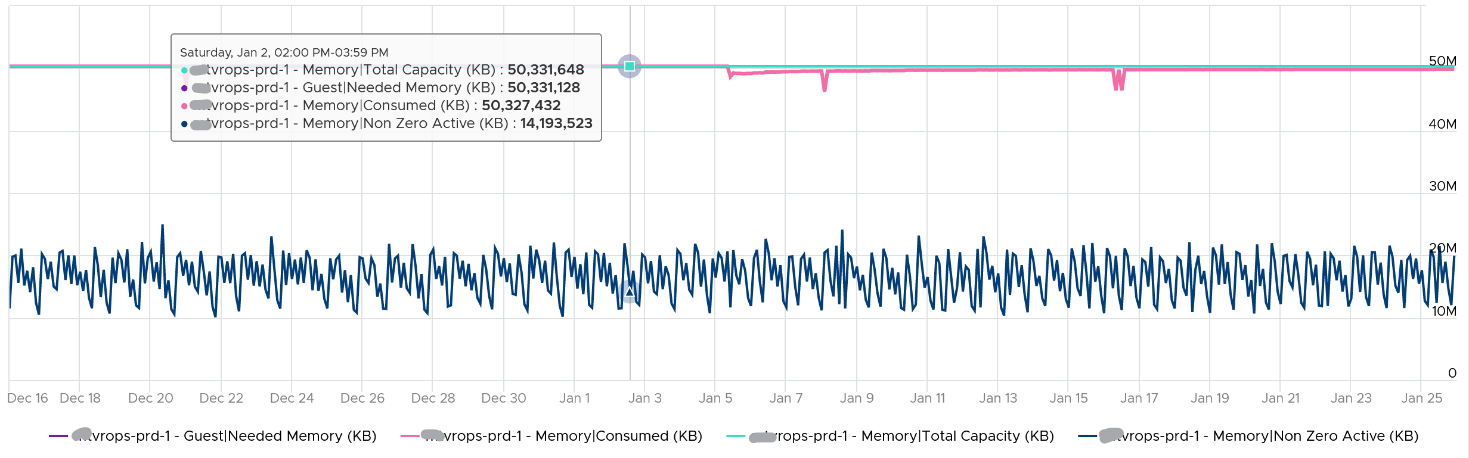
Consumed and Guest OS In Use are not related, as they are independently managed. Here is a screenshot comparing Windows 10 Task Manager memory metrics with VCF Operations Memory \ Non Zero Active (KB) and Memory \ Consumed (KB). As you can see, none of the metrics match.
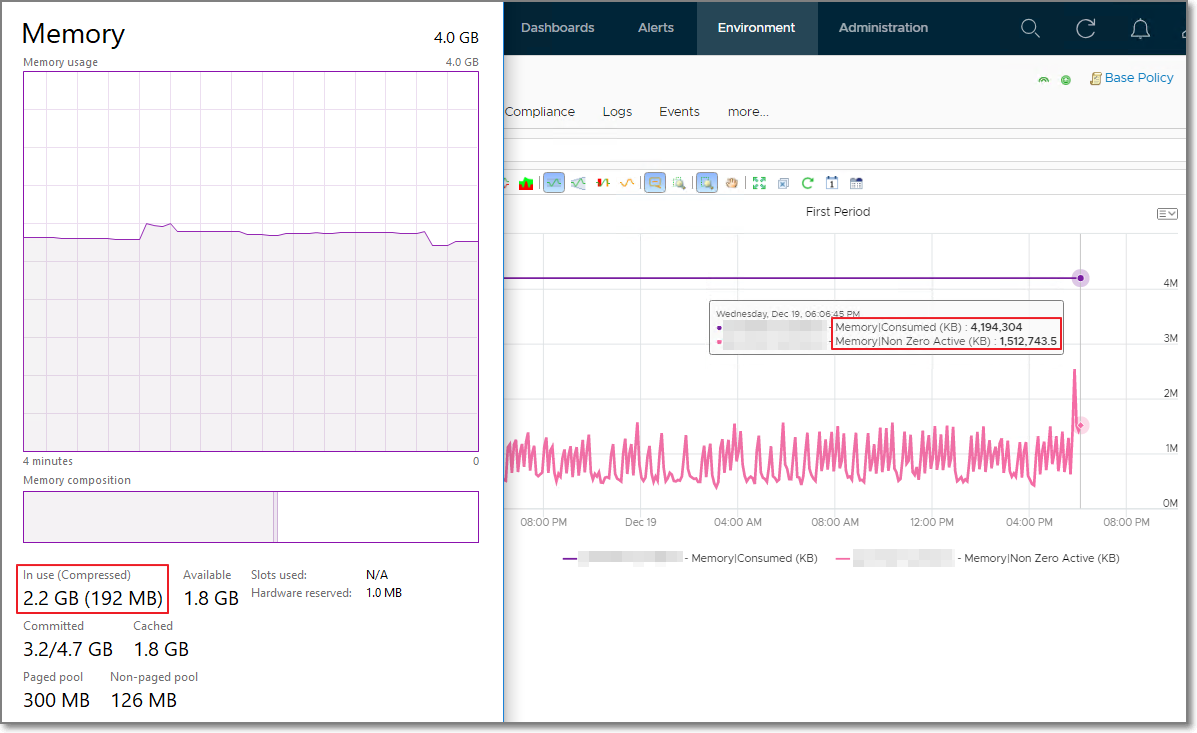
When you see Consumed is lower than Guest OS Used, check if there are plenty of shared pages. Consumed does not include shared page.
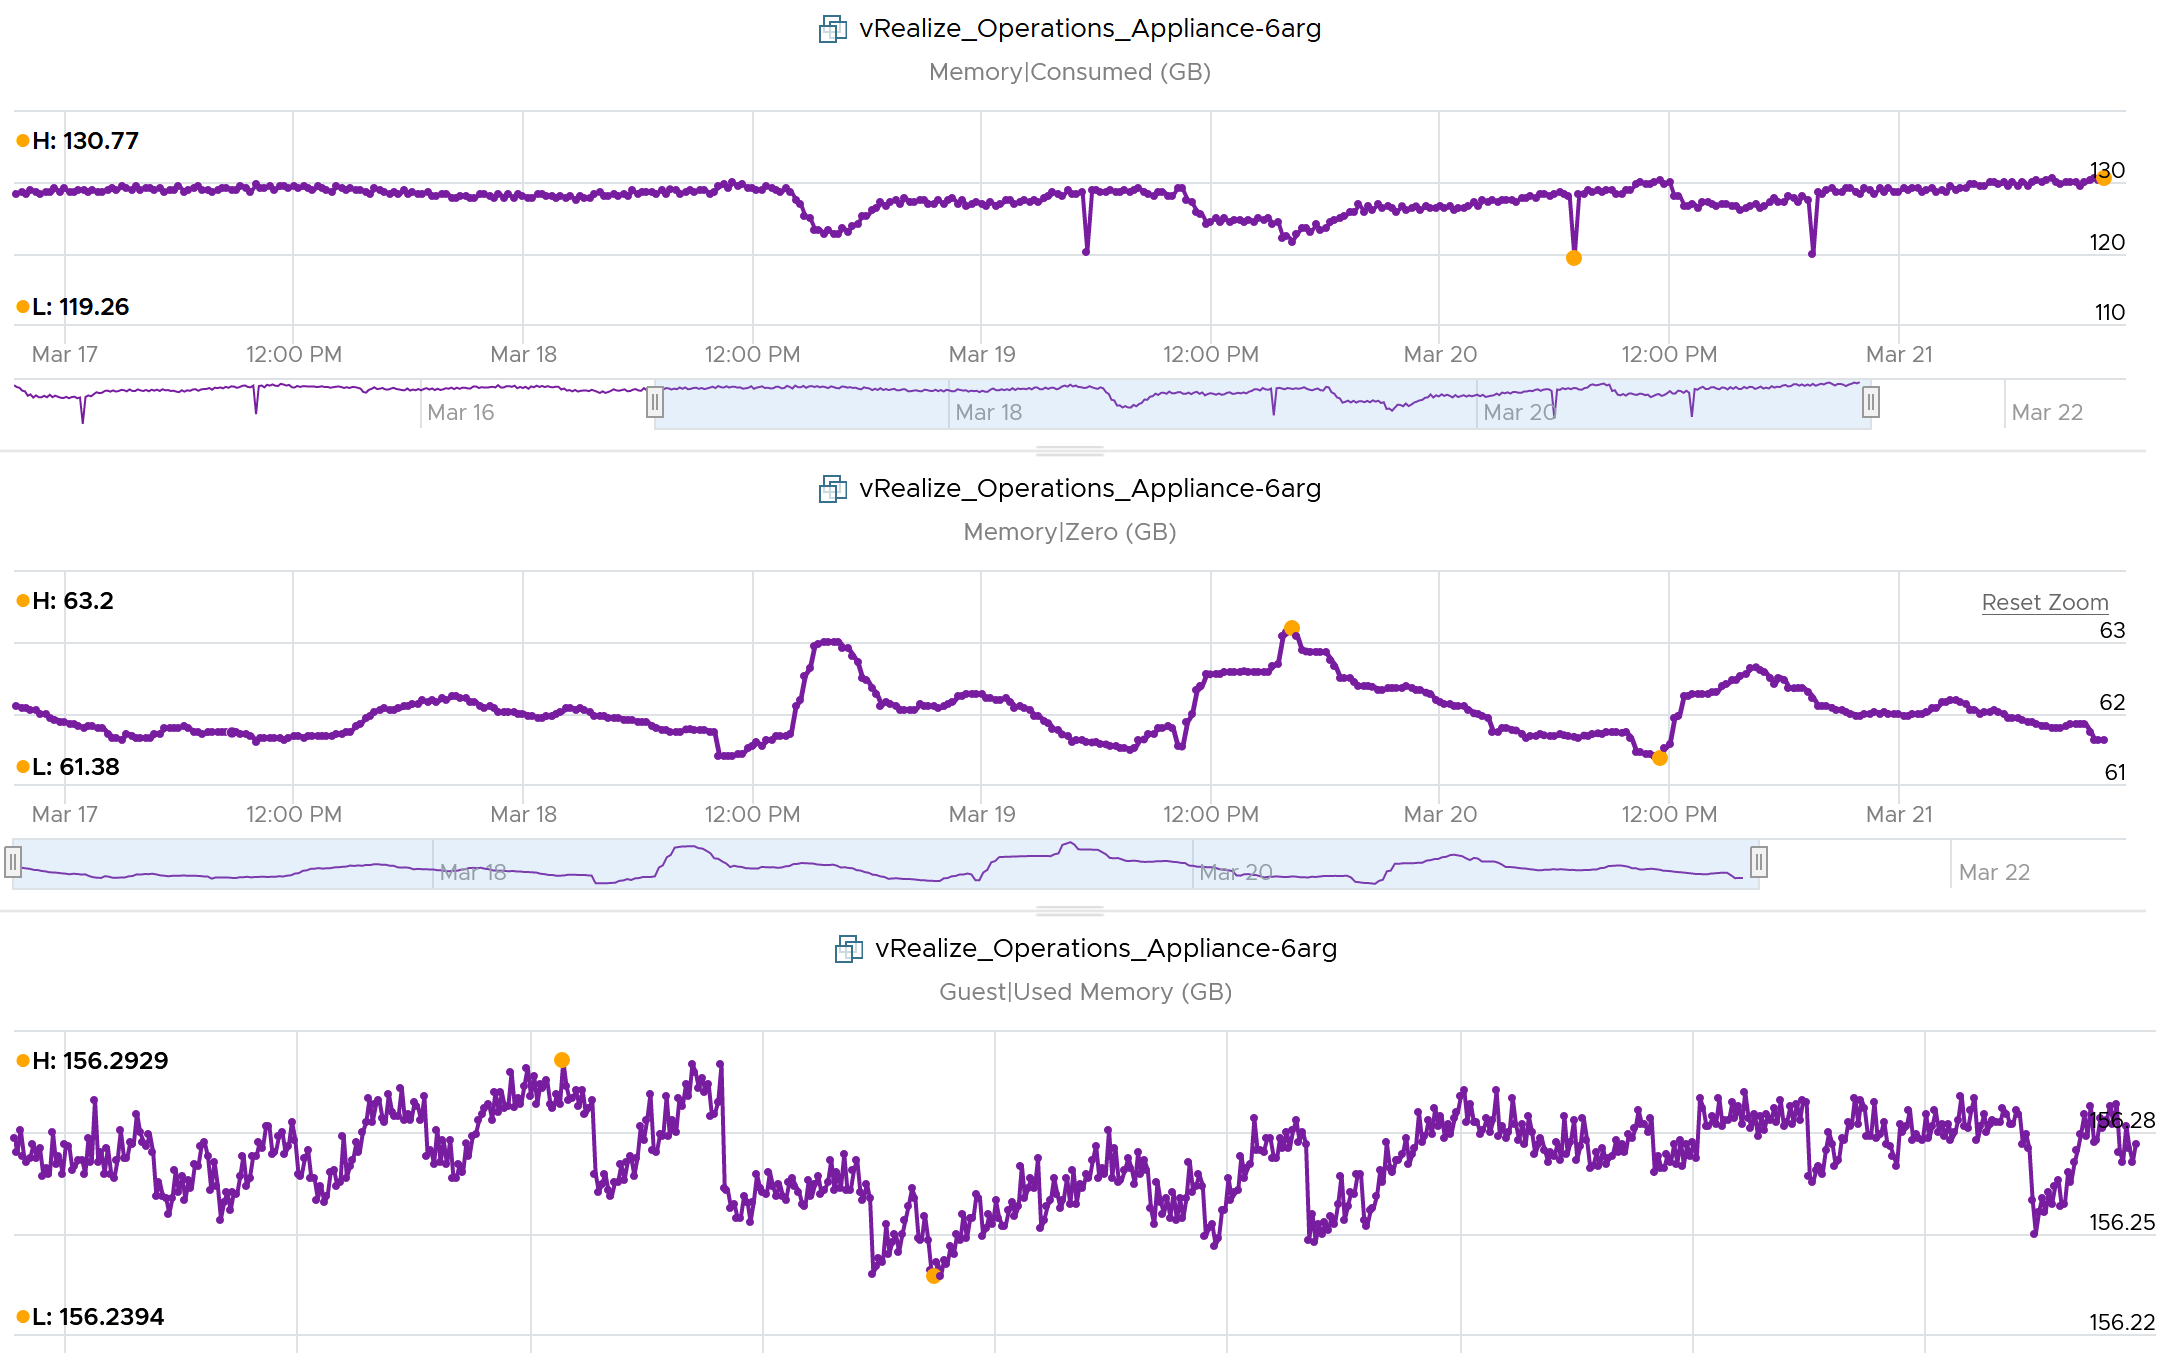
The following screenshot shows Guest OS Used consistently higher. It’s also constant, around 156 GB throughout. Consumed was relatively more volatile, but never exceed 131 GB. The reason for it is Shared. Notice the value of page with all 0 is high, around 61 – 63 GB.
Ballooned
This 64-bit CentOS VM runs My SQL and is configured with 8 GB of RAM.
Linux was heavily ballooned out (default limit is around 63%). Why is that so?
The answer for this VM is we set a limit to 2 GB. As a result, Consumed could not exceed 2 GB. Since the VM needed more, it experienced heavy ballooning.
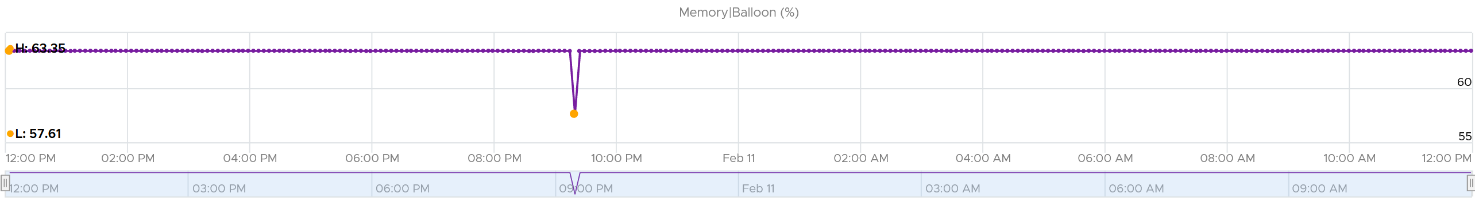
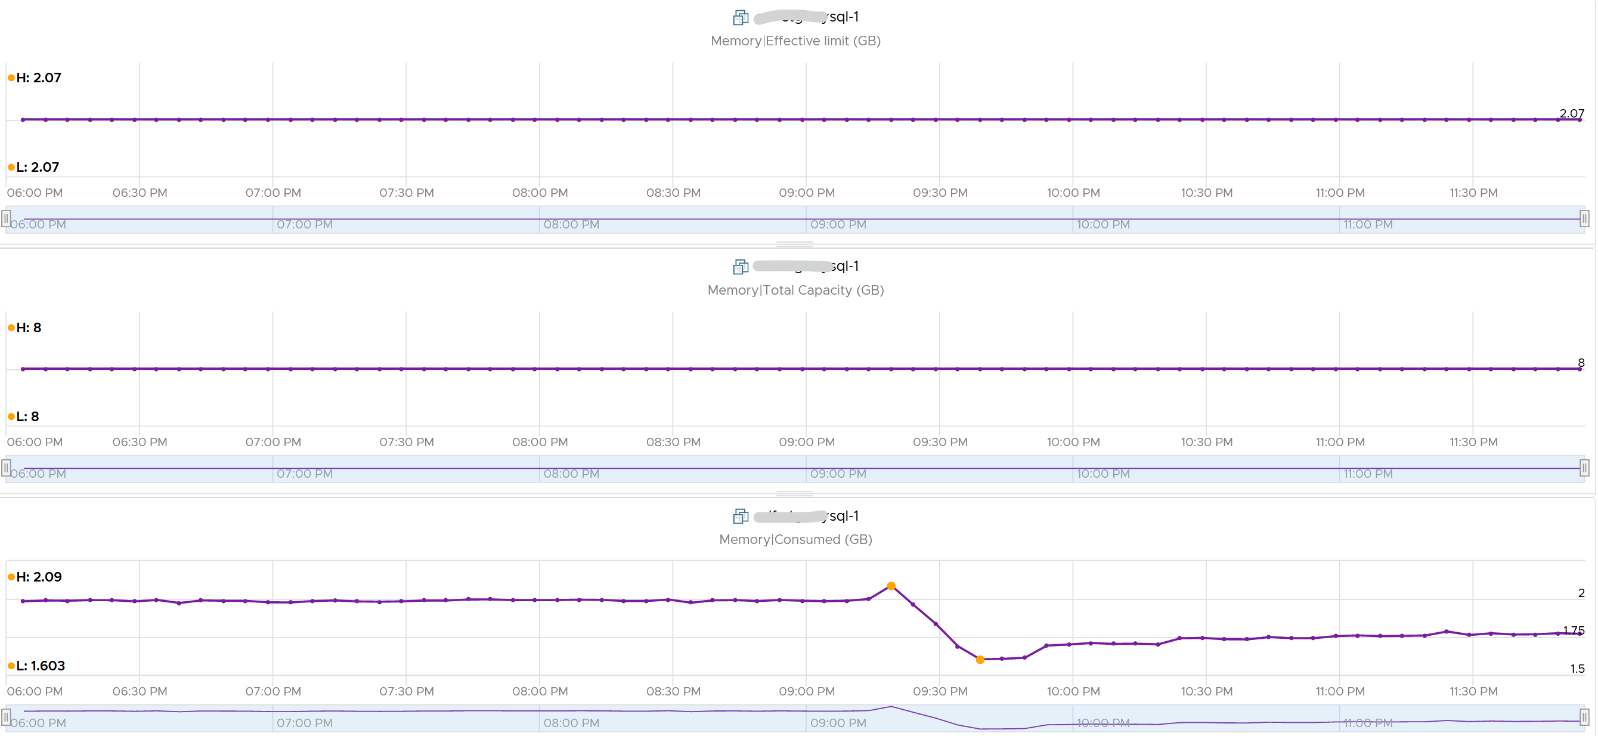
Did you notice the common deep in Balloon and Consumed?
Can you explain them?
Balloon dropped by 0.46 GB then went back to its limit again. This indicated Guest OS was active.
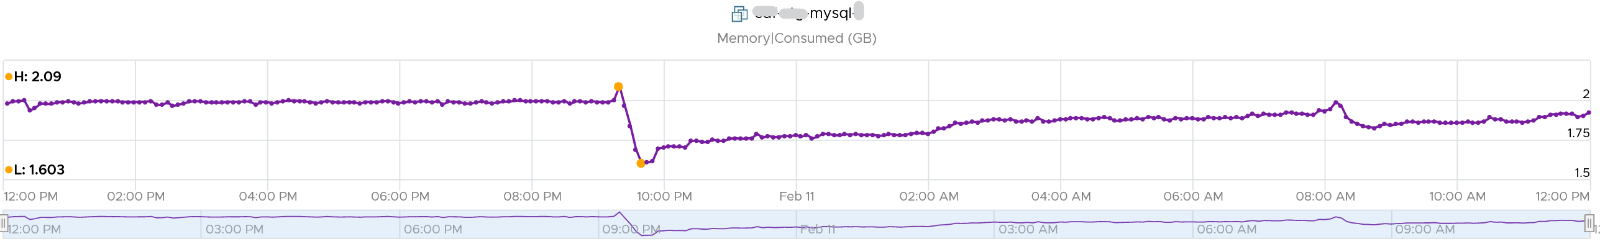
Consumed went down from 2.09 GB to 1.6 GB, and then slowly going back up. Why did it suddenly consume 0.4 GB less in the span of 20 minutes? Both the configured limit and the runtime limit did not change. They were constant at 2 GB. This makes sense, else the Consumed would not be able to slowly go up again.
There must be activity by the VM and pages were compressed to make room for the newly requested pages. The Non Zero Active counter shows that there are activities.
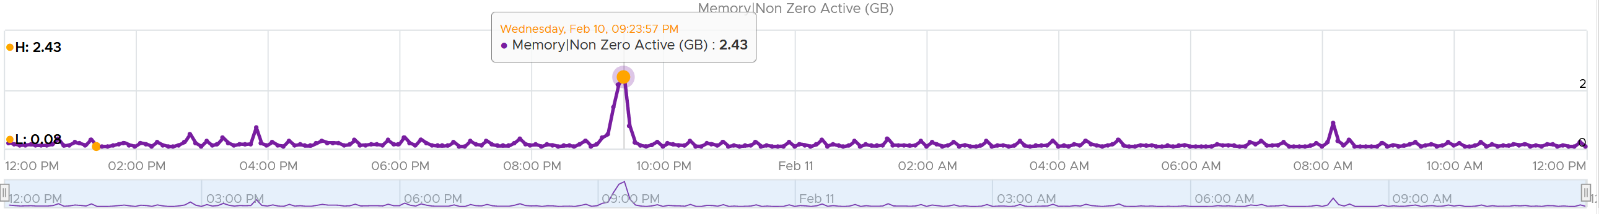
The pages that are not used must be compressed or swapped. The Swapped value is negligible, but the Compressed metric shows the matching spike.
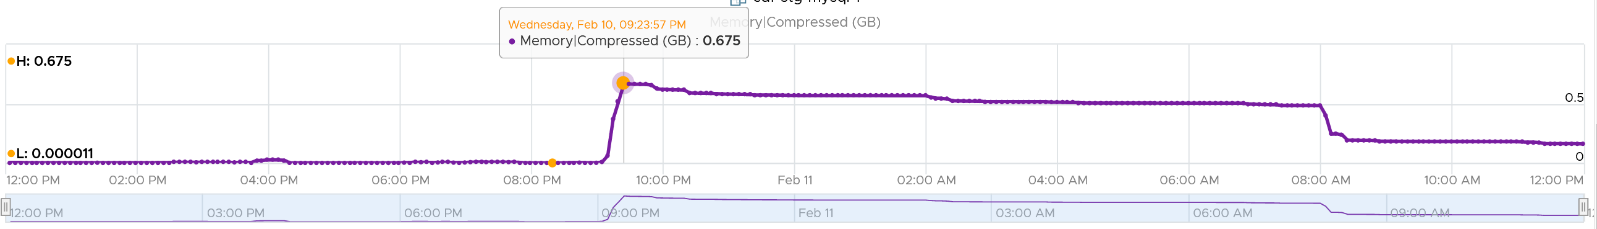
So far so good. Windows or Linux were active (2.4 GB in 5 minute at the highest point, but some pages were probably part of Consumed). Since Consumed was at 100%, some pages were moved out to accommodate new pages. The compression resulted in 0.6 GB, hence the uncompressed amount was in between 2x and 4x.
Consumed dropped by 0.4 GB as that’s the gap between what was added (new pages) and what was removed (existing pages).
Limit
Consumed is affected by Limit. The following is a VM configured with 8 GB RAM but was limited to 2 GB.
Total
Consumed may reach but not exceed the configured memory. Both total and consumed do not include the virtualization overhead memory.
Active
This is a widely misunderstood counter. ESXi calls this Touch as it better represents the purpose of the metric. Note that vCenter still calls it Active, so I will call it Active.
This counter is often used to determine the VM utilization, which is not what it was designed for. To know why, we need to go back to fundamental. Let’s look at the word active. It is an English word that needs to be quantified before we can use it as metric. There are 2 dimensions to consider before we apply it:
-
Definition of active. In RAM context, this means read or write activity. This is similar to disk IOPS. The more read/sec or write/sec to a page, the more active that page is. Note that the same page can be read/written to many times in a second. Because a page may be accessed multiple times, the actual active pages could be lower. Example: a VM do 100 reads and 100 writes on its memory. However, 50 of the writes are on the page that were read. In addition, there are 10 pages that were read multiple times. Because of these 2 factors, the total active pages are far fewer than 300 pages. If the page is average 4 KB, then the total active is way less than 1200 KB.
-
Active is time bound. Last week is certainly not active. Is 300 seconds ago active? What exactly, is recent? 1 second can be defended as a good definition of recent. Windows shows memory utilization in 1 second interval. IOPS is always measured per second, hence the name IOPS. So I think 1 second seems like a good definition of recent.
Applying the above understanding, the active counter is actually a rate, not a space. However, the counter reported by vCenter is in KB, not KB/s.
To translate from KB/s to KB, we need to aggregate based on the sampling period. Assuming ESXi samples every 2 seconds, vCenter will have 10 sampling in its 20 second reporting period. The 10 samplings can be sampling the same identical pages, or completely different ones. So in the 20 seconds period, the active memory can be as small as 1 sampling, or as large as 10 samplings.
Examples:
-
First 2 seconds: 100 MB Active
-
Next 2 seconds: 150 MB Active
In the above 4 seconds, the active page ranges from 150 MB to 250 MB.
Each sampling is done independently, meaning you could be sampling the same block again. But the value is then averaged it with previous samples. Because sampling and averaging takes time, Active won't be exact, but becomes more accurate over time to approximate the amount of active memory for the VM. This is why there is actually a longer version of Active, which you will see in esxtop (it is not available in vSphere Client).
VM Active is typically different from Guest OS working set estimate. Sometimes the difference may be big, because Guest OS and the kernel use different working set estimate algorithm. Also, VM has a different view of active memory, due to ballooning and host swapping. Logically, ballooned memory is considered inactive, so, it is excluded from the sampling. Active is unaware of locked and large pages.
Reference: Active Memory by Mark Achtemichuk.
Consumed vs Active
I hope the explanation on Consumed and Active convince you that they serve different purpose. They are not calculated in a similar manner, and are not simply differ based on aggressive vs conservative.
Both Active and Consumed are not suitable for sizing the Guest OS. They are VM level metrics, with little correlation to the Guest OS memory usage.
Example 1
The following test shows Active going down while Consumed going up.
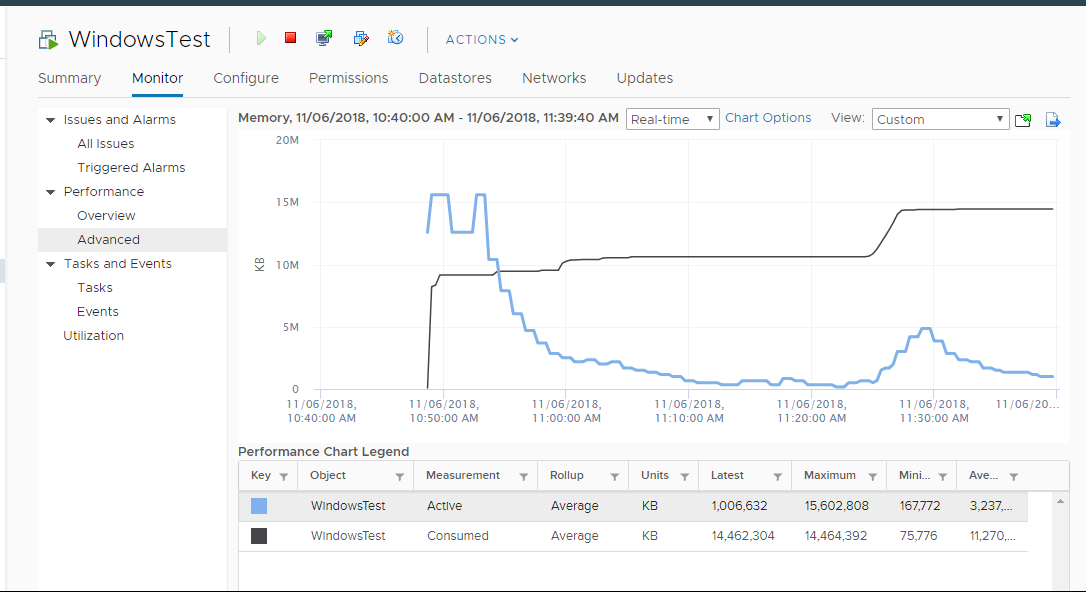
Example 2
If you plot a VCF Operations VM in vCenter real-time performance chart, you will see 12 peaks in that one-hour line chart. The reason is VCF Operations pulls, process, and writes data every 5-minutes. The chart for CPU, disk and network will sport the same pattern. This is expected.
But if you plot the memory metrics, be it total active, active write or consumed, you will not see the 12 peaks. This is what I got instead.
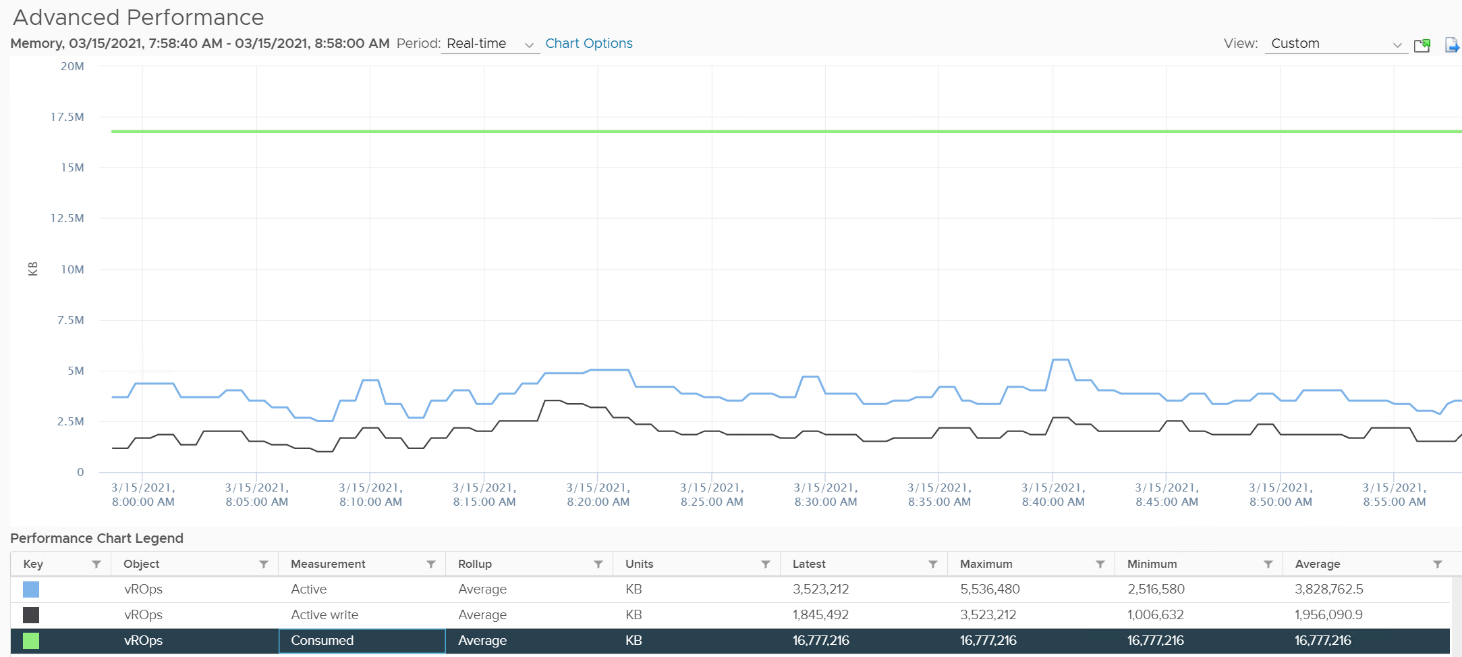
Consume is completely flat and high. Active (read and write) and Active Write (write only) is much lower but again the 12 peaks are not shown.
Can you figure it out?
My guess is the sampling size. That’s just a guess, so if you have a better answer let me know!
Now let’s go to VCF Operations. In VCF Operations, this metric is called Memory \ Non Zero Active (KB).
vCenter reports in 20 seconds interval*.* VCF Operations takes 15 of these data and average them into a 300-second average. In the 300 second period, the same page can be read and written multiple times. Hence the active counter over reports the actual count.
Quiz: now that you know Active over reports, why is it lower than Consumed? Why is it lower than Guest OS metrics?
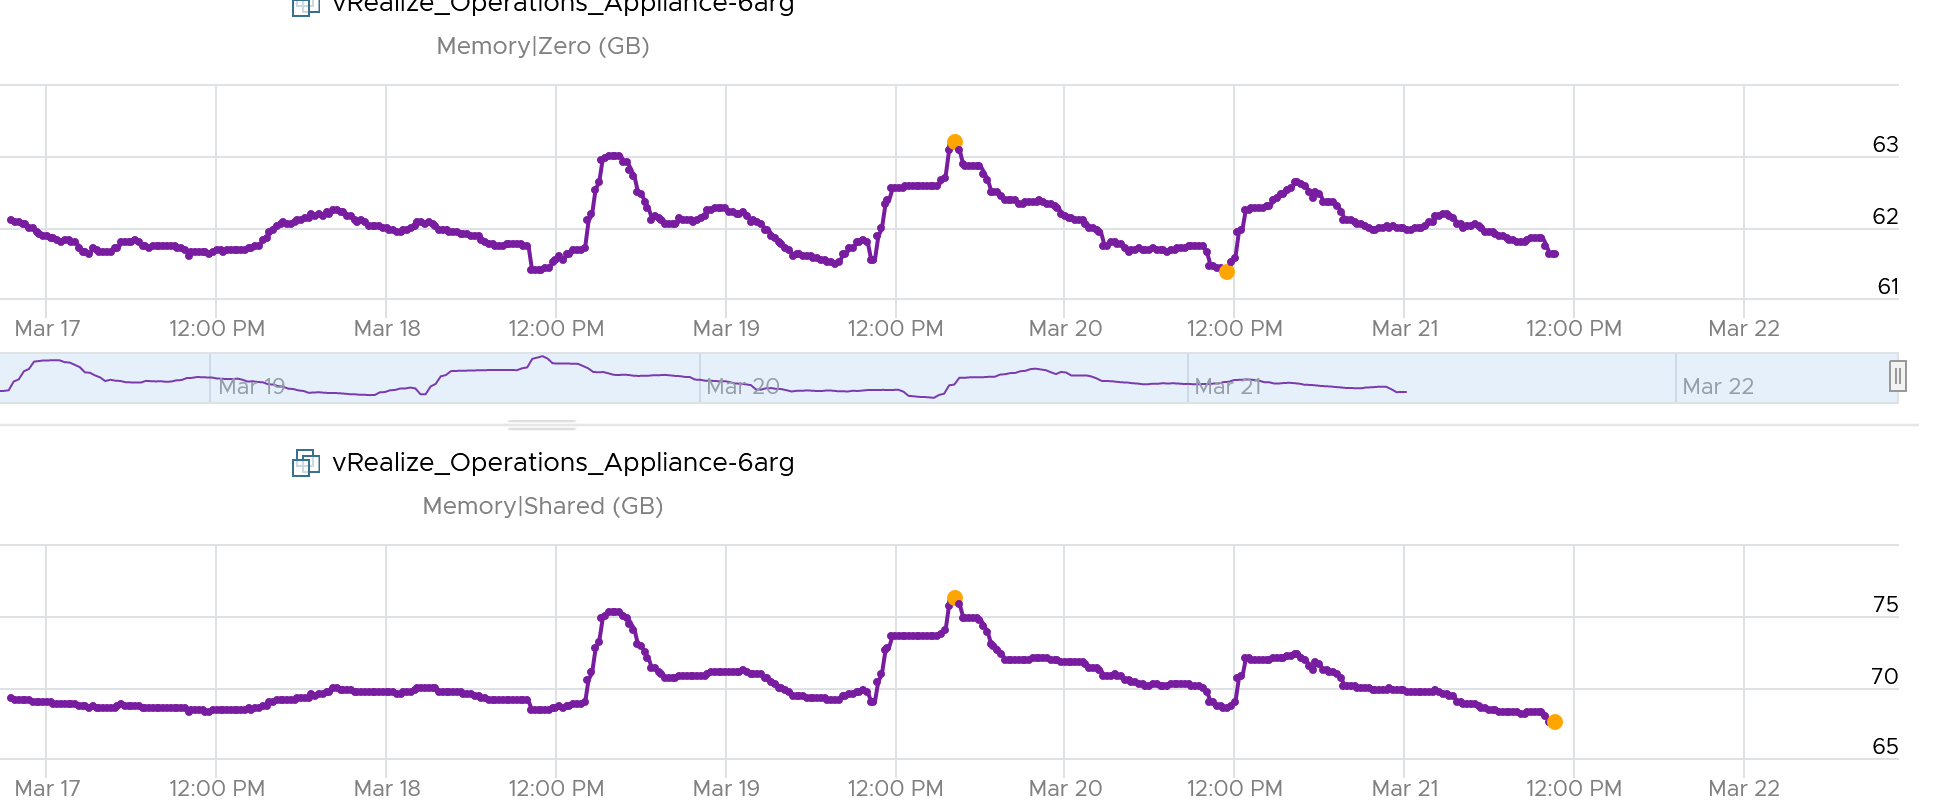
Active is lower than both metrics because these 2 metrics do not actually measure how actively the page is used. They are measuring the disk space used, so it contains a lot of inactive pages. You can see it in the general pattern of Consume and Guest OS used metrics. The following is VCF Operations appliance VM. Notice how stable the metrics are, even over millions of seconds.
Usage (%)
Usage metric in vCenter differs to Usage metric in VCF Operations.
What you see on the vCenter UI is Active, not Consumed.
Mapping to Active makes more sense as Consumed contains inactive pages. As covered earlier, neither Active nor Consumed actually measures the Guest OS memory. This is why VCF Operations maps Usage to Guest OS. The formula is:
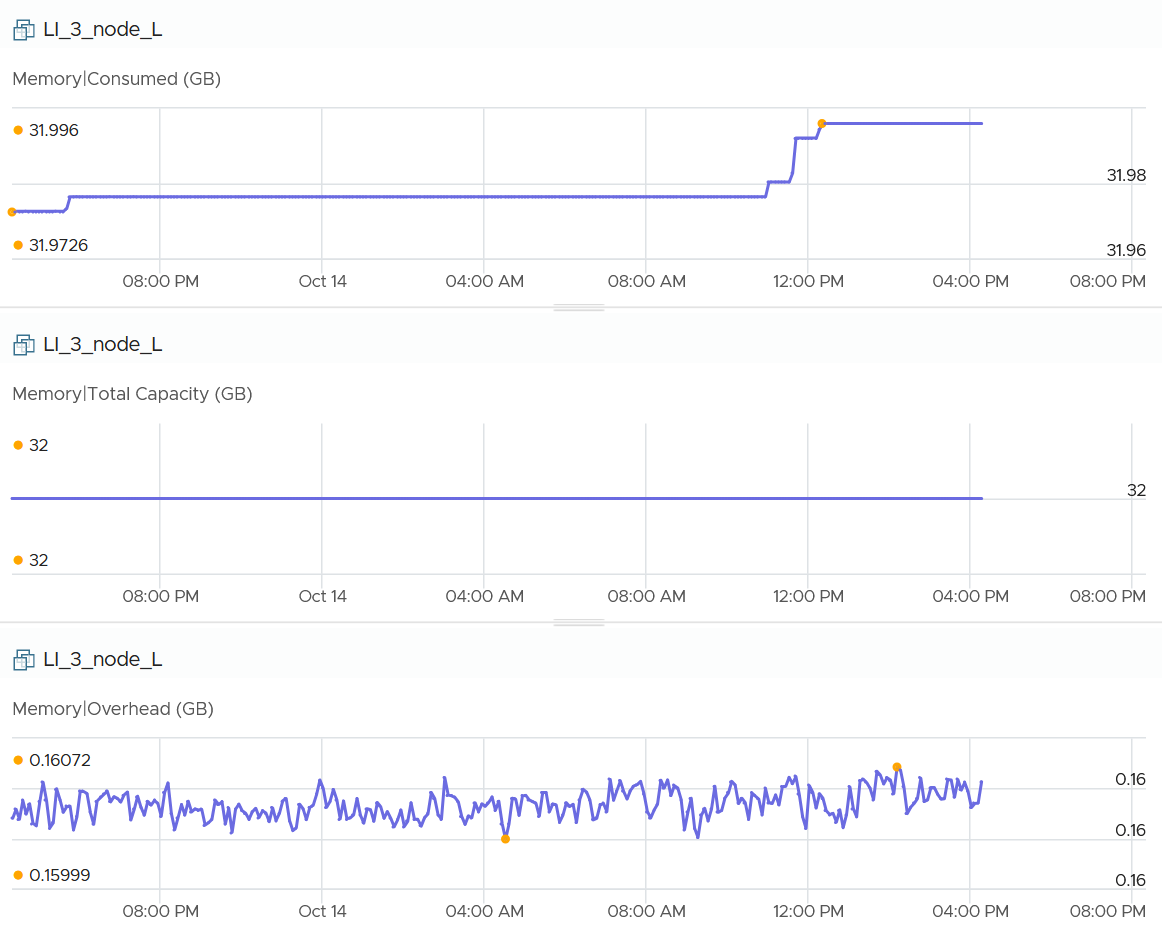
VM Memory Usage (%) = Guest OS Needed Memory (KB) / VM Memory Total Capacity (KB) * 100
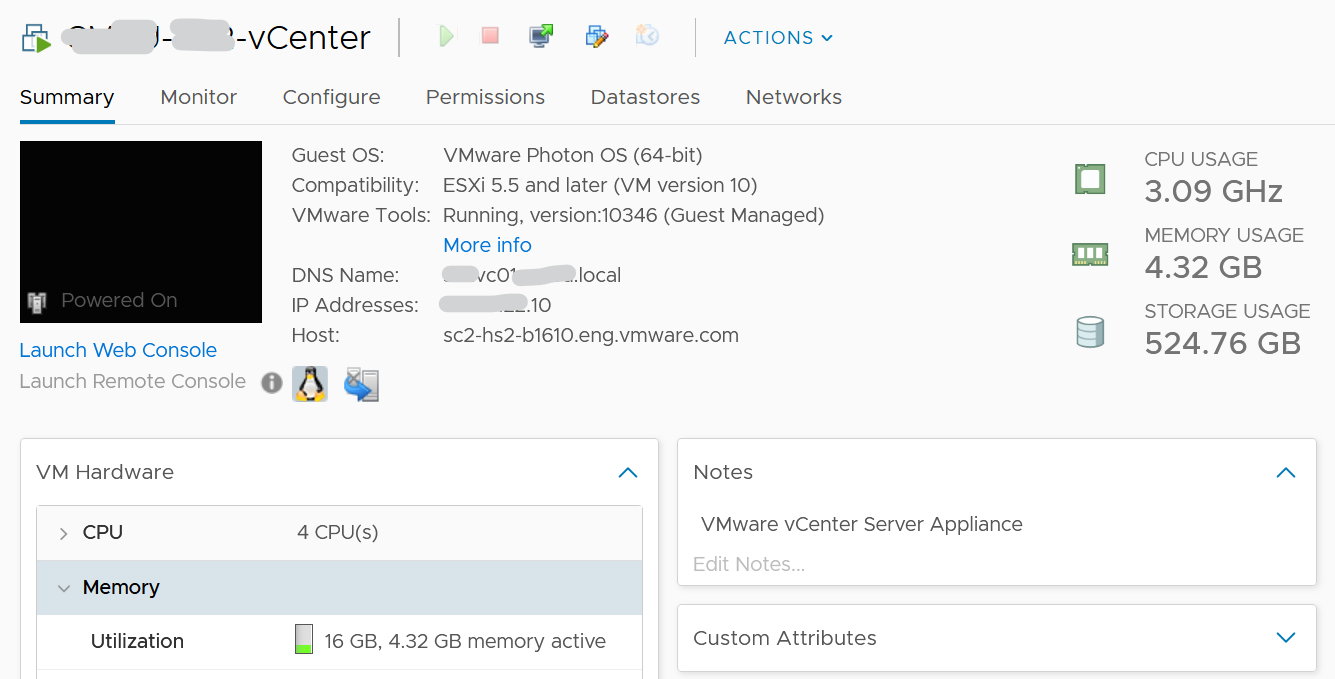
The following shows what Usage (%) = Guest OS Needed Memory over configured memory. The VM has 1 GB of memory, so 757 MB / 1024 = 74%.
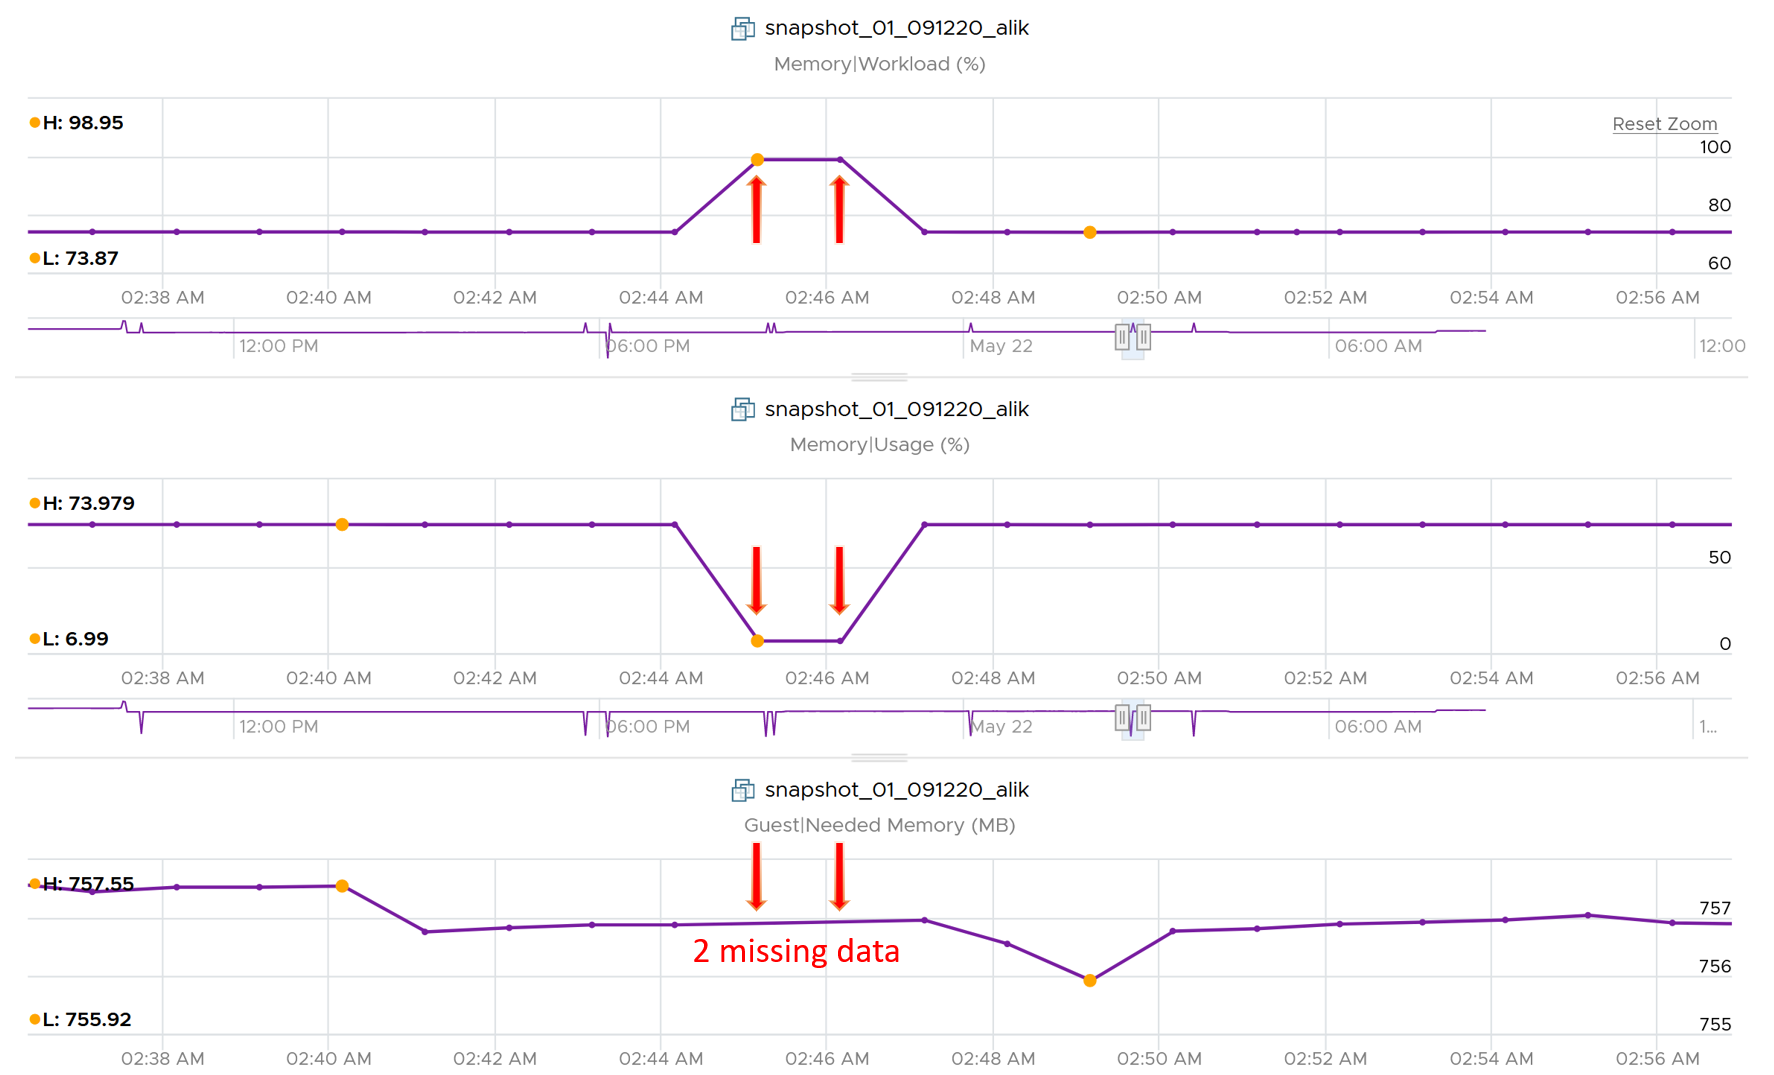
Take note that there can be situation where Guest OS metrics do not make it to VCF Operations. In that case, Usage (%) falls back to Active (notice the value dropped to 6.99%) whereas Workload (%) falls back to Consumed (notice the value jump to 98.95%).
Utilization
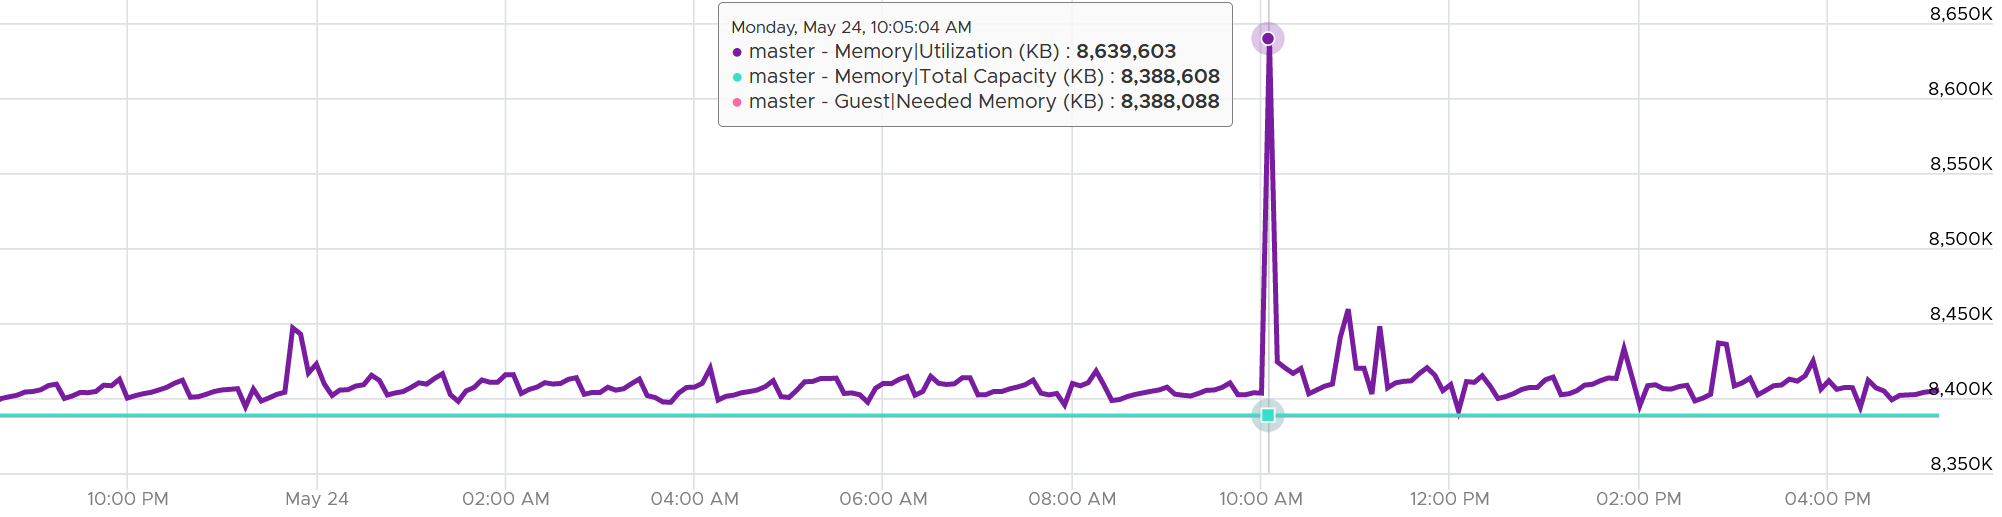
Utilization (KB) = Guest Needed Memory (KB) + ( Guest Page In Rate per second * Guest Page Size (KB) ) + Memory Total Capacity (KB) – Guest Physically Usable Memory (KB).
Because of the formula, the value can exceed 100%. The following is an example:
It’s possible that VCF Operations shows high value when Windows or Linux does not. Here are some reasons:
-
Guest metrics from VMware Tools are not collecting. The value falls back to Consumed (KB). Ensure your collection is reliable, else the values you get over time contains mixed source. If their values aren’t similar, the counter values will be fluctuating wildly.
-
Guest Physically Usable Memory (KB) is less than your configured memory. I’ve seen in one case where it’s showing 58 GB whereas the VM is configured with 80 GB. My first guess is the type of OS licensing. However, according to this, it should be 64 GB not 58 GB.
-
Low utilization. We add 5% of Total, not Used. A 128 GB VM will show 6.4 GB extra usage.
-
Excessive paging. We consider this. The tricky part is excessive is relative.
-
We include Available in Linux and cache in Windows, as we want to be conservative.
Demand
Can you spot a major counter that exists for CPU, but not for RAM?
That’s right. It’s Demand. There is no memory demand counter in vCenter UI.
To figure out demand, we need to figure out unmet demand, as demand is simply unmet demand + used (which is met demand). Since the context here is VM, and not Guest OS, then unmet demand includes only VM level metrics. The metrics are ballooned + swapped + compressed.
Do you agree with the above?
If we are being strict with the unmet demand definition, then only the memory attributed to contention should be considered unmet demand. That means balloon, swap, or compressed memory can’t be considered unmet demand. Swap in and decompression are the contention portion of memory. The problem then becomes the inability to differentiate contention due to limits using host level metrics, which means we’d need to look at VM level metric to exclude that expected contention.
Quiz!
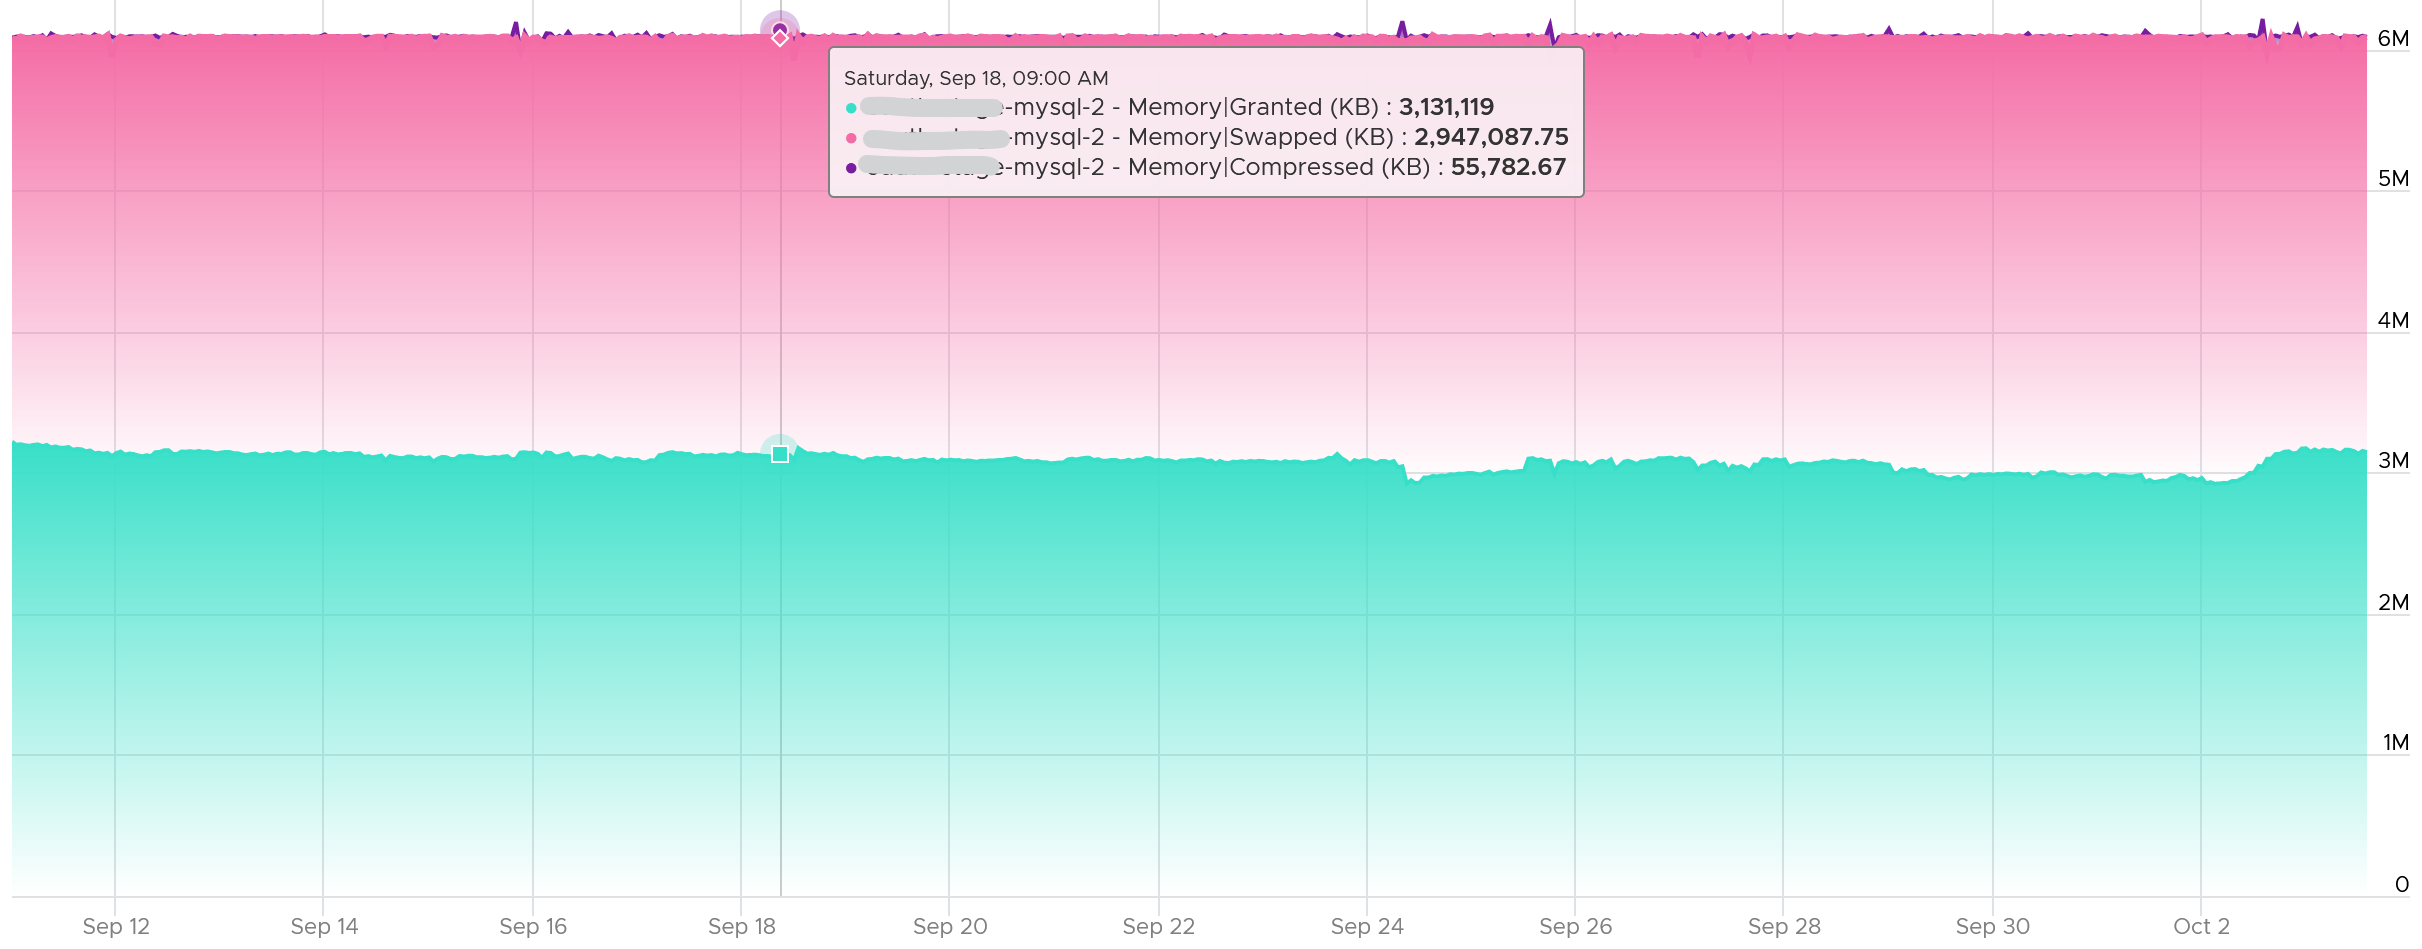
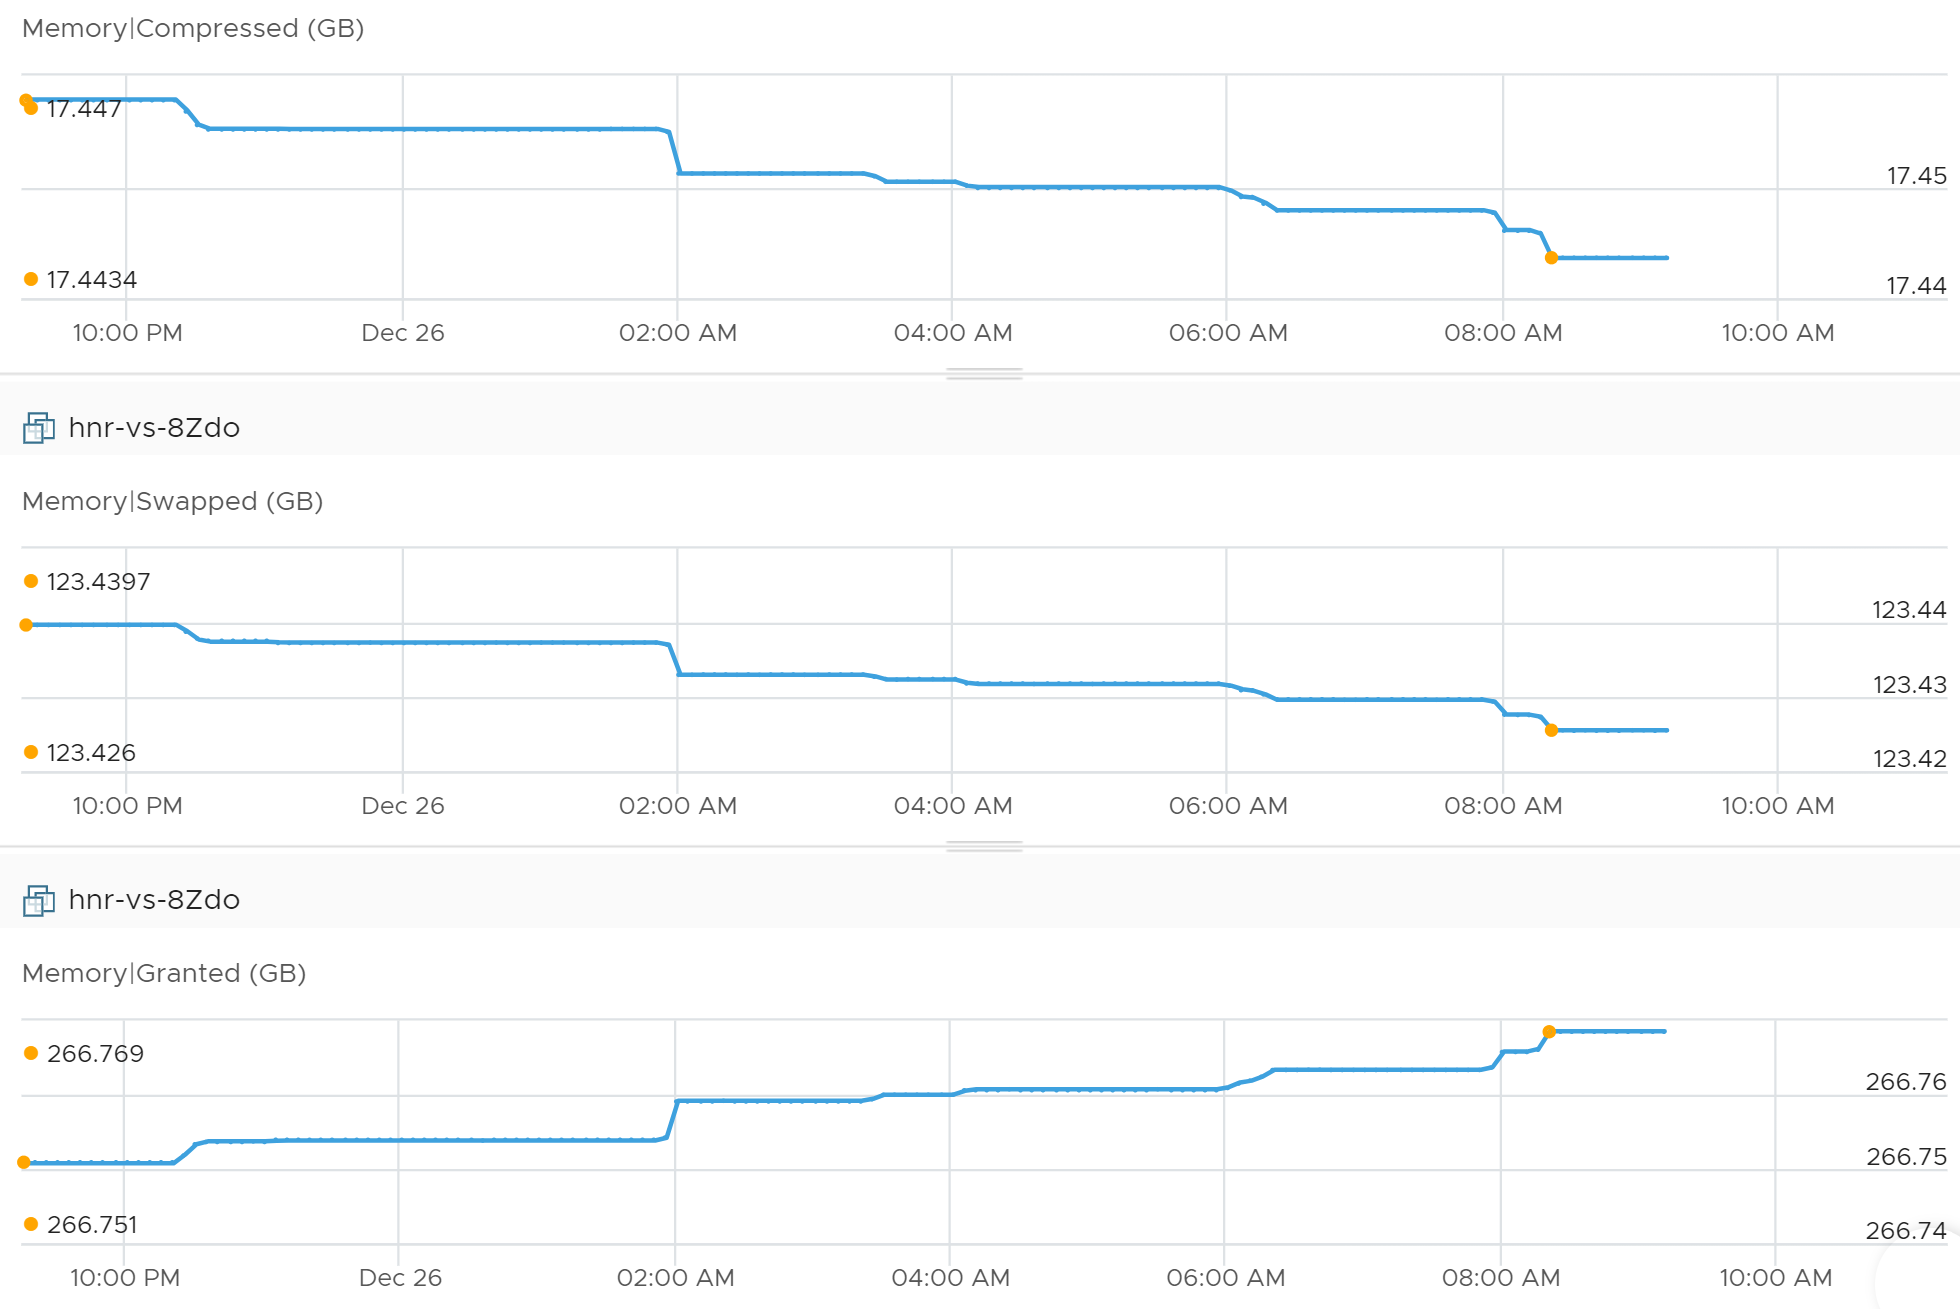
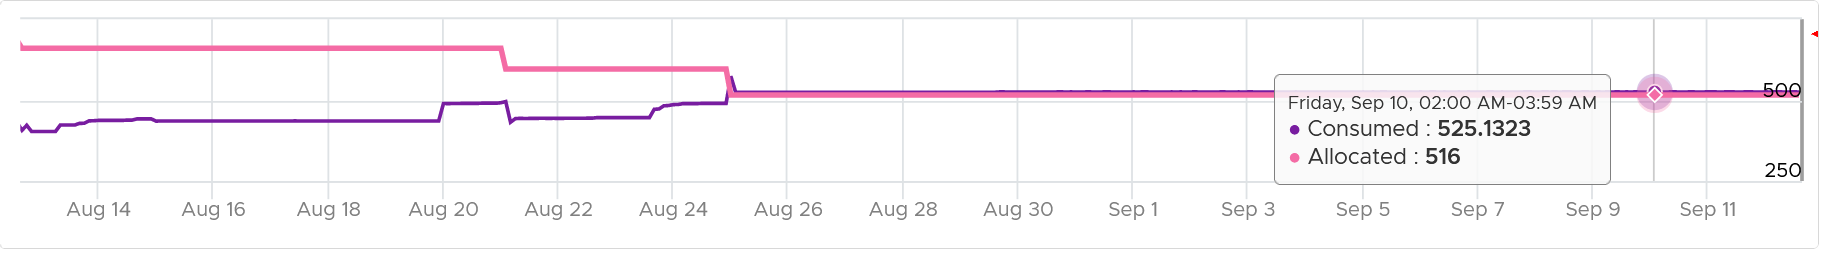
Take a look at the following VM. The chart is hard to read, so read the table below it.
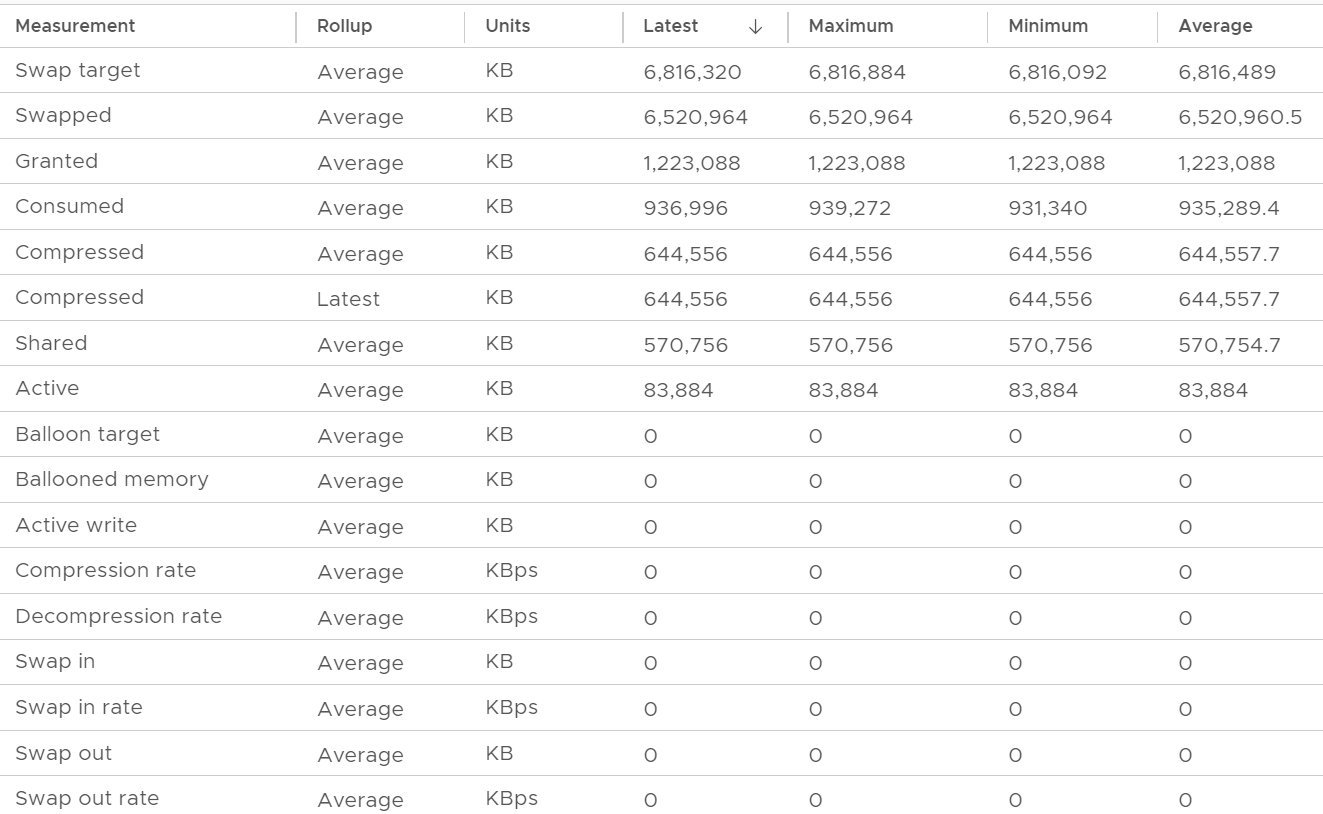
The 1st line (highest) is Swap Target. It’s hovering around 6.8 million KB. It’s fluctuating every 20 seconds (I did zoom in). ESXi does not have to achieve this if it does not need it.
The 2nd line is actual swapped. It’s also constant in the last 1 hour. You can see the maximum and minimum are the same. The VM does not have limit, and it’s not part of resource pool, so this could be historical.
The 3rd line shows the amount granted. It’s also constant, indicating the VM does not ask for more.
The 4th line shows the amount consumed. It did fluctuate. I zoomed in and confirmed there were minor fluctuations. This is interesting since all other counters are 0.
The patterns of Consumed and Swap Target are mirror image. When Consume goes up, the target swap goes down.
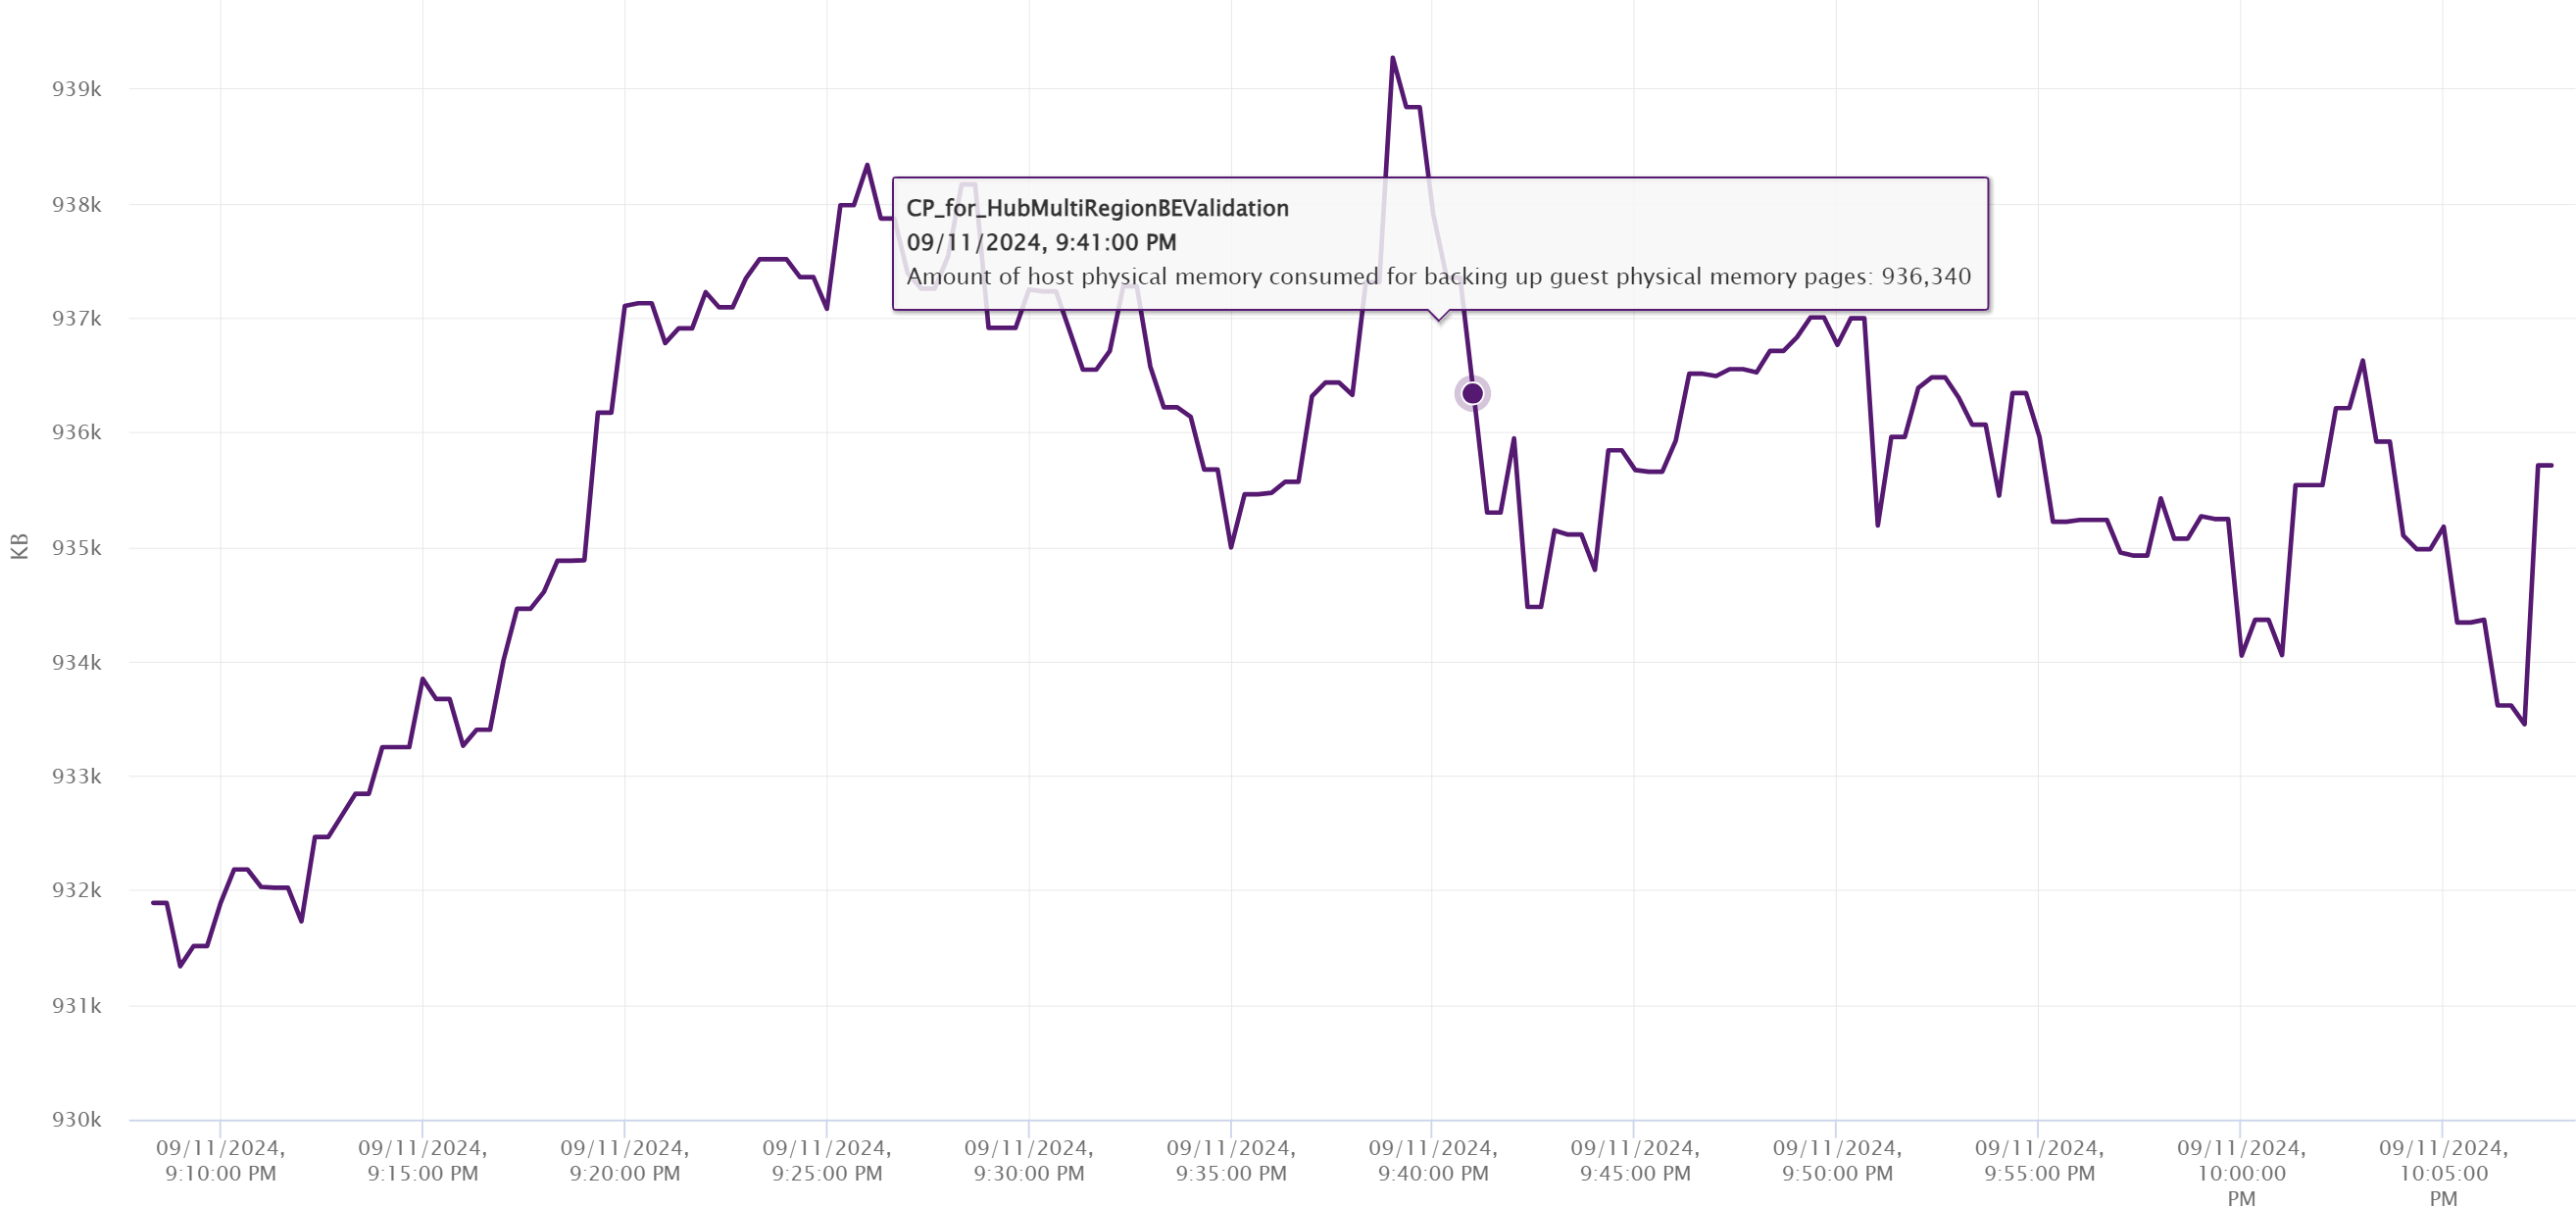
Active is a sample. So it could be constant even though it should not be in this case as Consumed was not constant.
ESXi
Compared with CPU metrics, vCenter provides even more metrics for memory: 38 metrics for RAM plus 11 for the kernel RAM. The kernel has around 50 processes that are tracked. As a result, a cluster of 8 ESXi can have > 800 metrics just for ESXi RAM.
We will cover each metric in-depth, so let’s do an overview first.
Overview
Just like the case for VM, the primary counter for tracking performance is Page-fault Latency. Take note this is normalized average, so use the Max VM Memory Contention instead.
The contention could be caused by swapping in the past. You’ve got only 5, not 6 metrics for swap. Which counter is missing?
Swap target is missing. It can be handy to see the total target at ESXi level.
Swap and Compress go hand in hand, so we should check both together. Here are the compressed metrics.
I’m unsure if Compressed measures the result of the compression, or the input. My take is the former as that’s more useful from ESXi viewpoint.
Lastly, the performance could be caused by memory being read from the Host Cache. While they are faster than disk, they are still slower than physical memory.
Wait! What about Balloon?
As will cover in-depth shortly, that’s more of capacity than performance metrics. One can even say that other than Page-fault Latency, the rest of the metrics are actually for capacity not performance.
The famous balloon is a warning of capacity, assuming you do not play with limit.
When will ballooning kick in? There is a counter for that!
The memory state level shows one of the 5 possible states. You want to keep this at Clear state or High state.
For environment where performance matters more than cost, you want Balloon to be 0. That means Consume becomes your main counter for capacity. It is related to Granted and Shared.
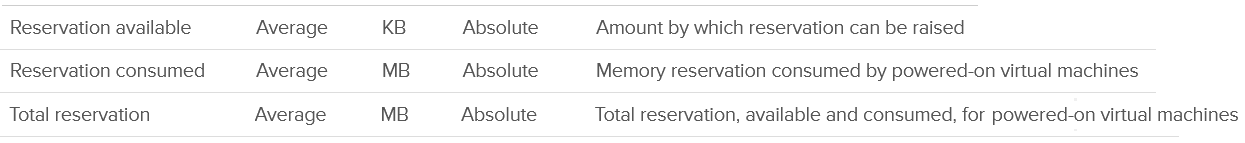
Reservation plays a big part in capacity management as it cannot be overcommitted. ESXi, being a provider of resource, has 3 metrics to properly account for reservations.
There are a few metrics covering 0 pages and overhead. The Heap counter shows the memory used by the kernel heap and other data. This is normally a constant and small value.
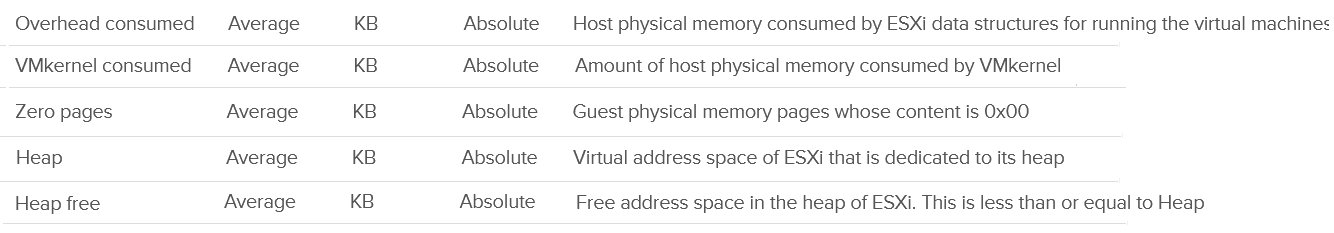
Other Metrics
Active is not a counter for capacity or performance. It’s for the kernel memory allocation.
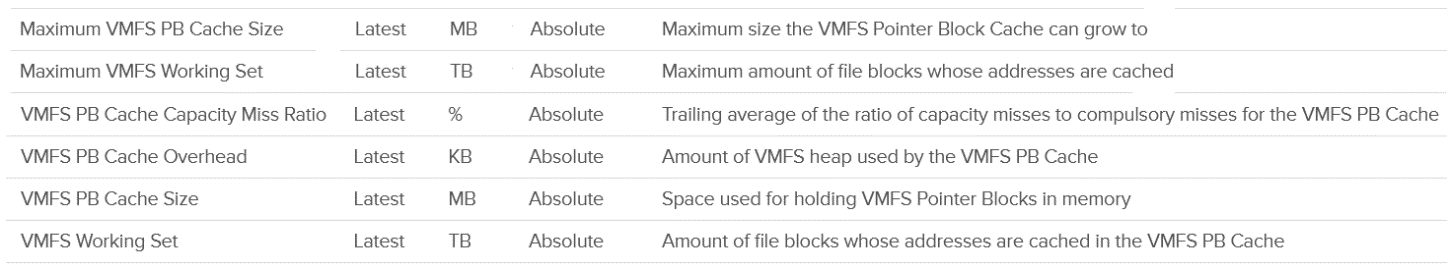
Persistent Memory

Lastly, there are a few metrics for VMFS pointer block cache. Read more here. They are internal, only used by the kernel. The only one you might be interested in the cache capacity miss ratio. Let me know if you have a real-world use case them.
“Contention” Metrics
I put the title in “quote” as none of these counters actually measure contention.
I do not cover the Latency metric as that’s basically a normalized average of all the running VMs on the host.
Balloon
Balloon is a leading indicator that an ESXi is under memory pressure, hence it’s one of the primary metrics you should use in capacity. Assuming you’re not using Limit to artificially cap the resource, you should ensure that the balloon amount does not cause VM to experience contention.
We know that contention happens at hypervisor level, not at VM level. The VM is feeling the side effects of the contention, and the degree of contention depends on each VM's shares, reservation and utilization. ESXi begins taking action if it is running low on free memory. This is tracked by a counter called State. The State counter has five states, corresponding to the Free Memory Minimum (%) value
| ESXi State | Threshold | 1 TB ESXi | Example based on ESXi with 1 TB RAM |
|---|---|---|---|
| High | 300% | 32.4 GB | First, we calculate the Free Memory Minimum value. There is many website to help you with this, such as this. For 1 TB, the value is 10.8 GB. |
| Clear | 100% | 10.8 GB | |
| Soft | 64% | 6.9 GB. Balloon starts here | |
| Hard | 32% | 3.5 GB. Compress/Swap starts here | |
| Low | 16% | 1.7 GB. Block execution |
Using the example above, let’s see at which point of utilization does ESXi triggers balloon process.
| ESXi State | 512 GB ESXi | 1 TB ESXi | 1.5 TB ESXi |
|-------------------|-----------------|---------------|-----------------|
| Balloon Threshold | 3.7 GB | 6.9 GB | 10.2 GB |
| Threshold | 508.3 GB | 993.1 BB | 1489.8 GB |
| Threshold in % | 99.3% | 99.3% | 99.3% |
As you can see from all the 3 ESXi, balloon only happens after at least 99% of the memory it utilized. It’s a very high threshold. Unless you are deliberately aiming for high utilization, all the ESXi should be in the High state.
In addition, the spare host you add to cater for HA or maintenance mode will help in lowering the overall ESXi utilization. Let’s use example to illustrate
-
No of ESXi in a cluster = 12
-
Provisioned for HA = 11
-
Target ESXi memory utilization = 99% (when HA happens or planned maintenance)
-
Target ESXi memory utilization = 99% x 11 / 12 = 90.75% (during normal operations)
Using the above, you will not have any VM memory swapped as you won’t even hit the ballooned stage. If you actually see balloon, that means there is limit imposed.
The Low Free Threshold (KB) counter provides information on the actual level below which ESXi will begin reclaiming memory from VM. This value varies in hosts with different RAM configurations. Check this value only if you suspect ESXi triggers ballooning too early.
ESXi memory region can be divided into three: Used, Cached and Free
-
Used is tracked by Active. Active is an estimate of recently touched pages.
-
Cached = Consumed - Active. Consumed contains pages that were touched in the past, but no longer active. I'm not sure Ballooned pages are accounted in Consumed, although logically it should not. It should go to Free so it can be reused.
-
Free = Total Capacity - Consumed.
The nature of memory as cache means the active part is far lower than the non-active part. It’s also more volatile. The following shows an ESXi with low memory usage, both active and consumed, in the last 3 months.
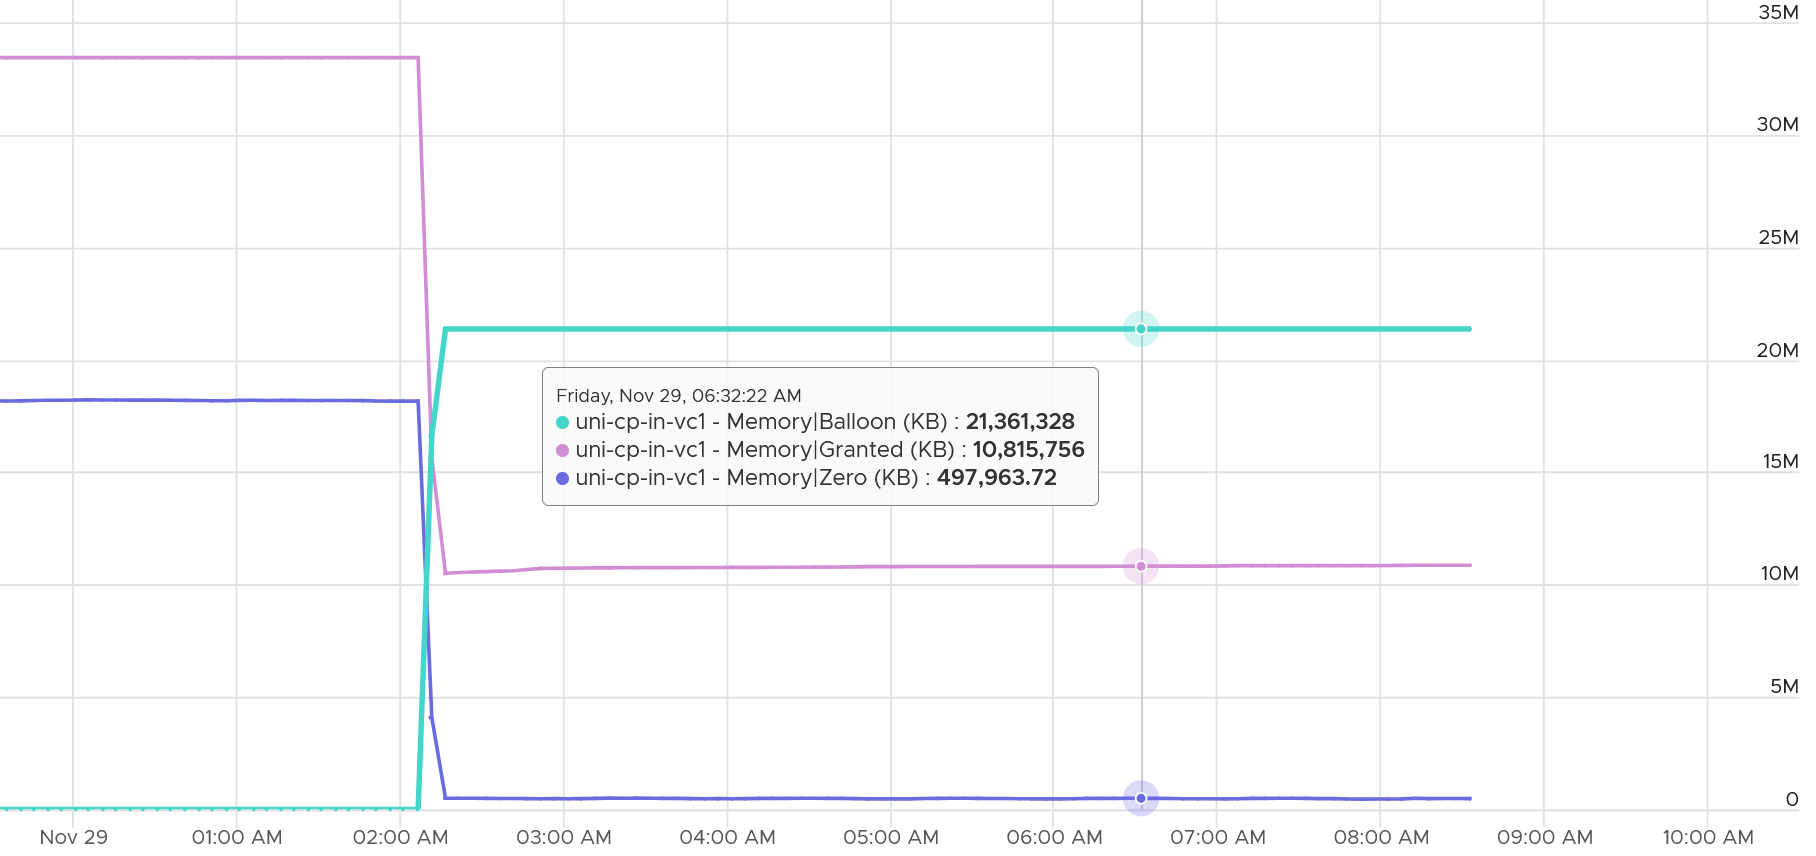
Let’s look at an opposite scenario. The following ESXi is running at 100%. It has granted more memory than what it physically has. Initially, since the pages are inactive, there is no ballooning. When the active rise up, the consumed counter goes up and the balloon process kicks in. When the VM is no longer using the pages, the active counter reflects that and ESXi begin deflating the balloon and giving the pages back.
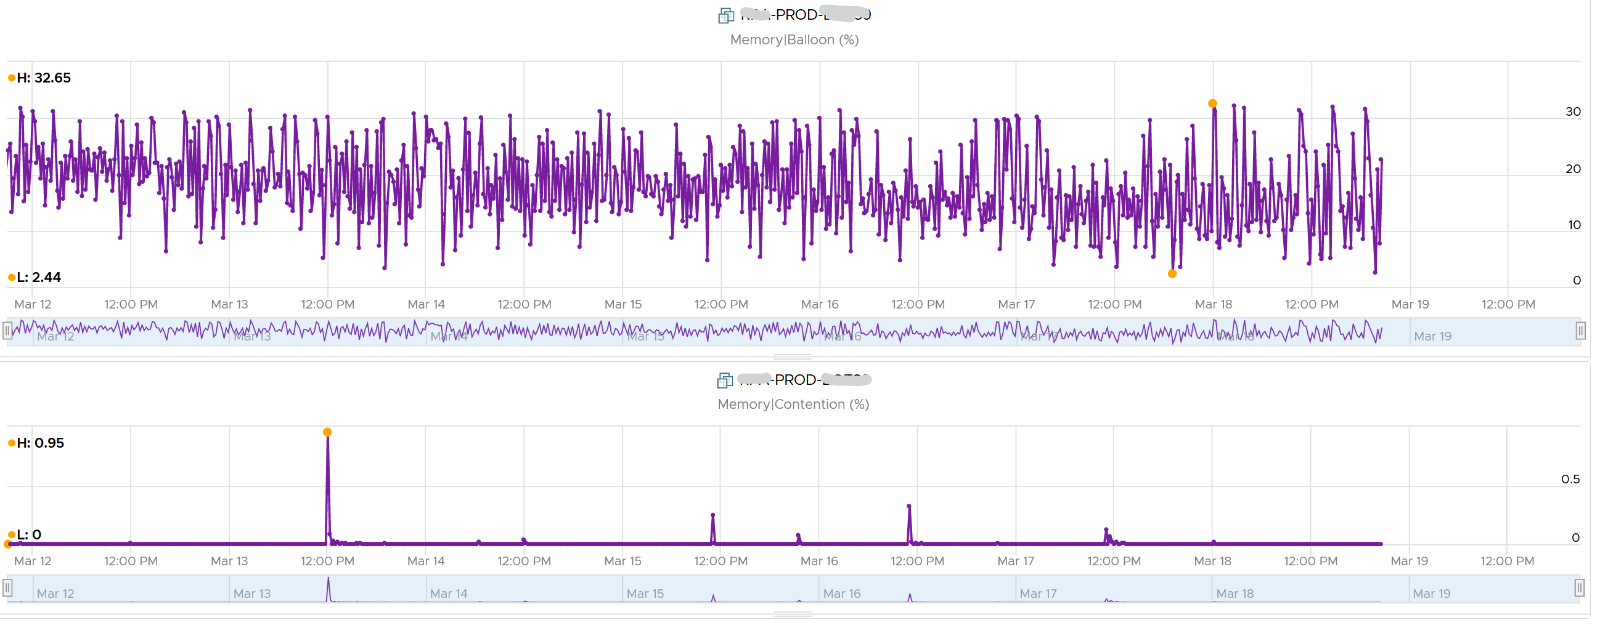
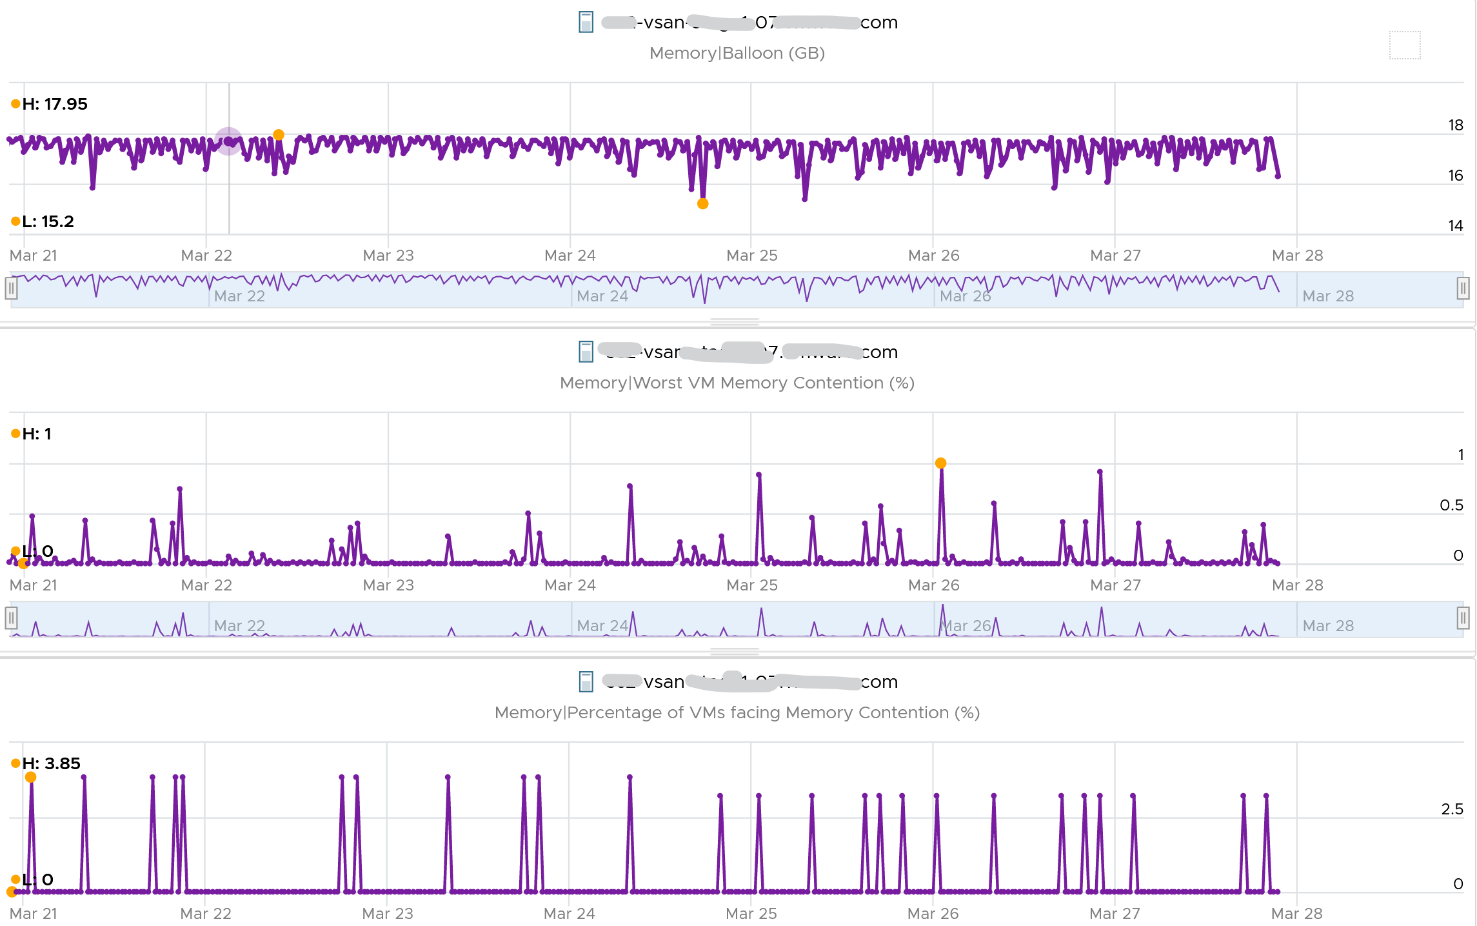
I shared in the VM memory counter that just because a VM has balloon, does not mean it experiences contention. You can see the same situation at ESXi level. The following ESXi shows a constant and significant balloon lasting at least 7 days. Yes the worst contention experienced by any VM is not even 1%, and majority of its 19 VMs were not experiencing contention at all.
Swap + Compress
For swap, the metric is the summation of running VMs and the kernel services.
For compress, there are 2 counters at ESXi level. The first is the sum of all amounts that were subjected to compressed. The second is the resultant compressed amount.
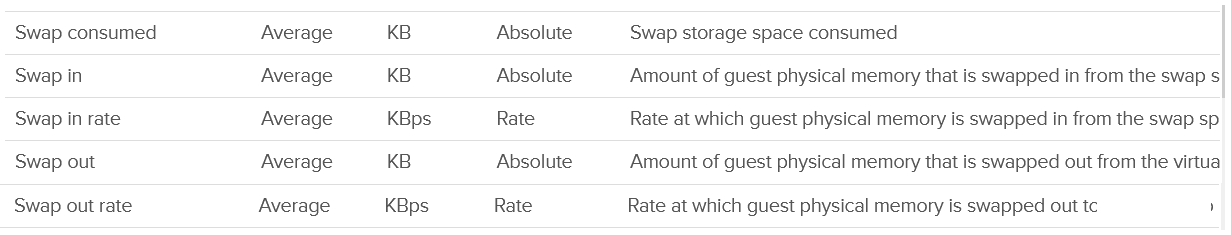
| Metrics | Description |
| Swap Consumed | Sum of memory swapped of all powered on VMs and vSphere services on the host. This number will reduce if pages are swapped back into the DIMM. I think this is swapped out – swapped in. |
| Swap In | The total amount of memory that have been swapped in or out to date. Note: These counters are accumulative. |
| Swap Out | |
| Swap In Rate | I think this includes compressed, not just swapped, but I’m not 100% sure as I can’t find a proof yet. |
| Swap Out Rate |
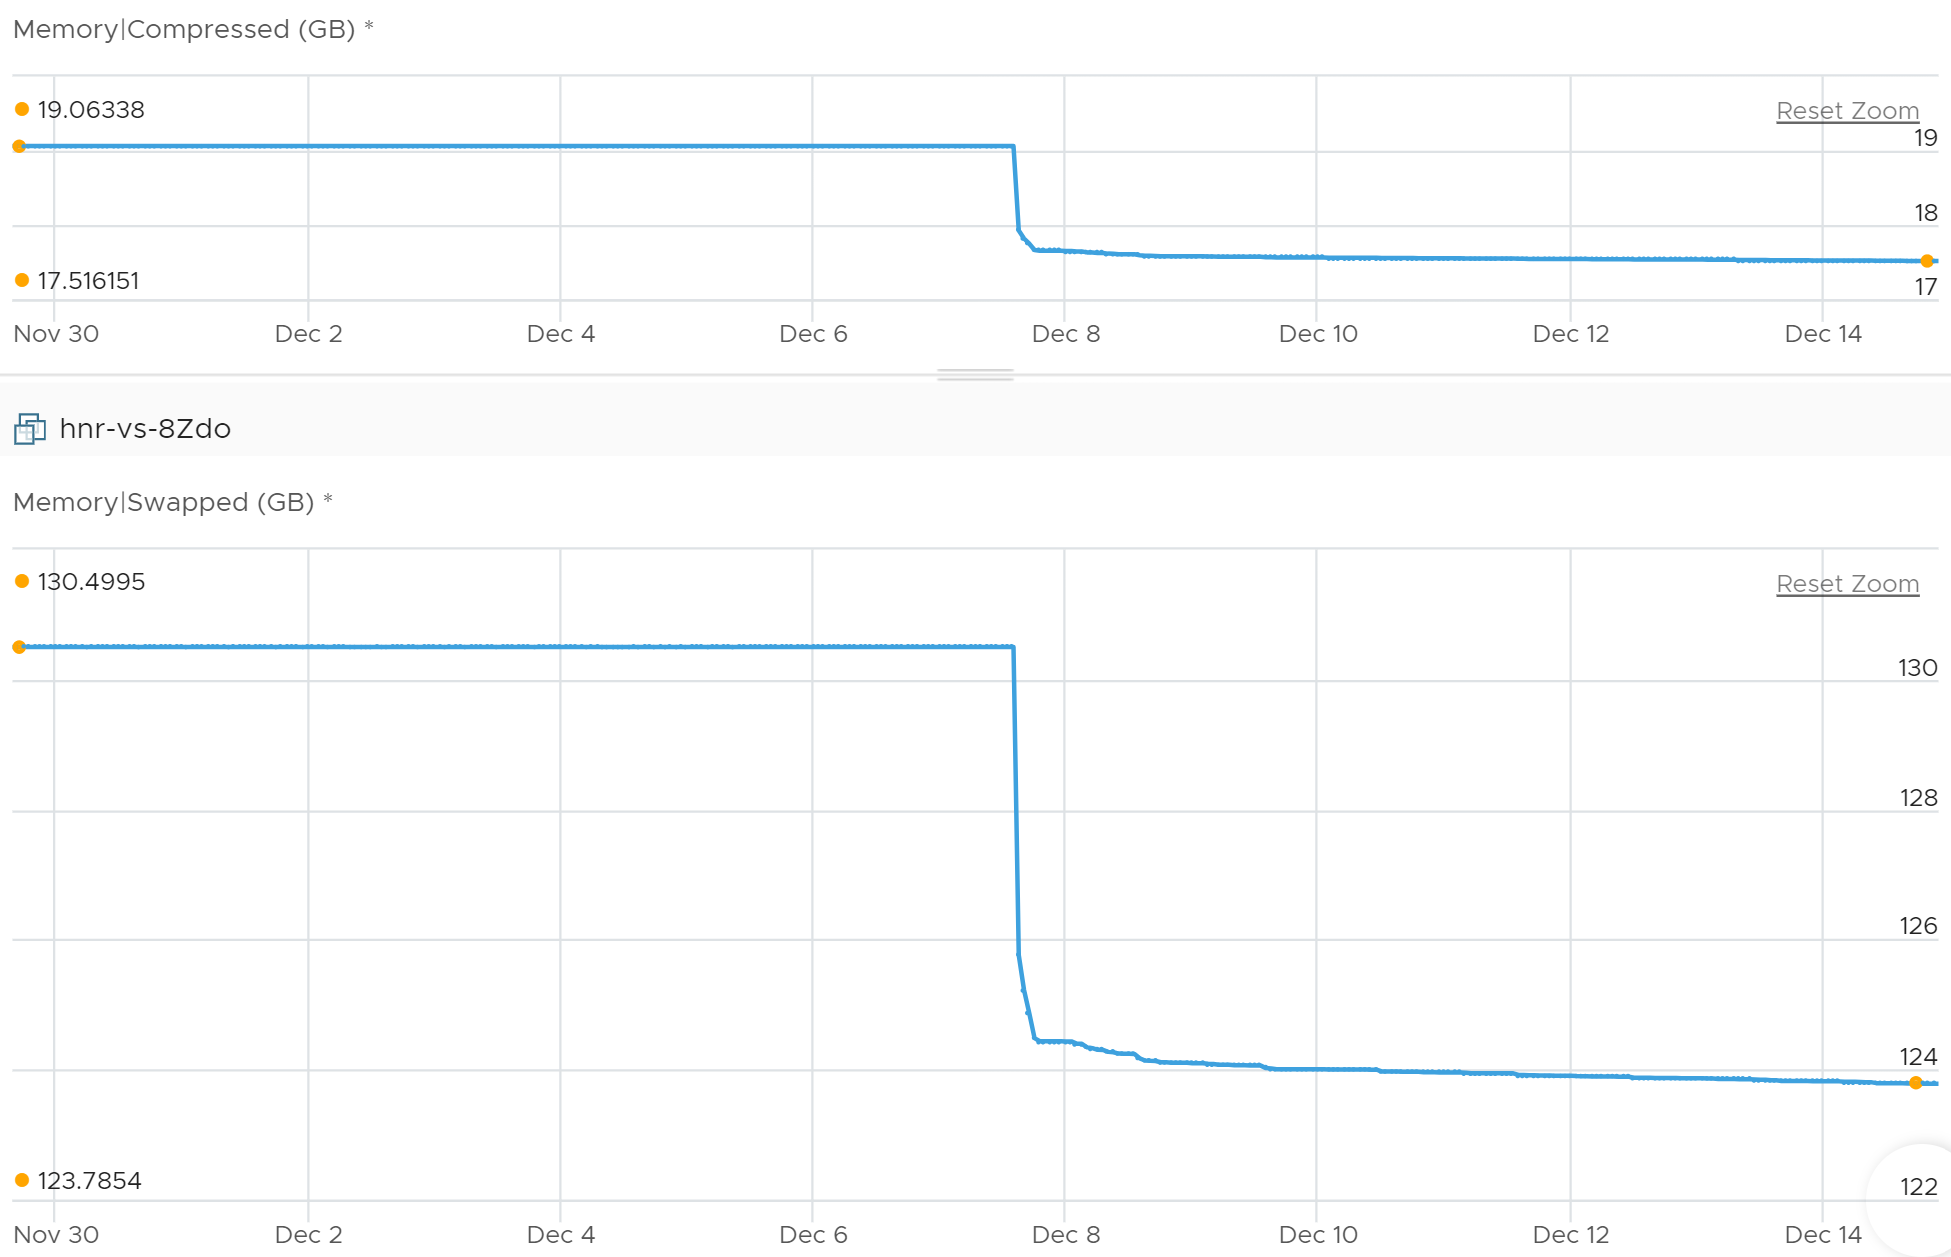
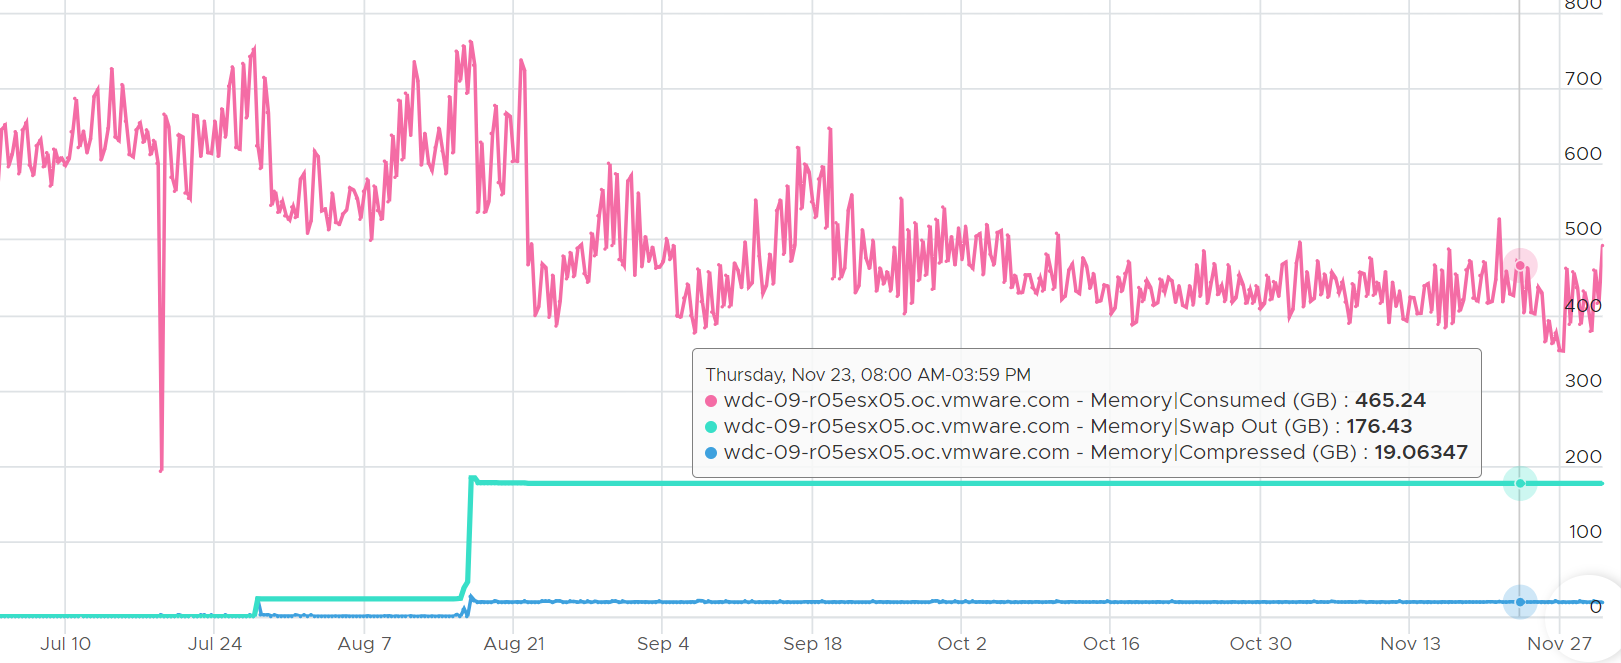
Pages can and will remain in compressed or swapped stage for a long time. The following screenshot shows compressed remains around 5 GB for around 1 year.
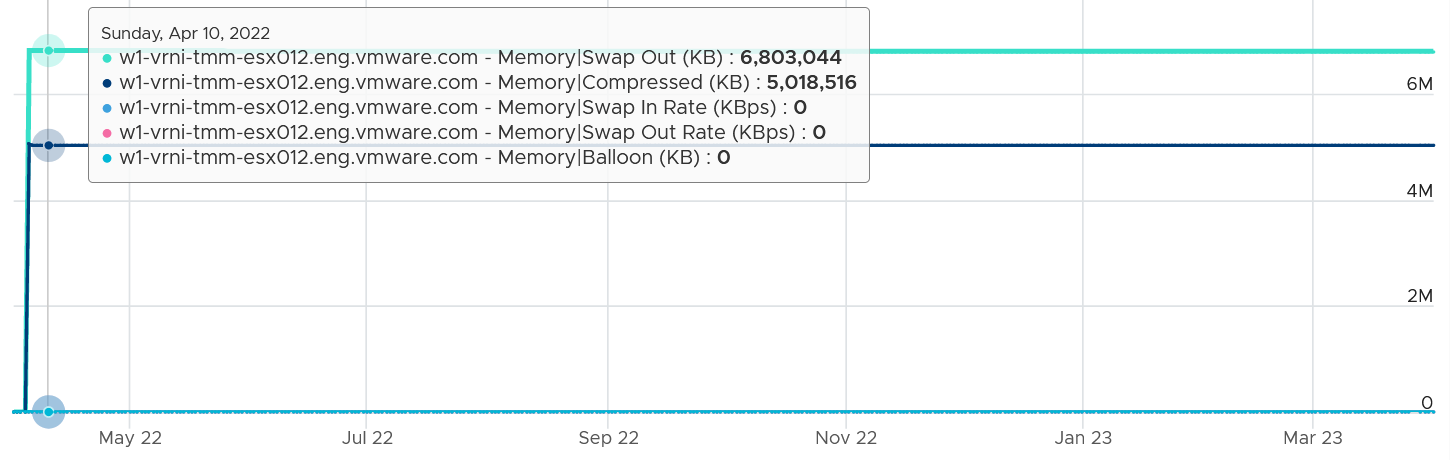
The above happened because there was no need to bring back those pages. Notice ballooning was flat 0, indicating the ESX host was not under memory pressure.
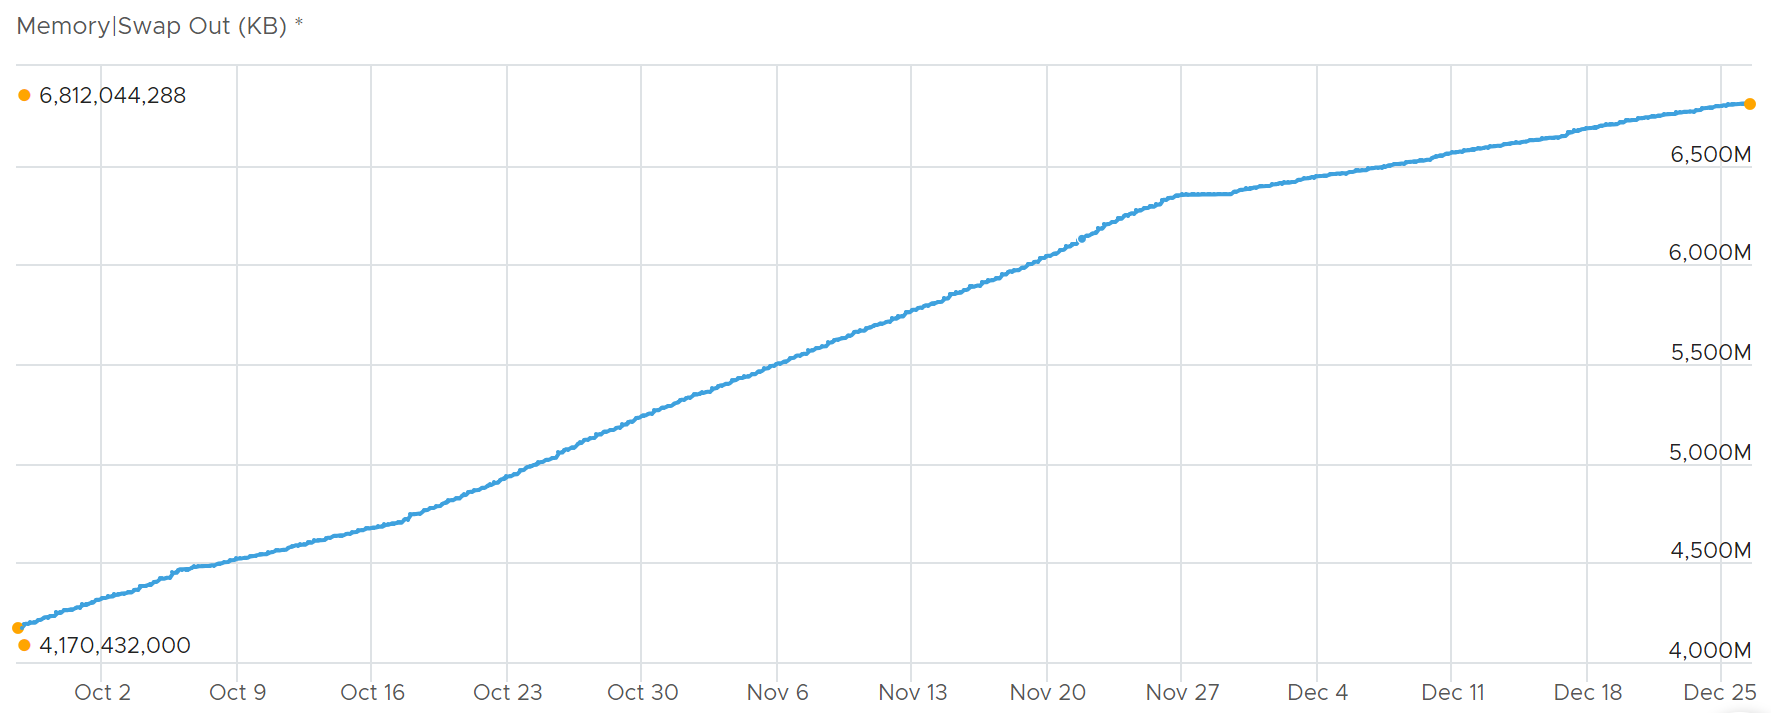
Swap Out is an accumulative counter.
Let’s zoom in, and add the swap in and swap out counters to compare.
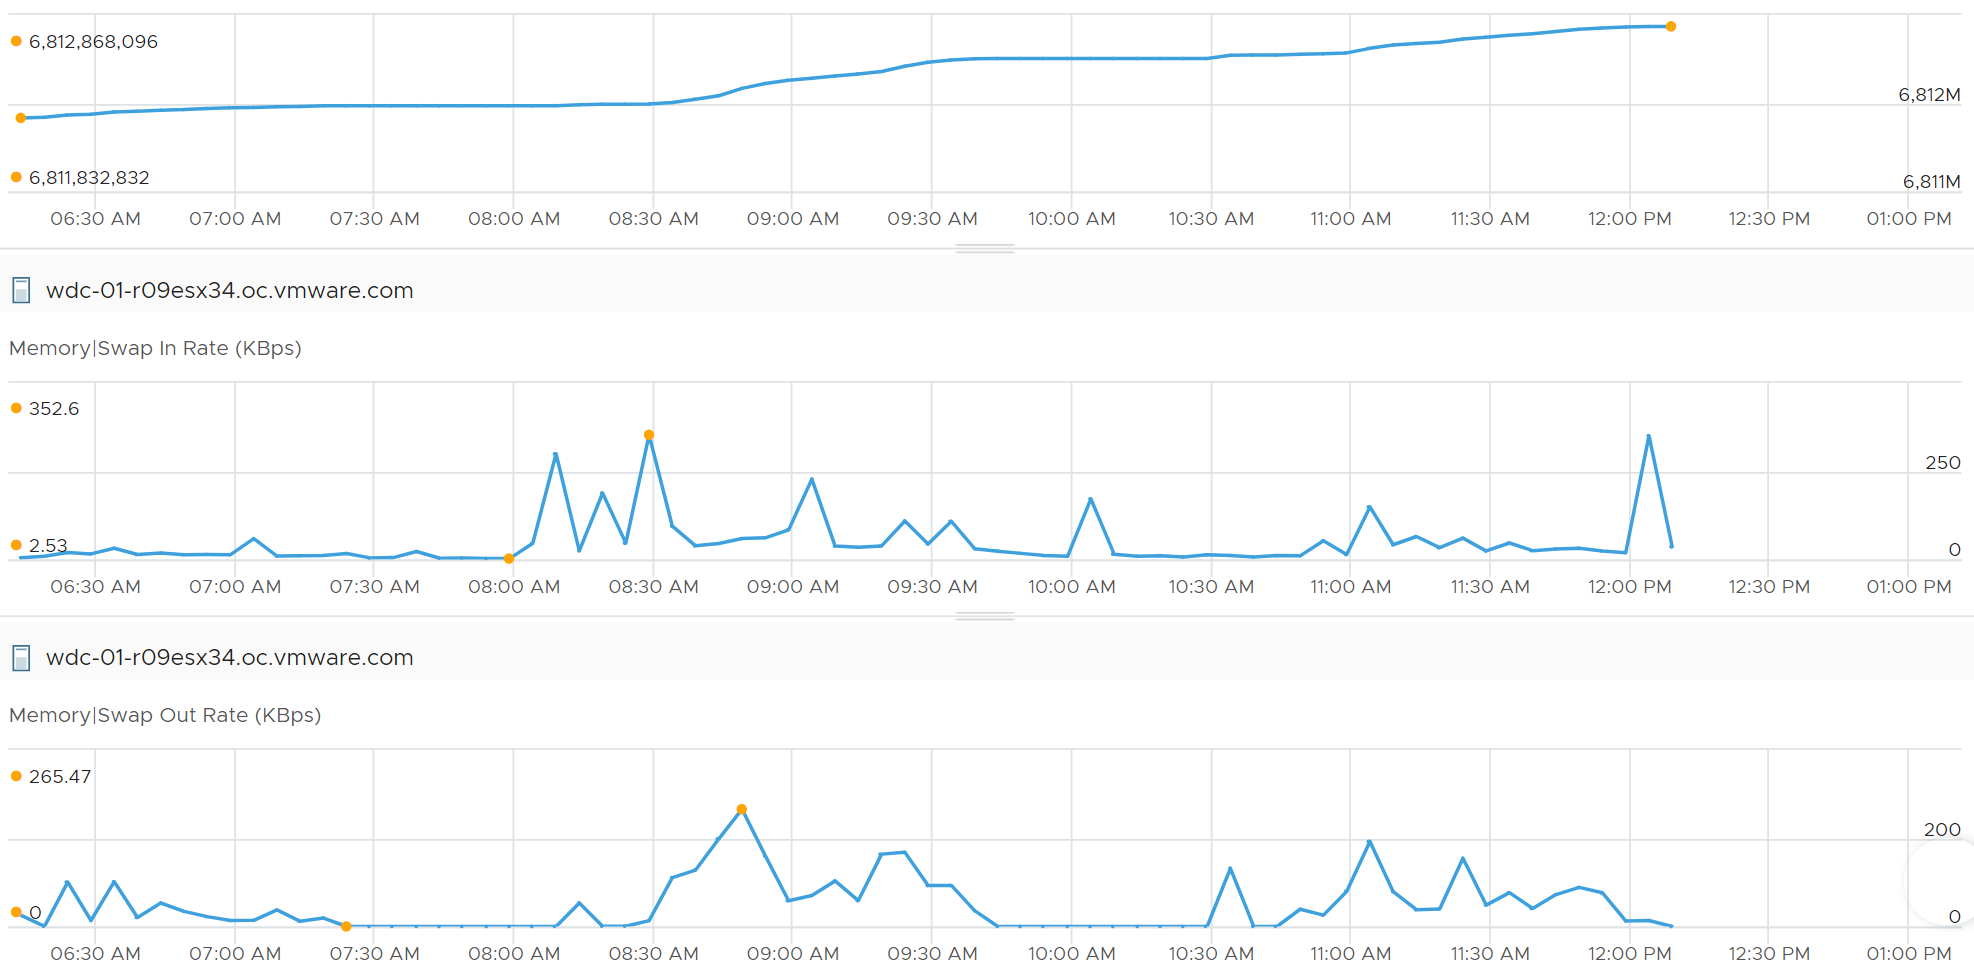
Notice the value did not go down despite swap in.
All “Together”
Balloon operates differently and works at a different layer than Swap and Compress. It takes longer to realize, and is not affected by limit. As a result, you can have 0 balloon while having swapping and zipped.
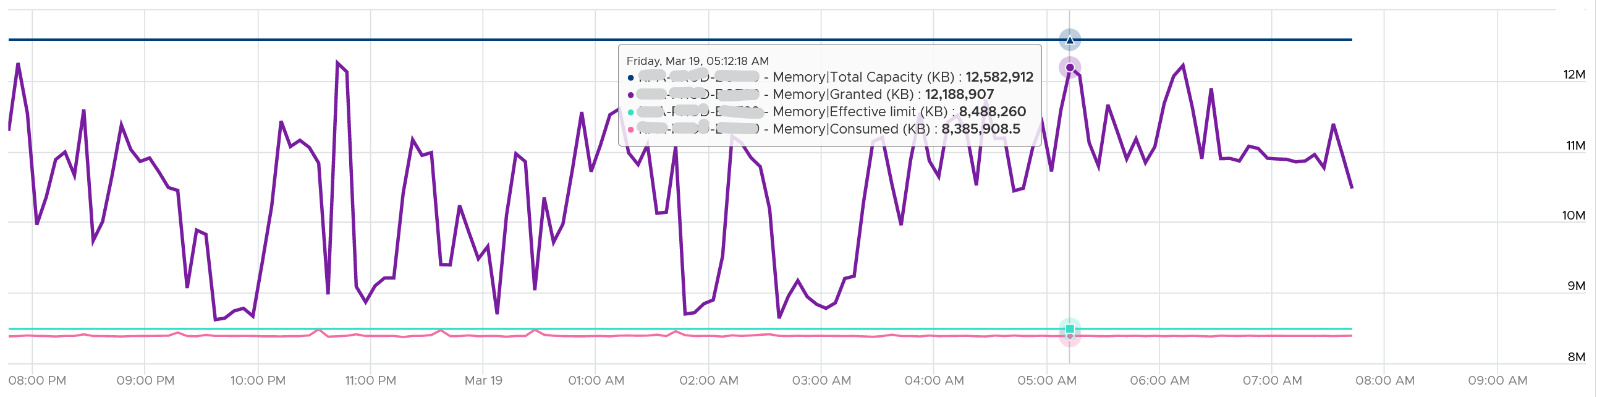
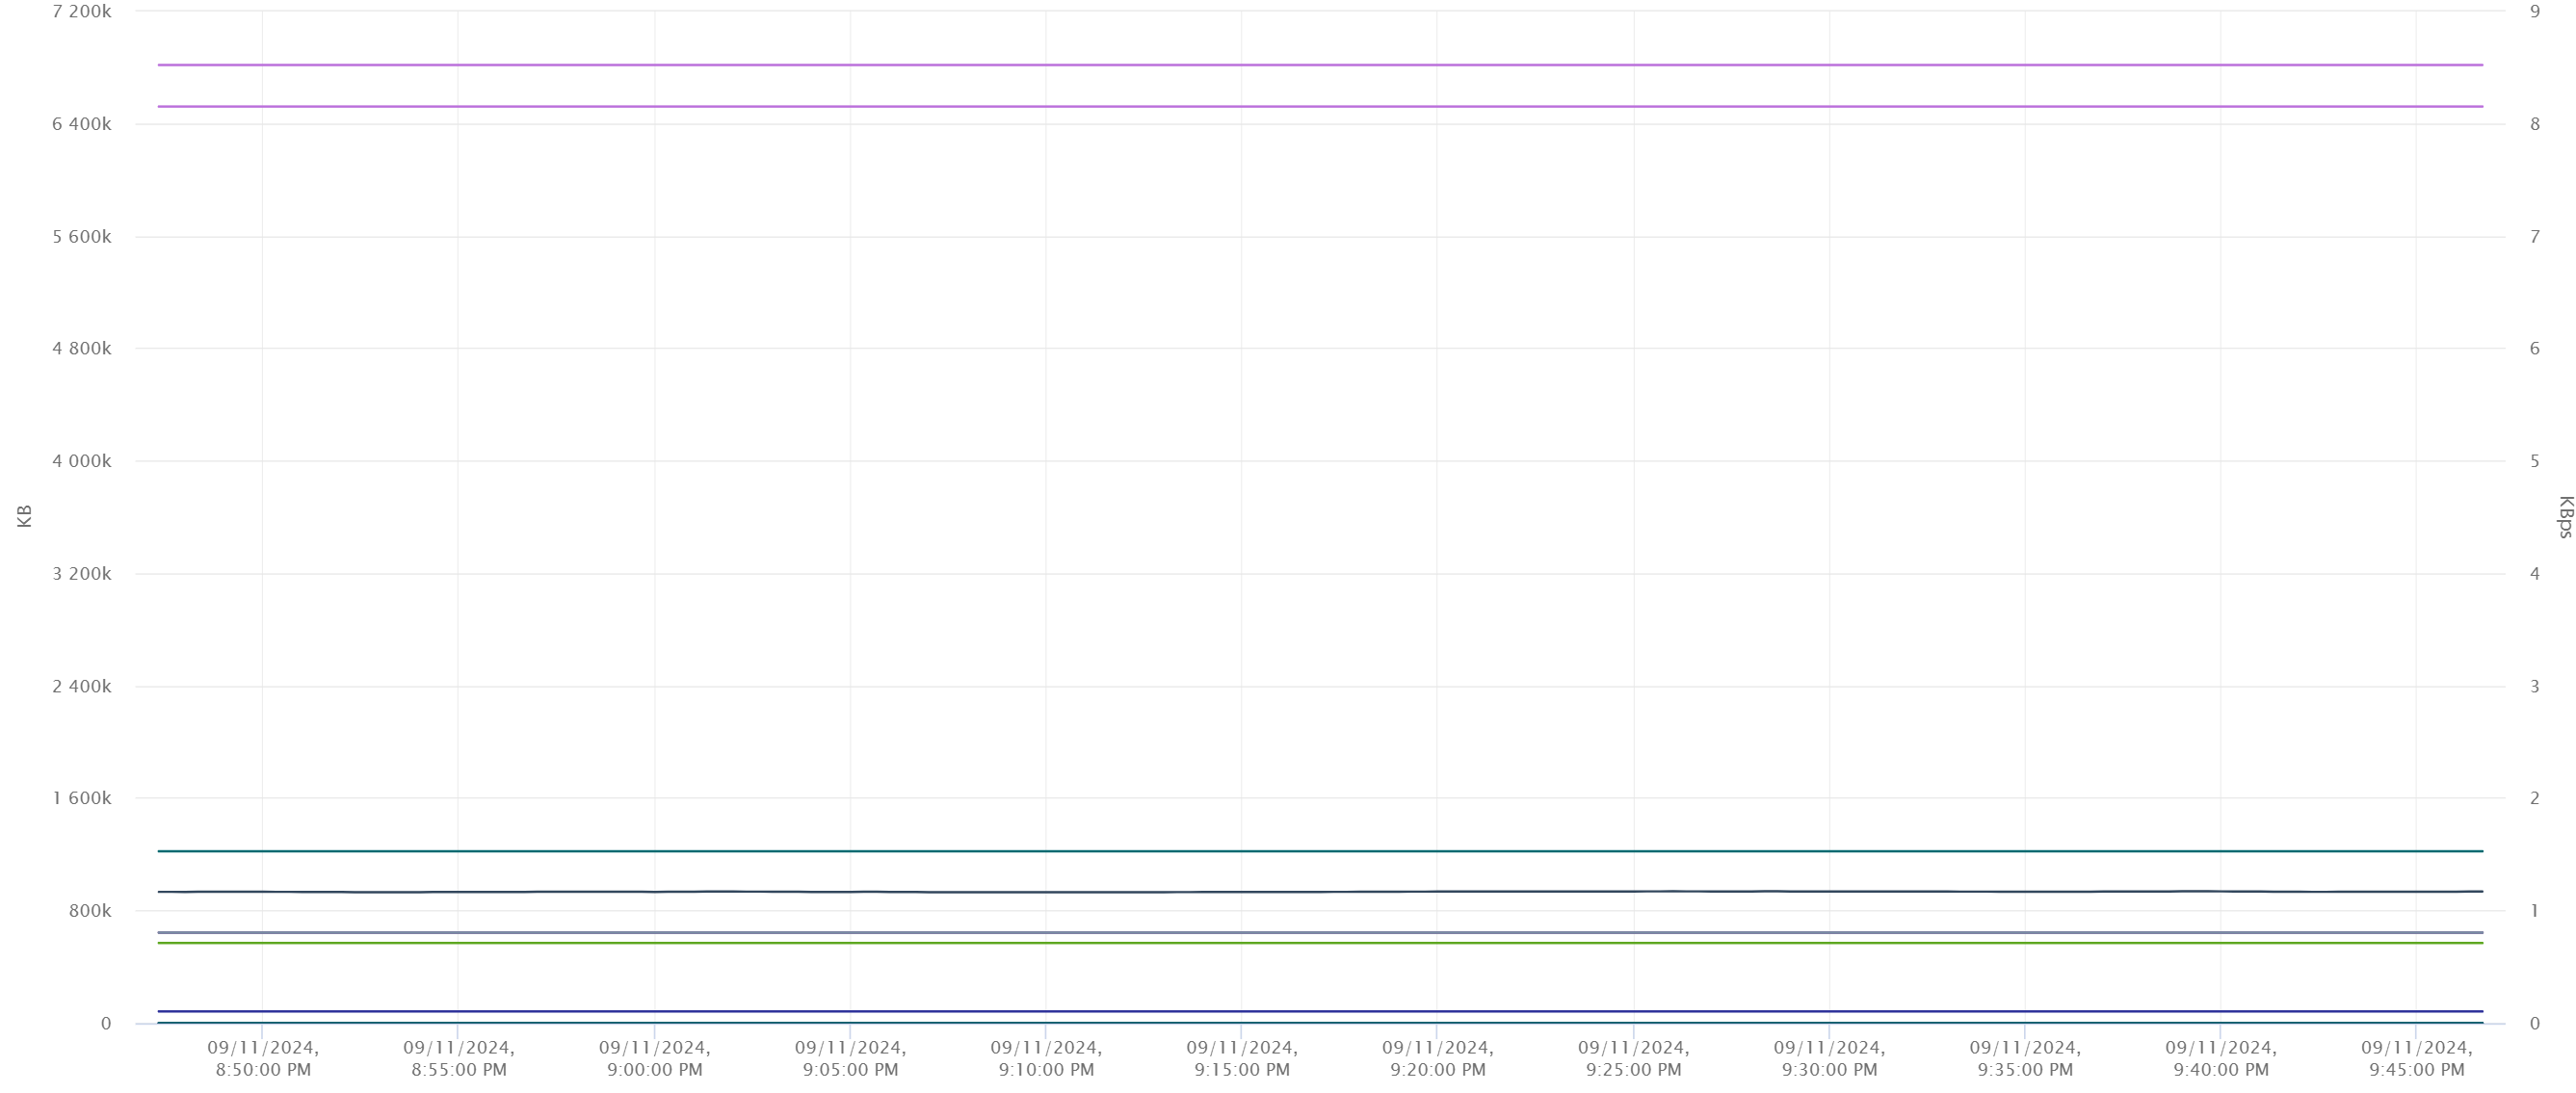
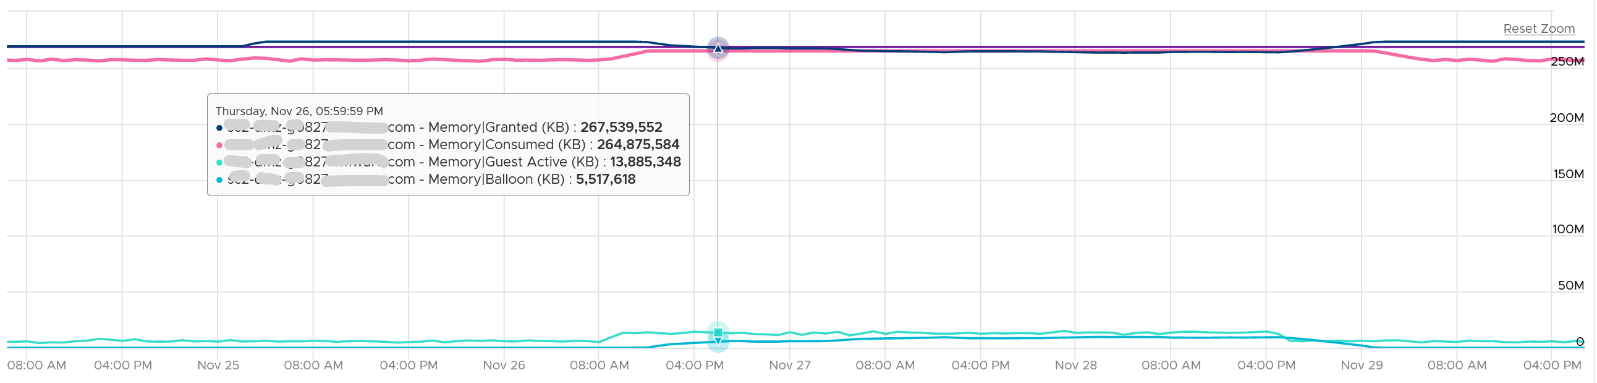
The following ESXi shows high Consume, and even higher Granted.
-
The first line (highest blue line) shows Consume is hovering around 96%.
-
The second line (purple line, just below the blue) shows Granted is hovering around 756 million KB.
-
The third line shows consumed hovering around 514 million KB. ESXi has 511.46 GB or 536,304,680 KB of memory.
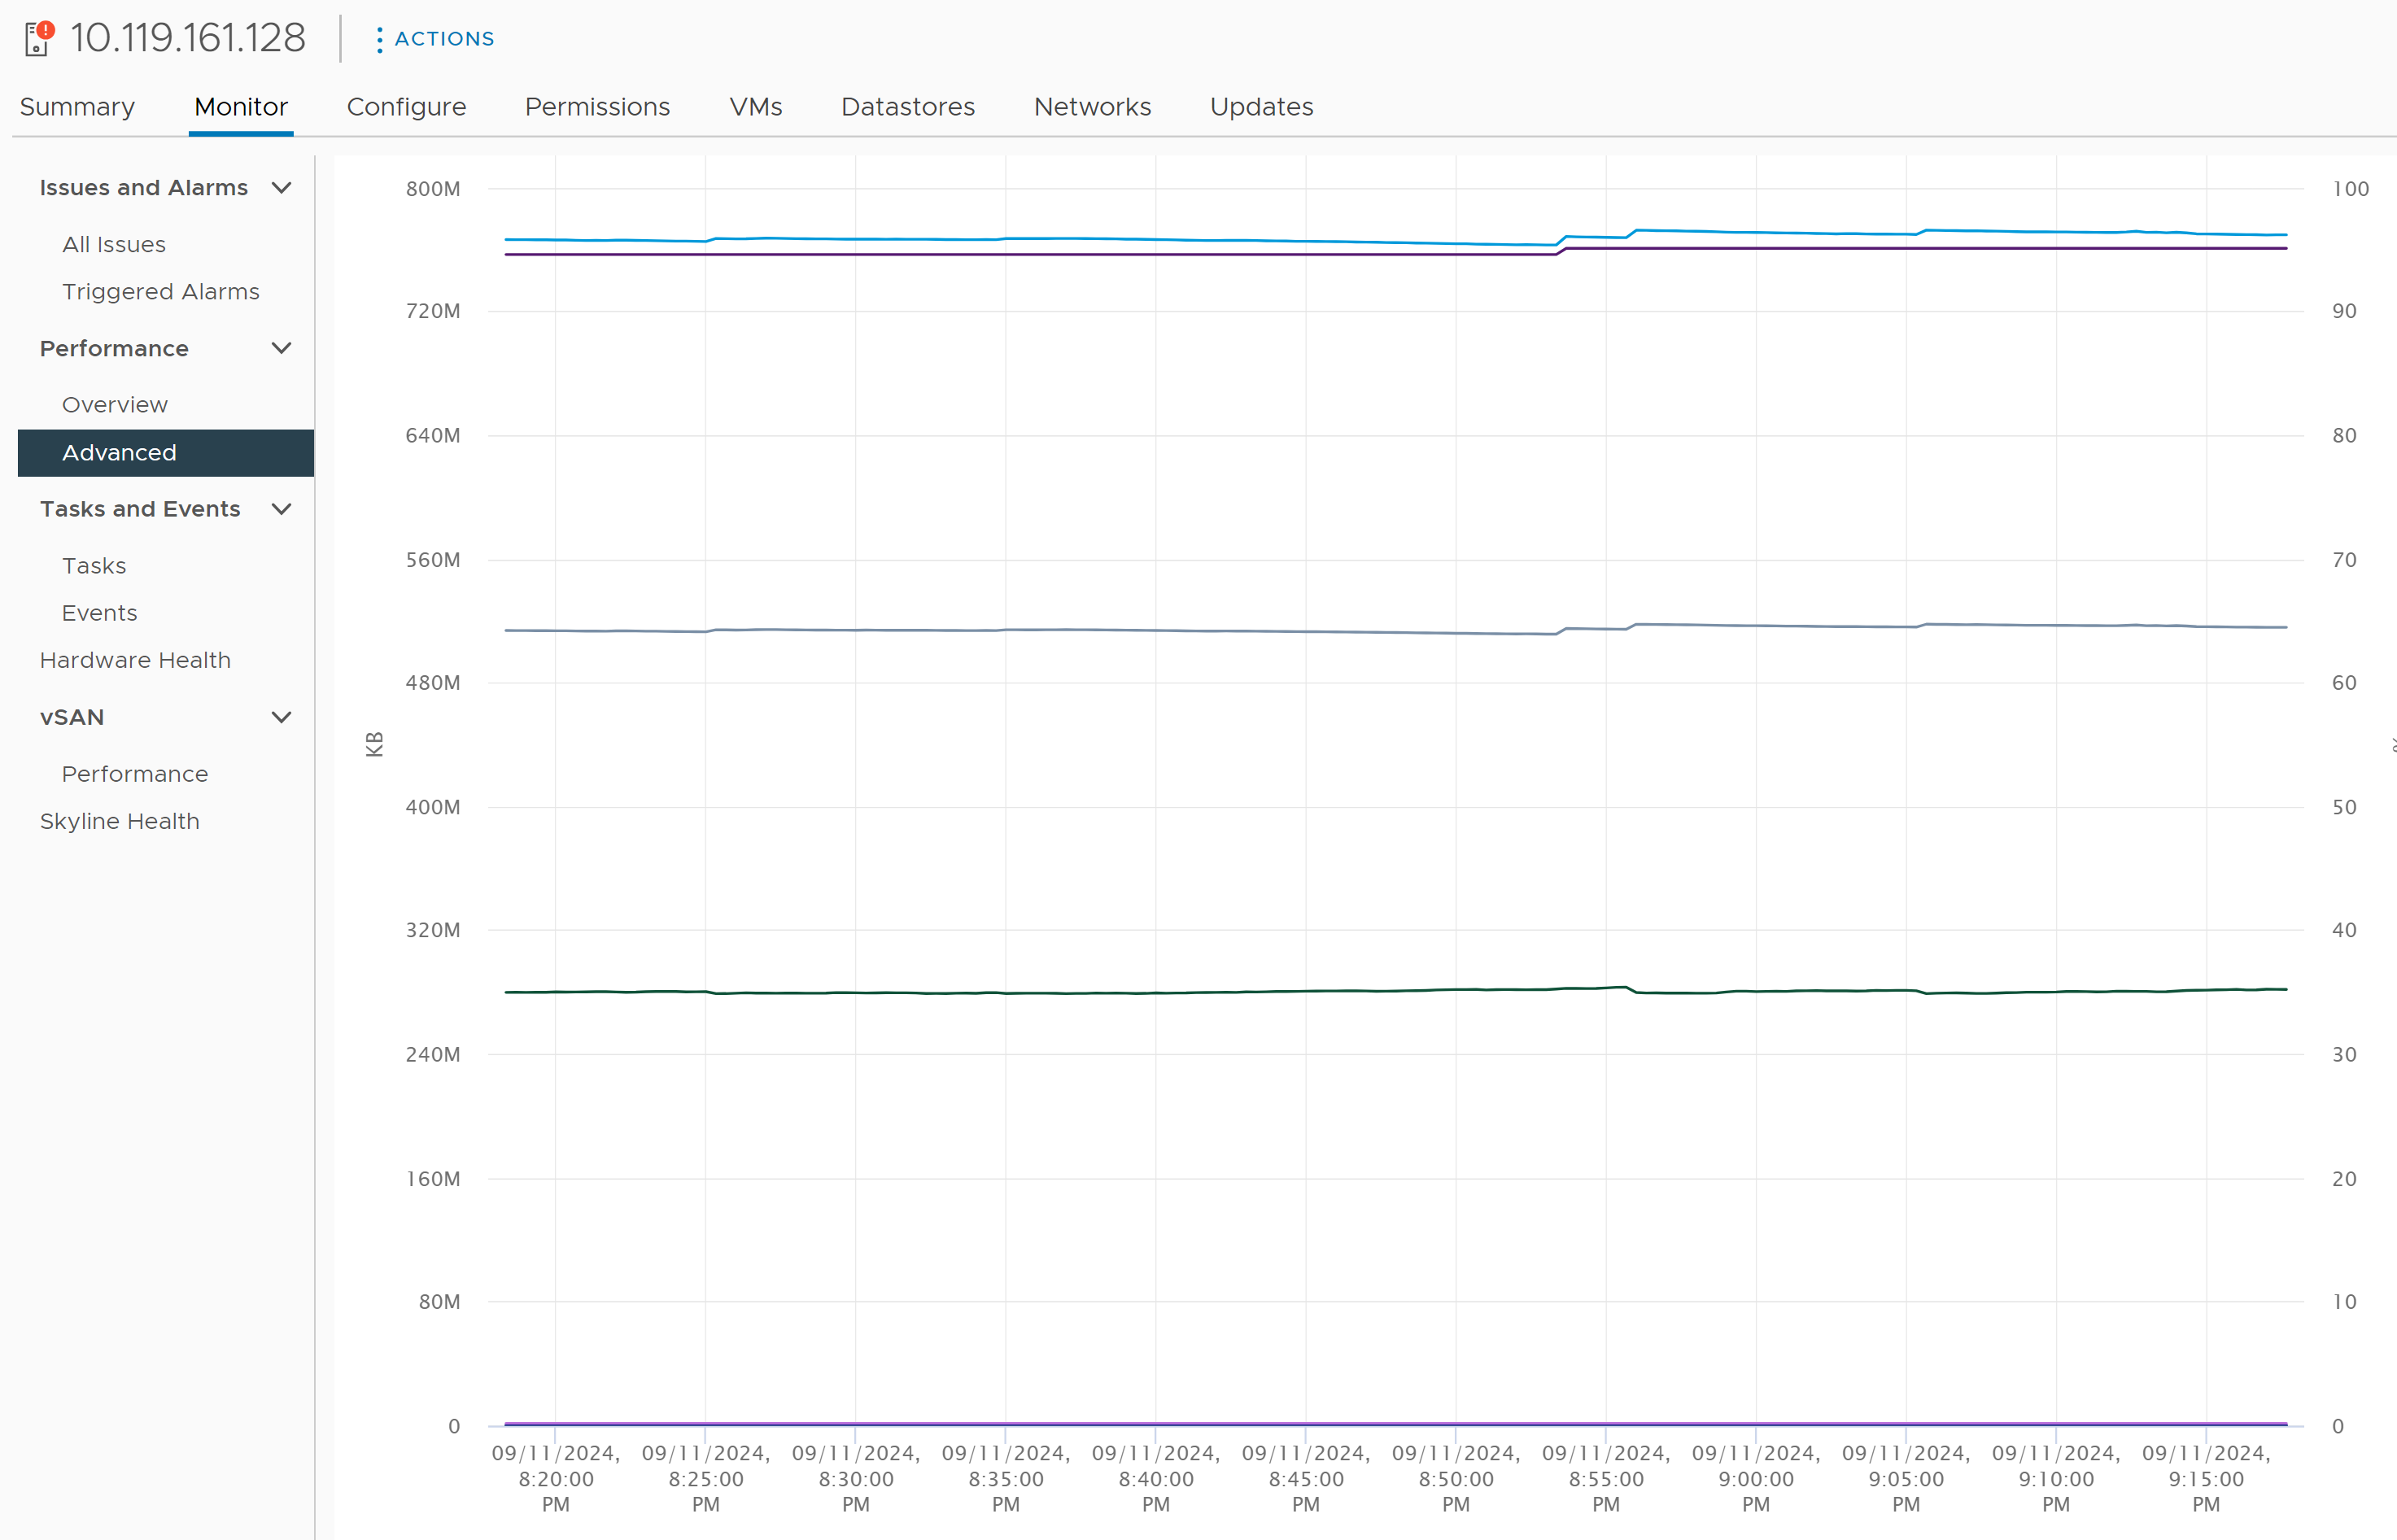
Since it’s hard to see, let’s show the table. What do you notice?
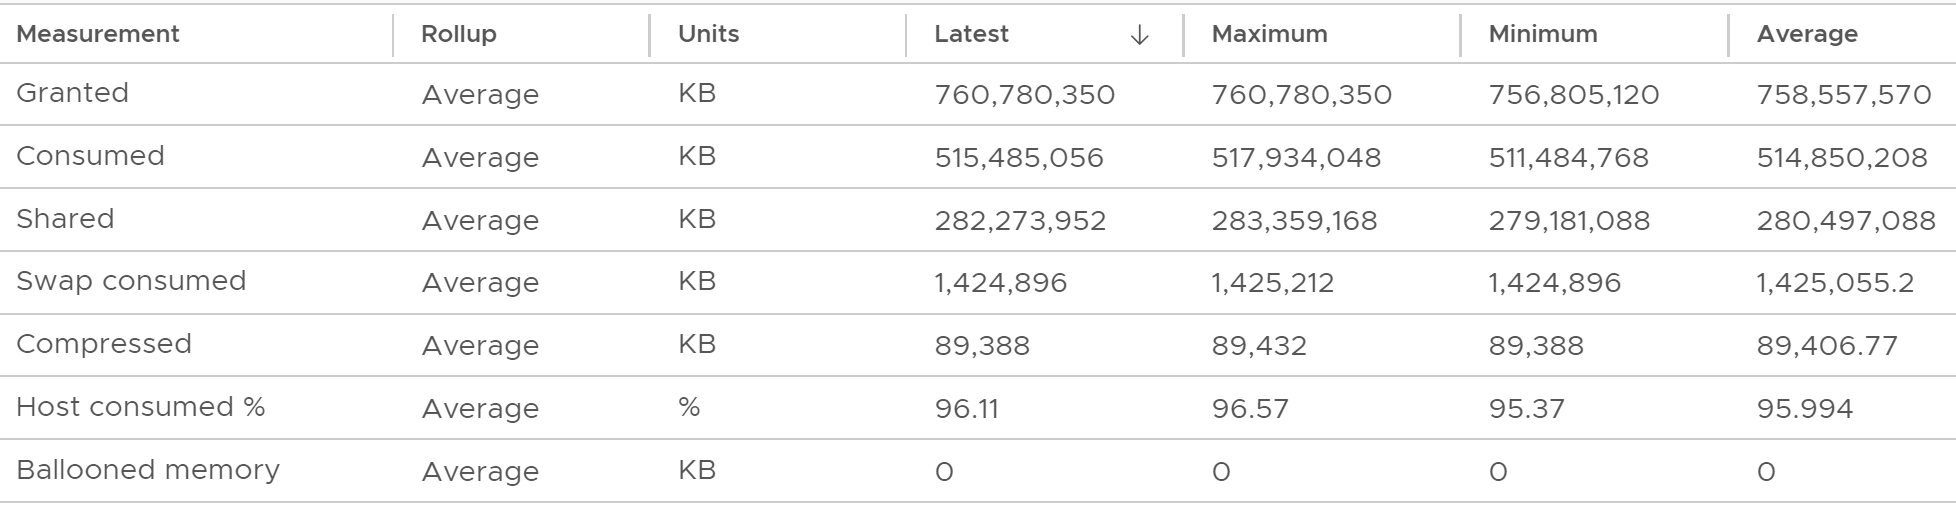
Ballooned was 0 constantly.
However, there were swapped and compressed. Let’s see if they are still happening, since these 2 counters are accumulative.
As you can see from the following chart, the amount is negligible. There are 4 instances of swap in, and each time the amount is 1 KB/second or 2 KB/second. Since the number of is the average of 20 seconds, the total amount is 20 KB or 40 KB only.
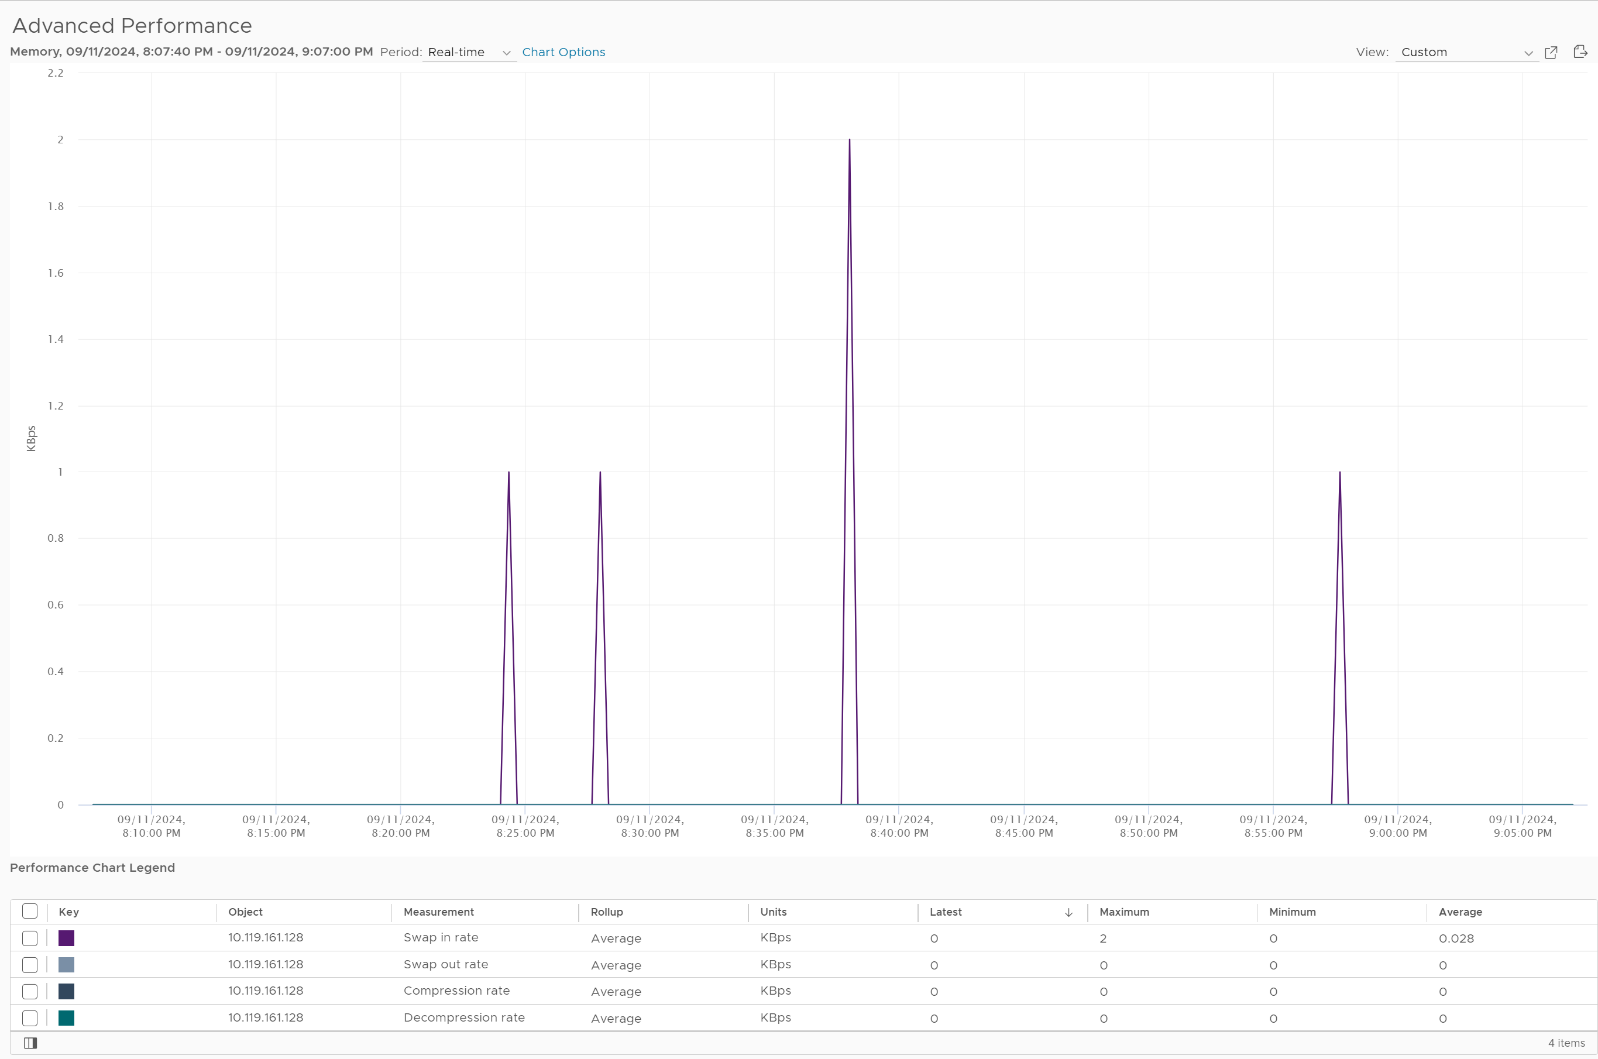
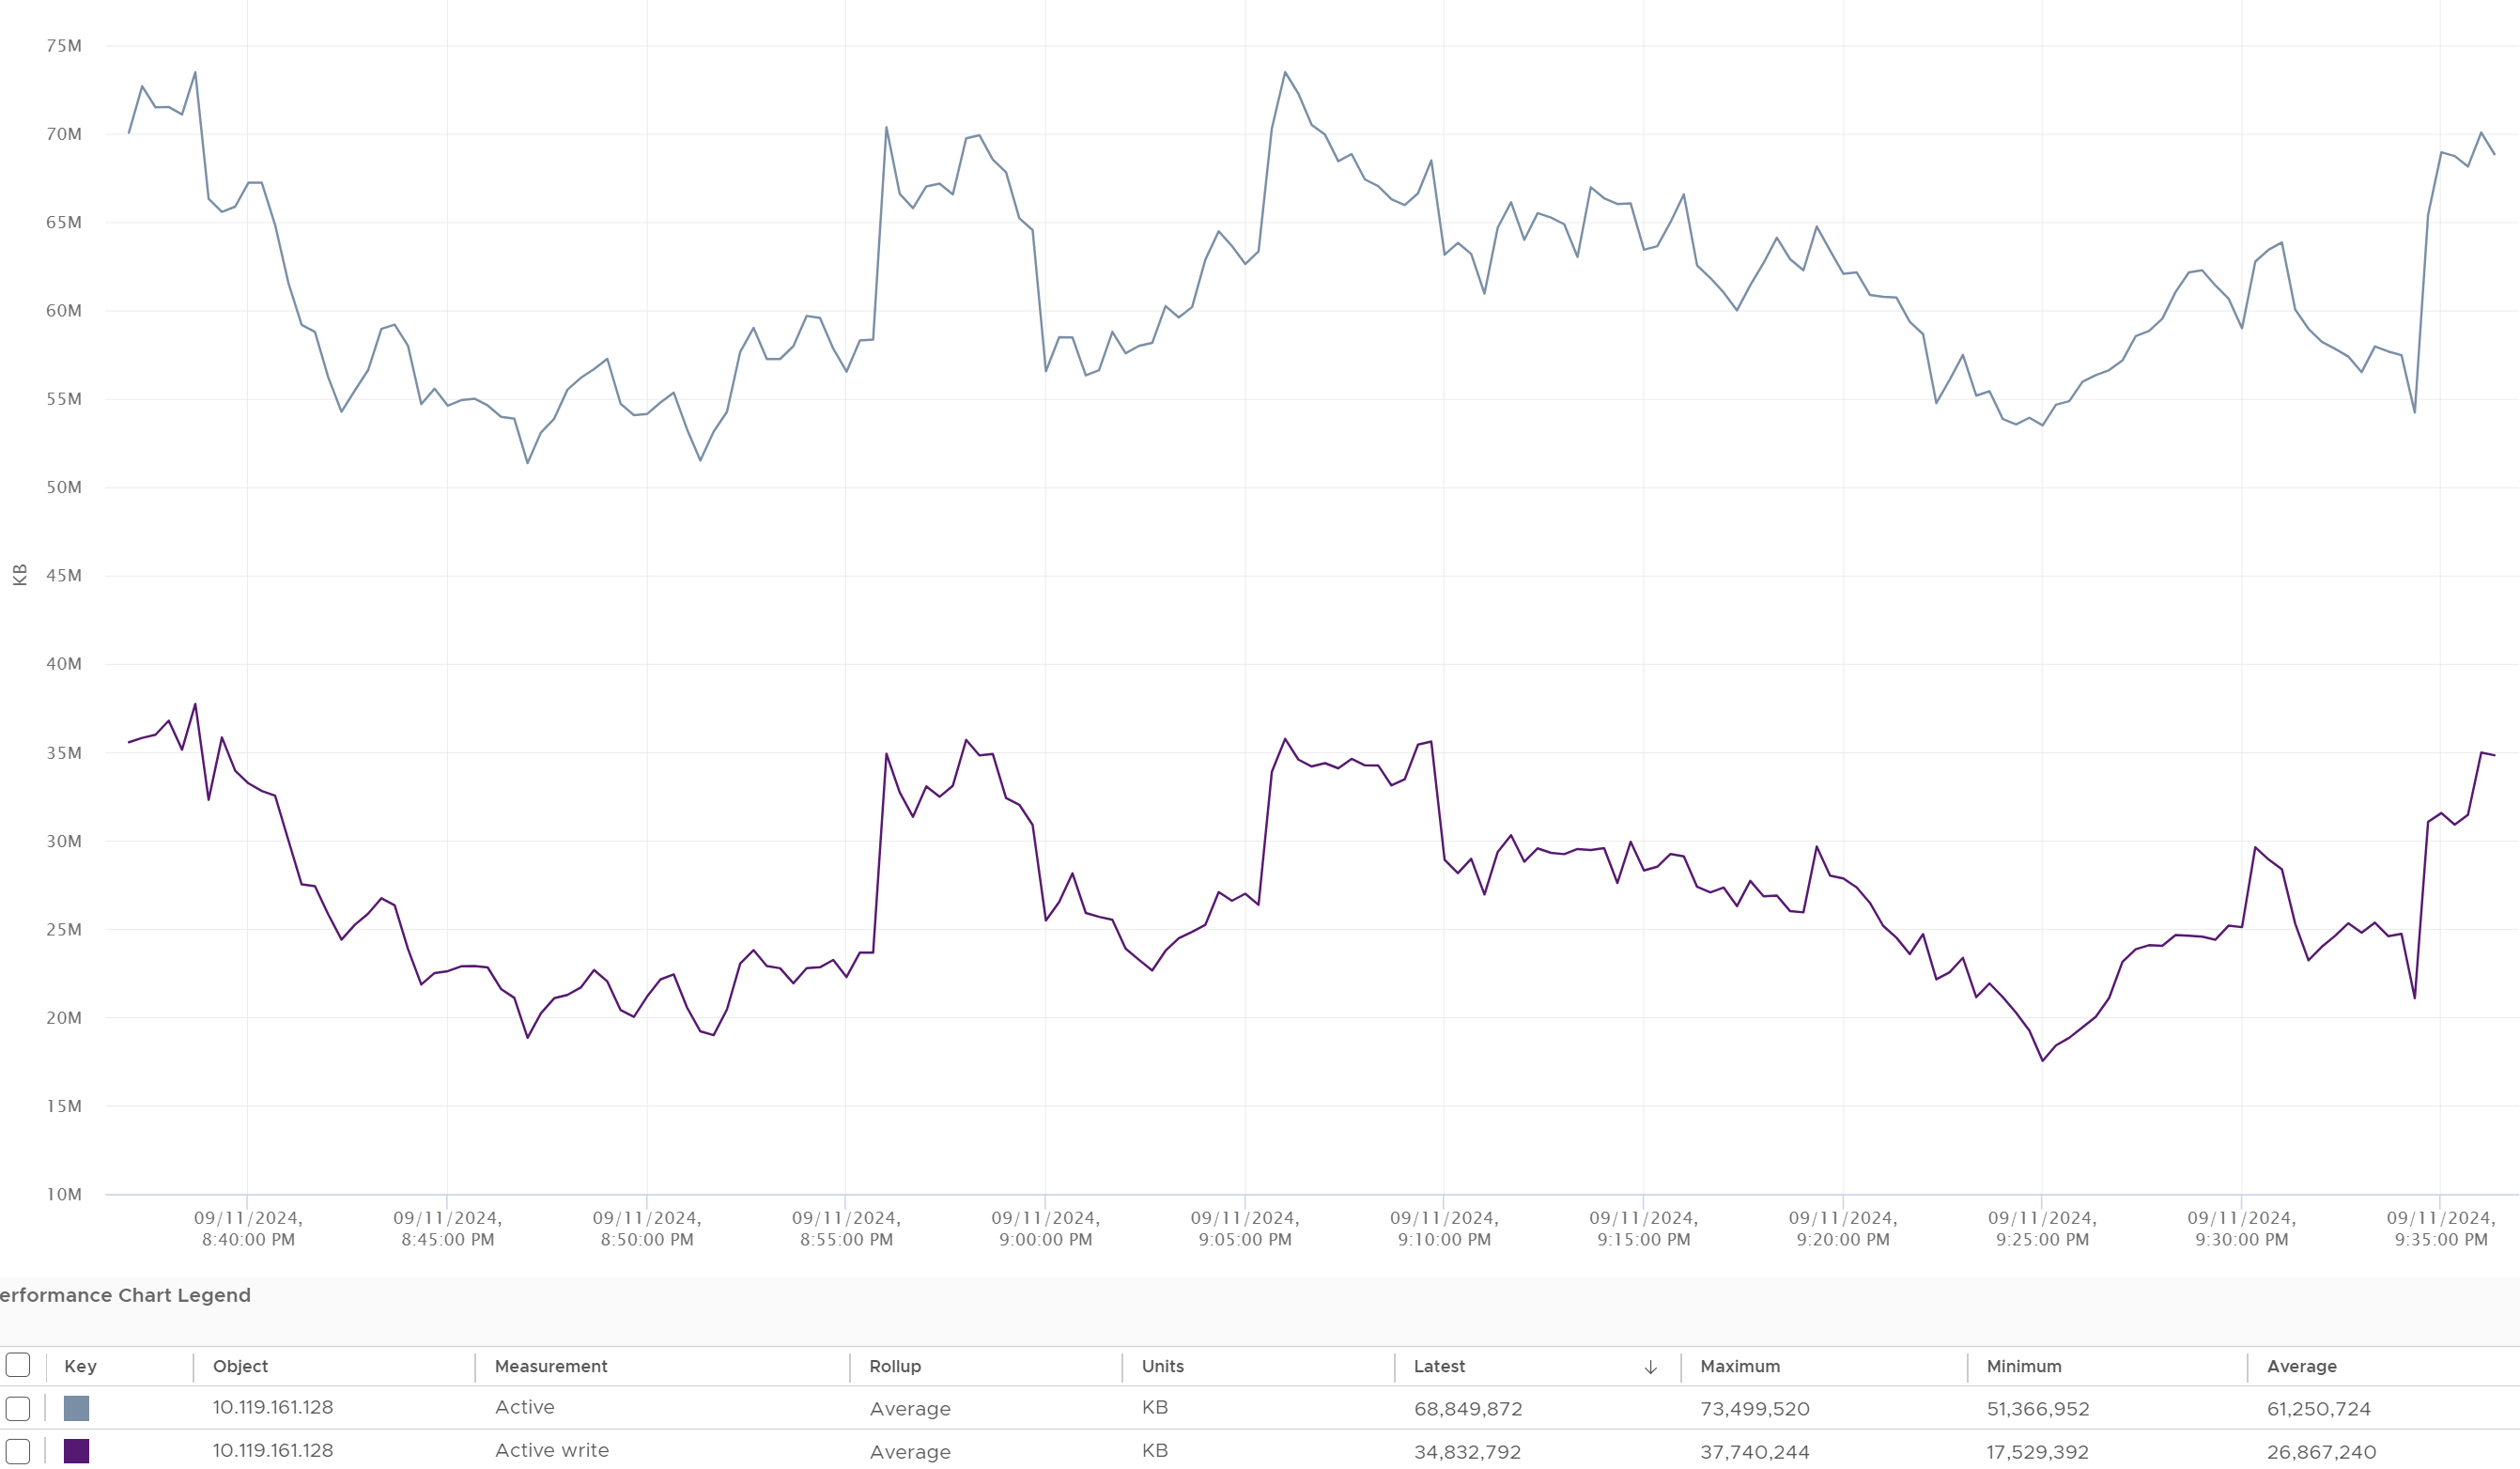
Does it mean the memory is not active?
Let’s look at the Active metric. It shows there are indeed activities, but they are within the pages already in the DIMM.
Consumption Metrics
Consumption covers utilization, reservation and allocation.
Consumed
Consumed is the primary counter for ESXi utilization but it contains a lot of cache and inactive pages. Just like any other modern-day OS, the kernel uses RAM as cache as it's faster than disk. So the Consumed counter will be near 100% in overcommit environment. This is an ideal goal, as opposed to something you need to panic.
The formula is:
Consumed = Physical memory – Free.
What does the above mean since you can overcommit?
Consumed only includes pages mapped in the physical DIMM. That means:
-
It does not include ballooned. This metric is at the Guest OS level.
-
It does not include swapped. The swapped pages reside on disk or host cache.
-
It only includes the resultant zipped, not the amount subjected to compression.
-
It only includes the resultant savings from TPS, not the amount subjected to sharing.
-
It includes VM overhead
-
It includes all the kernel processes, both user space and protected space.
Formula for VCF Operations Metrics:
-
Usage (%) = Consumed / Total Capacity.
Ballooned
Consumed does not include Ballooned. This makes sense as the pages no longer backed by physical pages. The following screenshot shows consumed drops when balloon went up.
Swapped
Consumed does not include swapped. This makes sense as the page are no longer in the physical memory. The following screenshot shows consumed drops when swap out went up.
Compressed
Consumed does not include compressed. The following shows that both compressed and swap out went up by almost 200 GB, yet Consumed dropped in the same period. It’s possible pages were removed from Consumed and were swapped and compressed.
Kernel
The other part of Consumed is non VM. This means the kernel, vSAN, NSX and whatever else running on the hypervisor. Because ESXi Consumed includes non VM, it can be more than what’s allocated to all running VMs, as shown below.
Take note that Consumed includes the actual consumption, not the reservation. The following ESXi has 0 running VM, so the Consumed is just made of the kernel. You can see the utilization is much lower than the reservation.
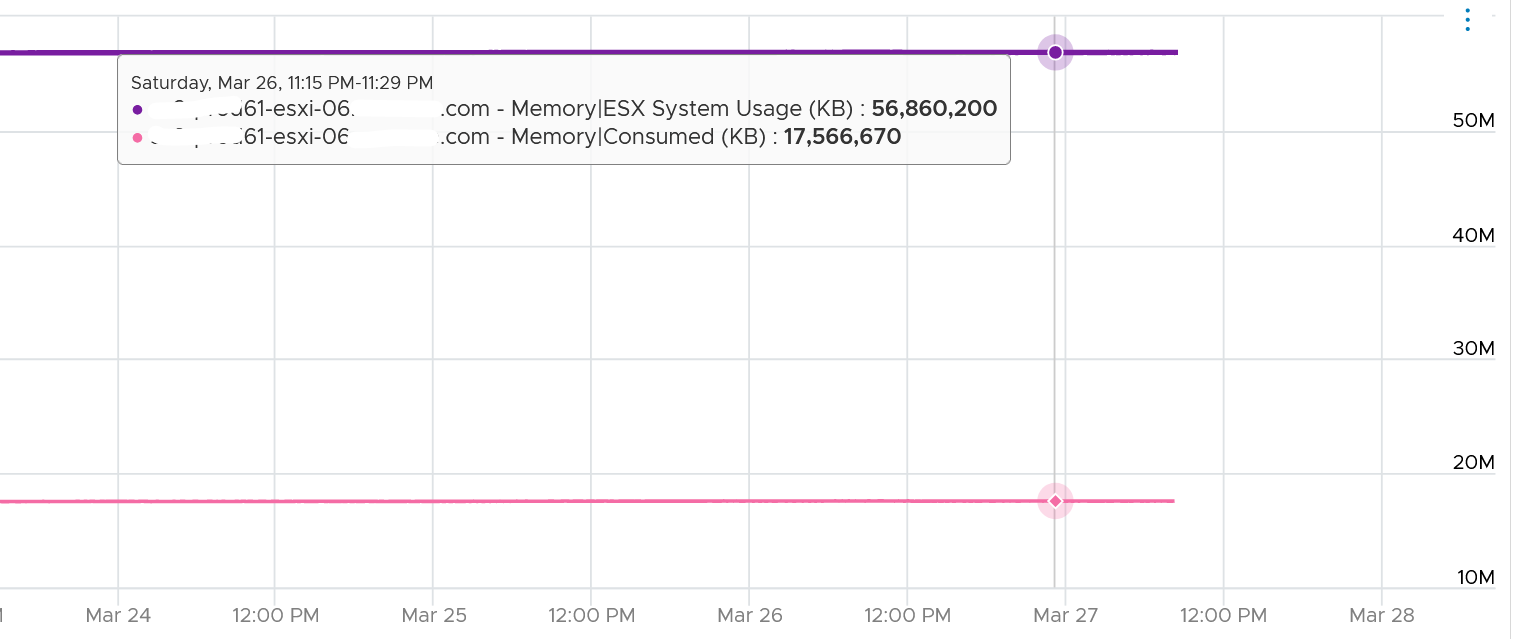
If you’re wondering why it’s consuming 17 GB when there is 0 VM, the likely answer is vSAN. Just because there is no VM does not mean vSAN should stop running.
Granted
Granted differs to Consumed as it excludes certain part of the kernel. It does not include the kernel space as processes at this privileged level gets what they want. They do not need the granting process, so to speak. Consumed, on the other hand, includes all both user and kernel space as both are indeed consuming pages.
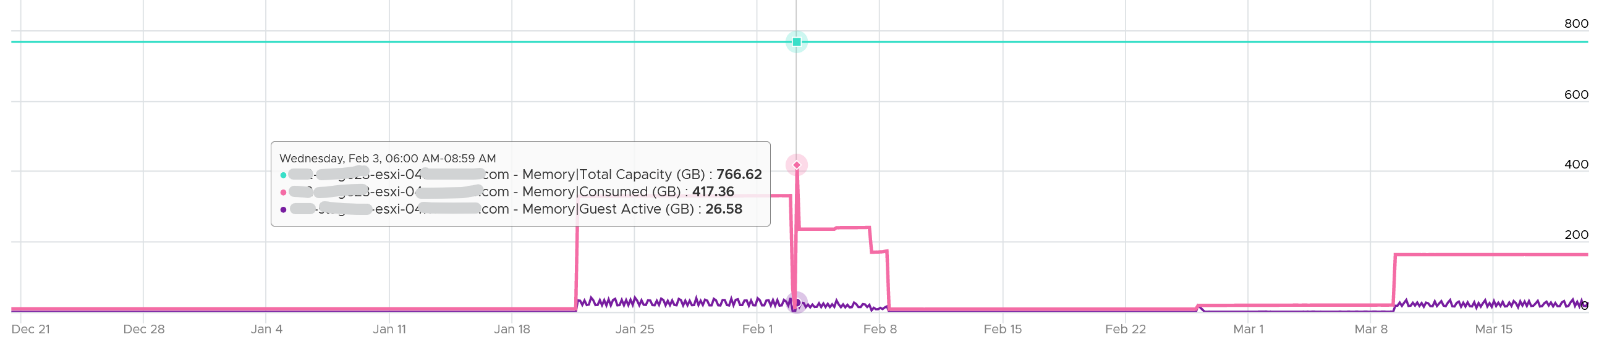
Granted, being a consumer-level counter, can exceed total capacity. The following ESXi has granted 1053 GB of memory to running VMs, way above its total capacity of 755 GB.
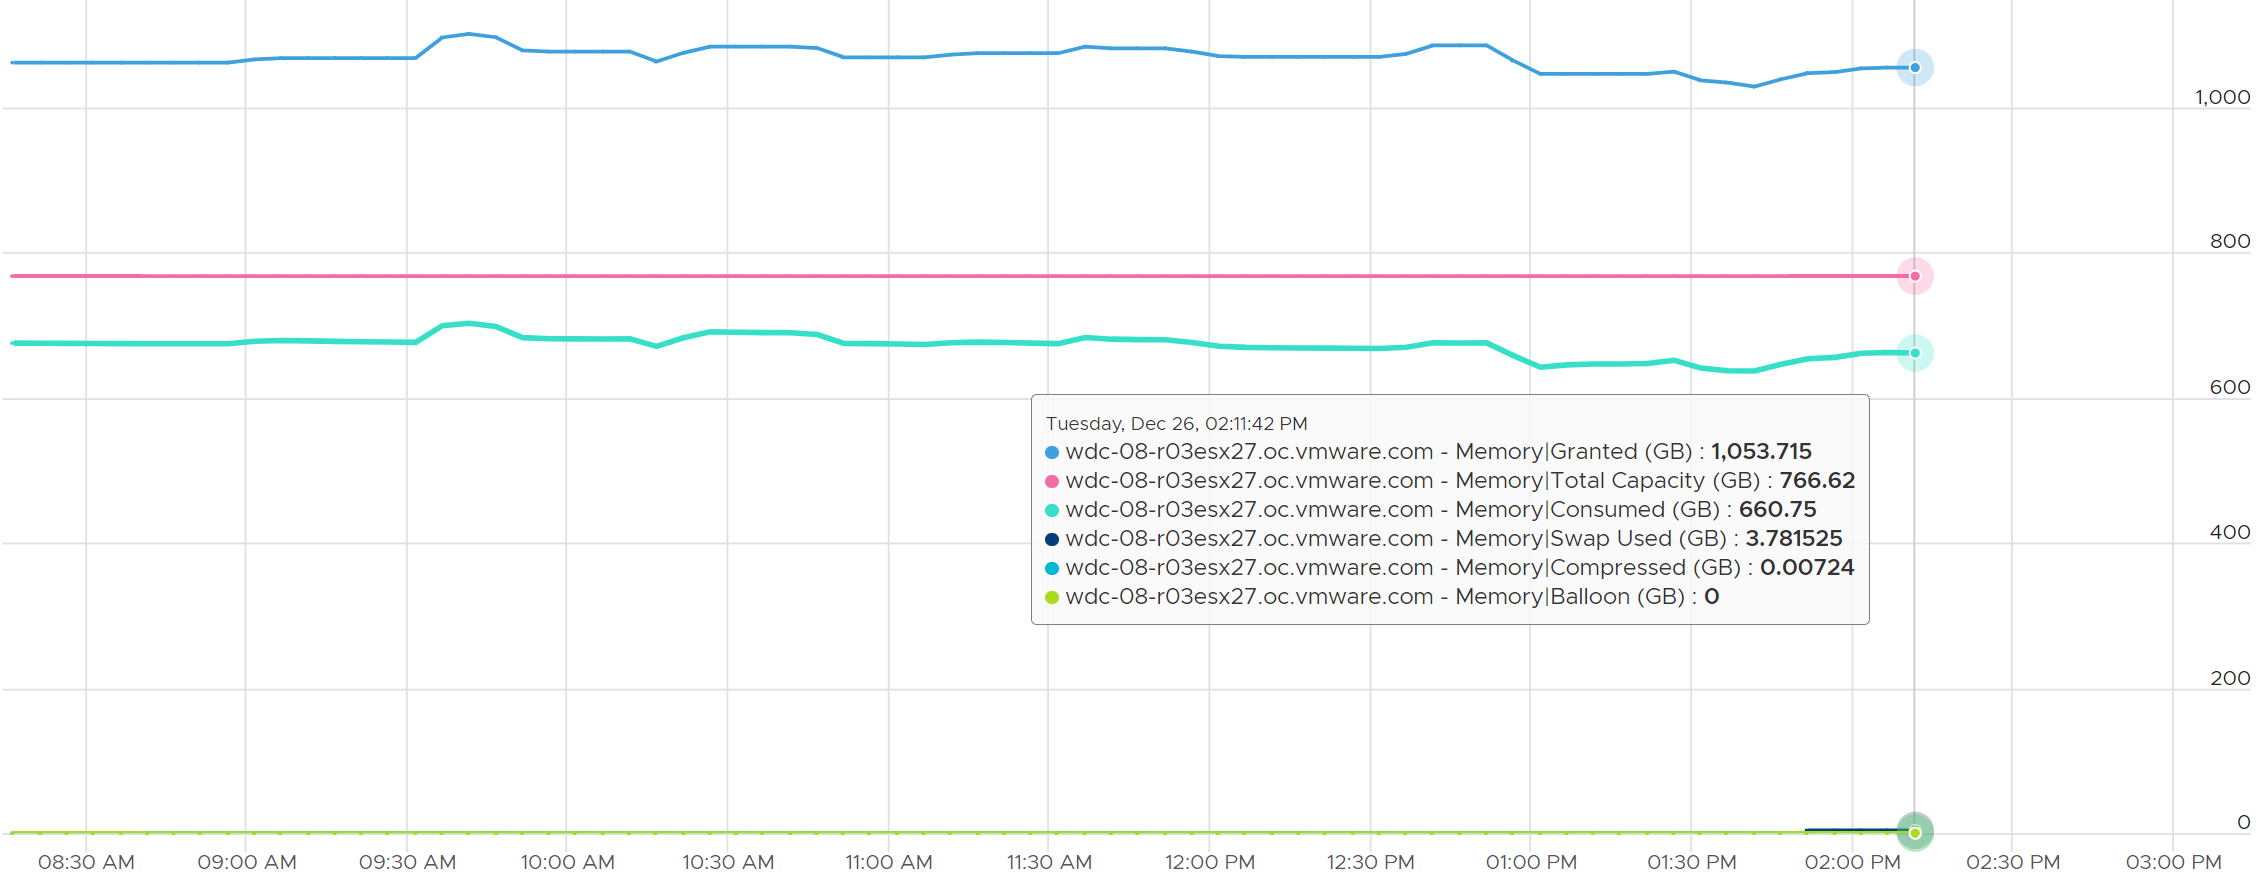
Notice the sum of consumed + swapped + compressed is always below the total capacity.
I added balloon just in case you’re curious.
The following example shows ESXi hosts with no running VM. I’m surprised to see the granted counter is not 0. My guess the extra memory is for non-VM user world process.
Let’s take one of the ESXi to see the value over time. This time around, let’s use vCenter instead.
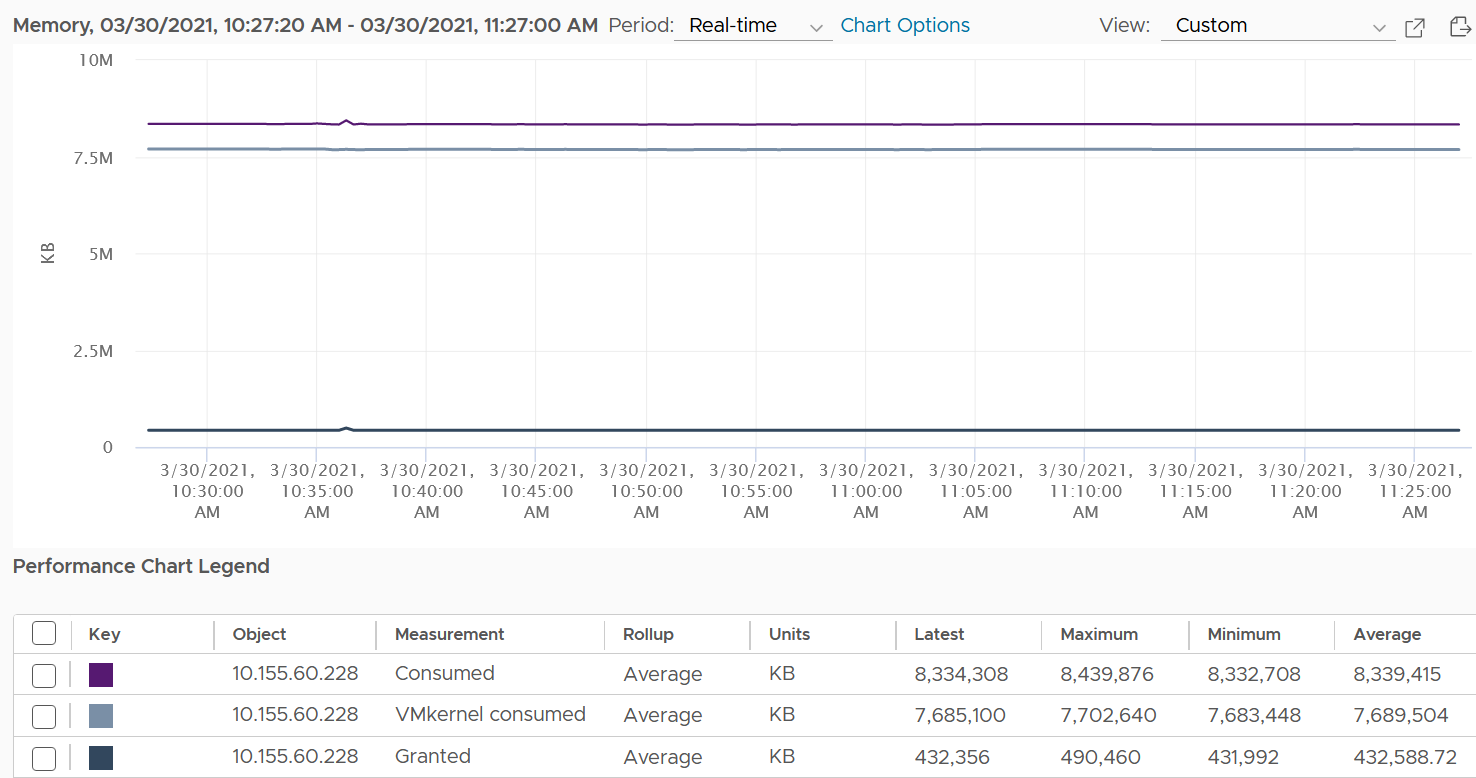
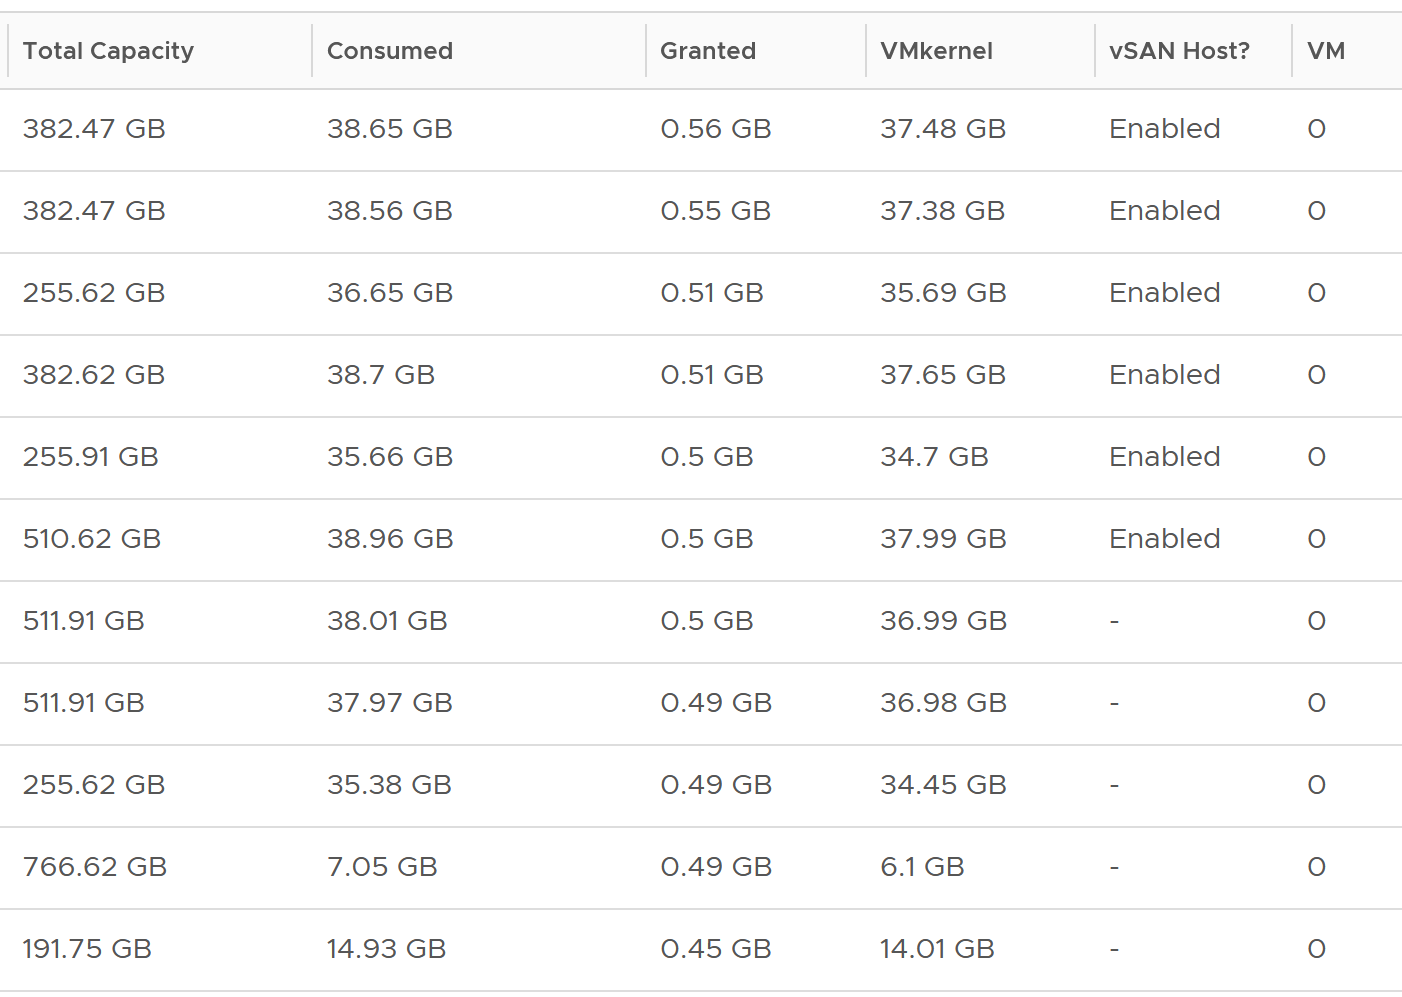
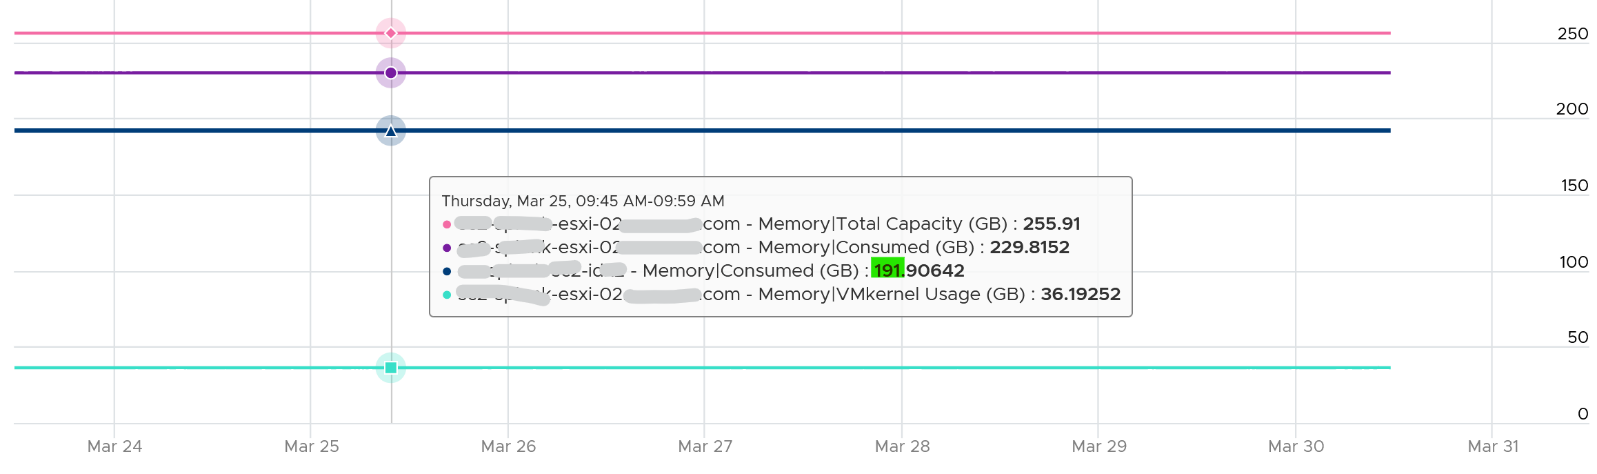
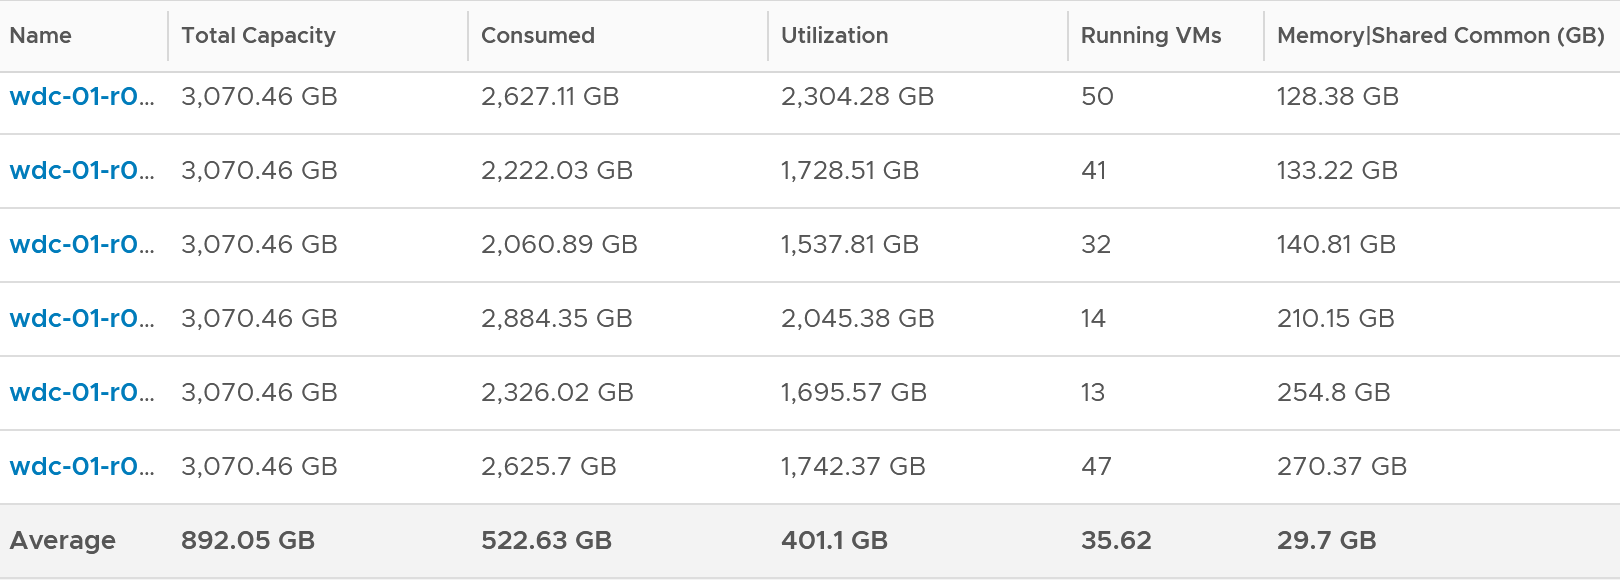
You can verify that ESXi Consumed includes its running VMs Consumes by taking an ESXi with a single running VM. The ESXi below has 255 GB of total capacity but only 229 GB is consumed. The 229 GB is split into 191 GB consumed by VM and 36 GB consumed by the kernel.
The kernel consumption is the sum of the following three resource pools.
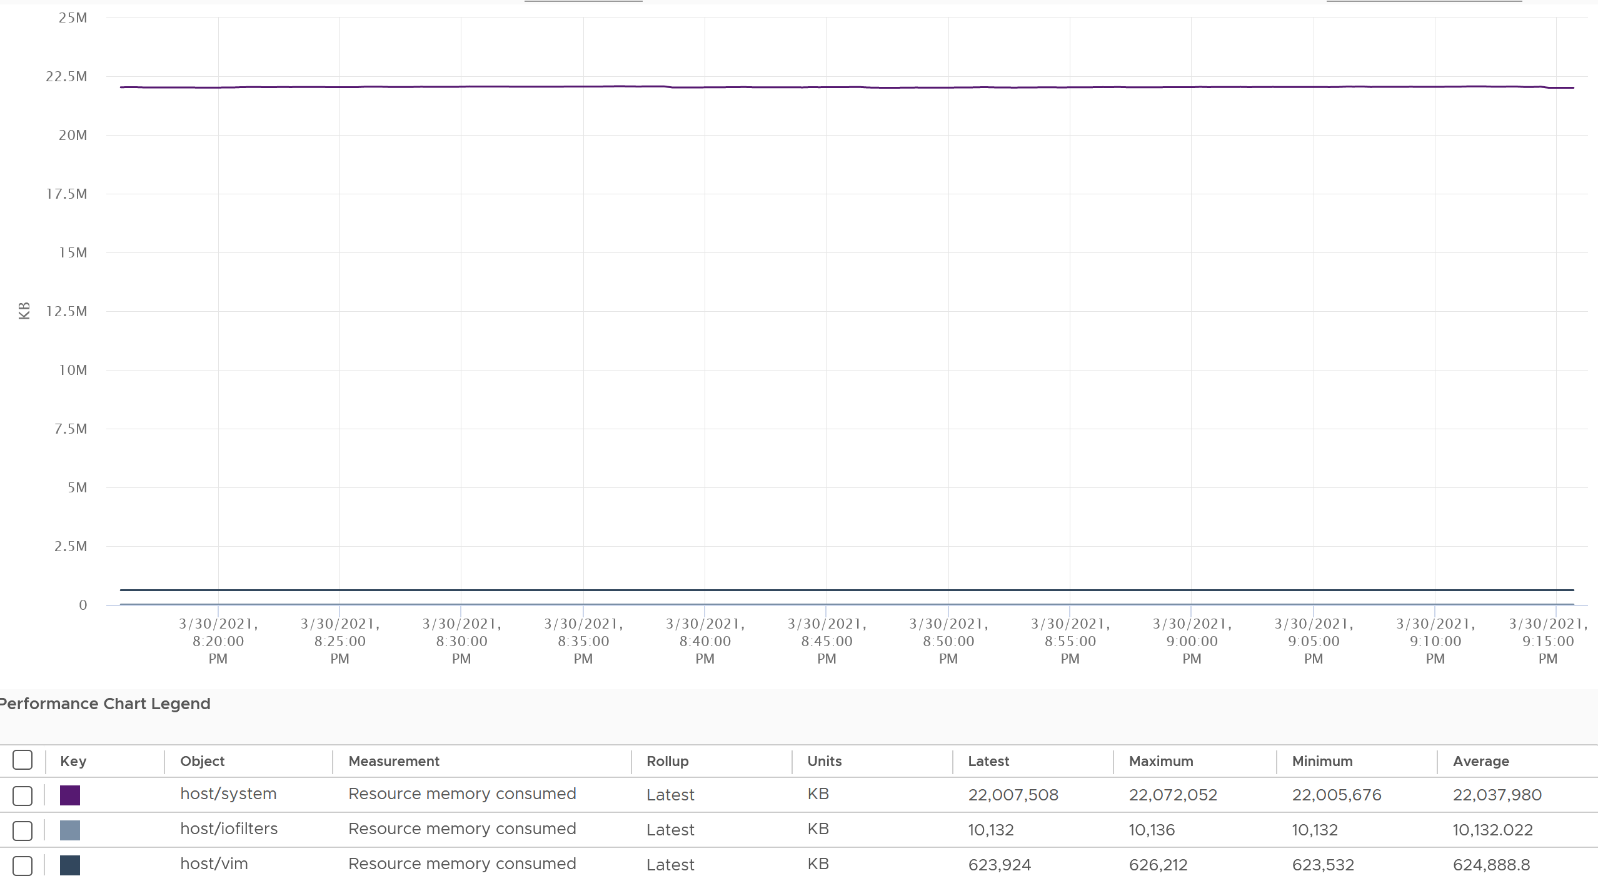
Shared
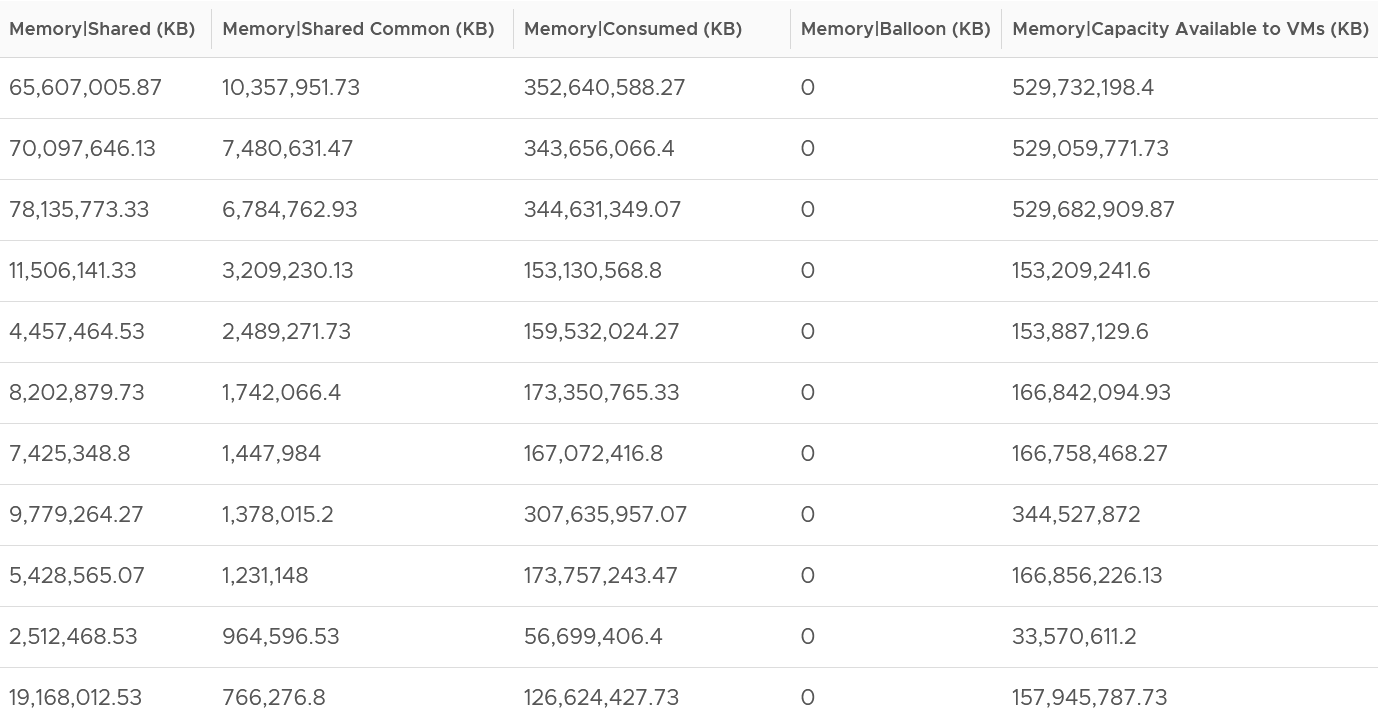
| Metrics | Description |
|---|---|
| Shared | The sum of all the VM memory pages & the kernel services that are pointing to a shared page. In short, it’s Sum of VM Shared + the kernel Shared. If 3 VMs each have 2 MB of identical memory, the shared memory is 6 MB. |
| Shared Common | The sum of all the shared pages. You can determine the amount of ESXi host memory savings by calculating Shared (KB) - Shared Common (KB) |
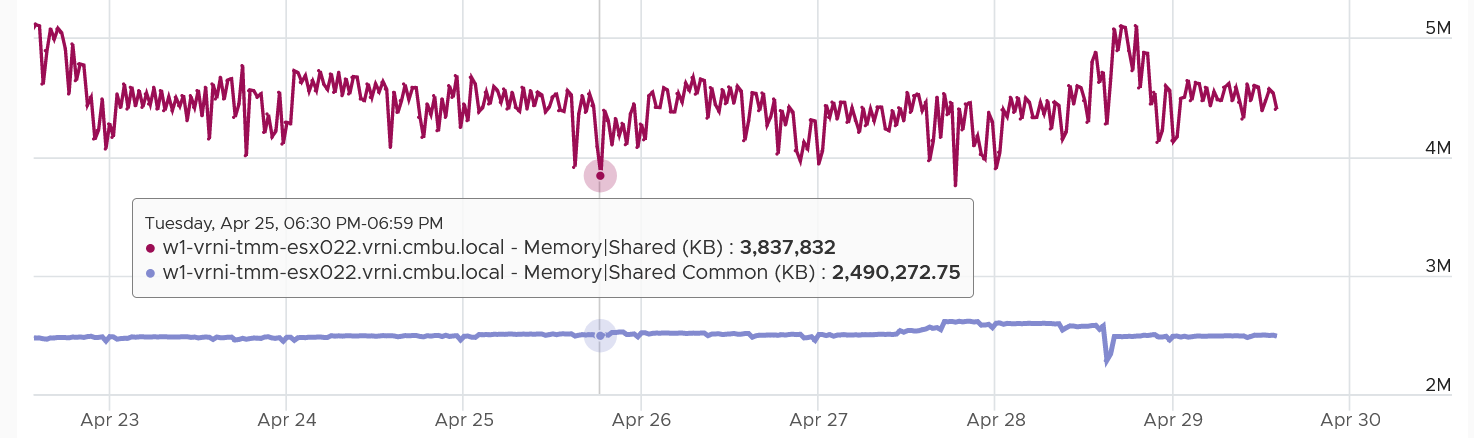
Memory shared common is at most half the value of Memory shared, as sharing means at least 2 blocks are pointing to the shared page. If the value is a lot less than half, then you are saving a lot.
The following shows the shared common exceeding half many times in the last 7 days.
I’m not sure why. My wild guess is large pages are involved. ESXi hosts sport the hardware-assisted memory virtualization from Intel or AMD. With this technology, the kernel uses large pages to back the VM memory. As a result, the possibility of shared memory is low, unless the host memory is highly utilized. In this high consumed state, the large pages are broken down into small, shareable pages. The smaller pages get reflected in the shared common. Do let me know if my wild guess is correct.
You can also use the Memory shared common counter as leading indicator of host breaking large page into 4K. For that, you need to compare the value over time, as the absolute value may be normal for that host. The following table shows 11 ESXi hosts with various level of shared pages. Notice none of them is under memory pressure as balloon is 0. That’s why you use them as leading indicator.
With Transparent Page Sharing limited to within a VM, shared pages should become much smaller in value. I’m not sure if salting helps address the issue. From the vSphere manual, “With the new salting settings, virtual machines can share pages only if the salt value and contents of the pages are identical”.
I’m unsure if the above environment has the salting enabled or not. Let me know what level of sharing in your environment, especially after you disable TPS.
Utilization
We’ve seen that Consumed is too conservative as mostly cache and Active is too aggressive as it’s not even designed for memory sizing.
This calls for a metric in the middle. This is where Utilization comes in.
It’s the sum of running VM Utilization metrics + the kernel reservation.
Utilization uses the reservation amount for the kernel, instead of the actual utilization. This is technically not accurate but operationally wise as it gives you buffer.
I plotted from 192 ESXi. I averaged the data to remove outlier. Based on 6840 running VMs, the Utilization counter is lower than Consumed by 122 GB. If you include Shared Common, your savings goes up to 152 GB on average.
Validation
The following screenshot shows that ESXi had all its VM evacuated. Not a single VM left, regardless of power on/off status.
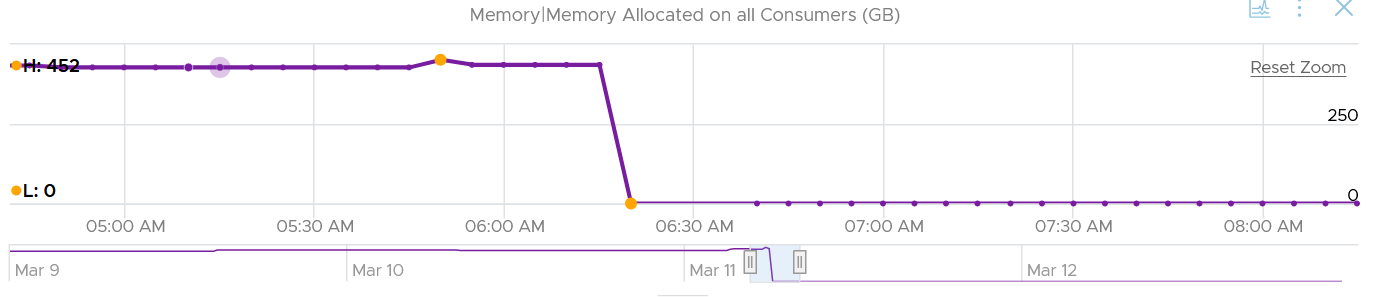
In the preceding chart, we could see the metric Memory Allocated on All Consumers dropped from 452 GB to 0 GB, and it remained flat after that.
Checking the Reserved Capacity metric, we can see it dropped to 0. This is expected.
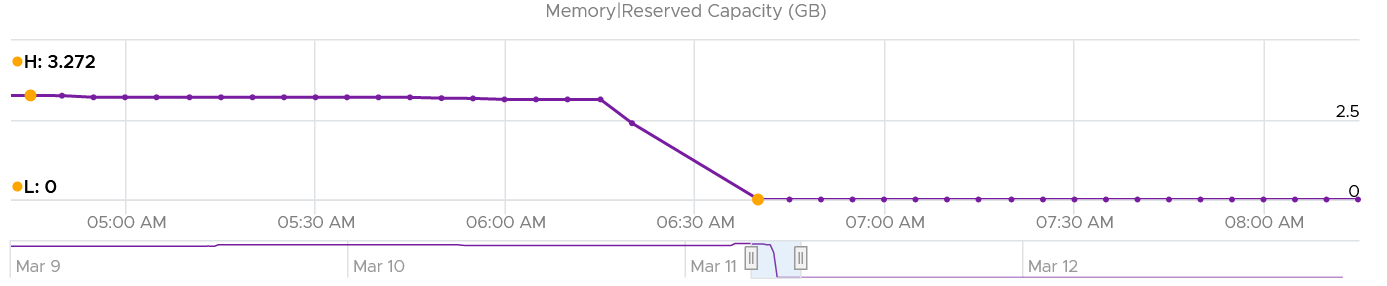
How about Consumed?
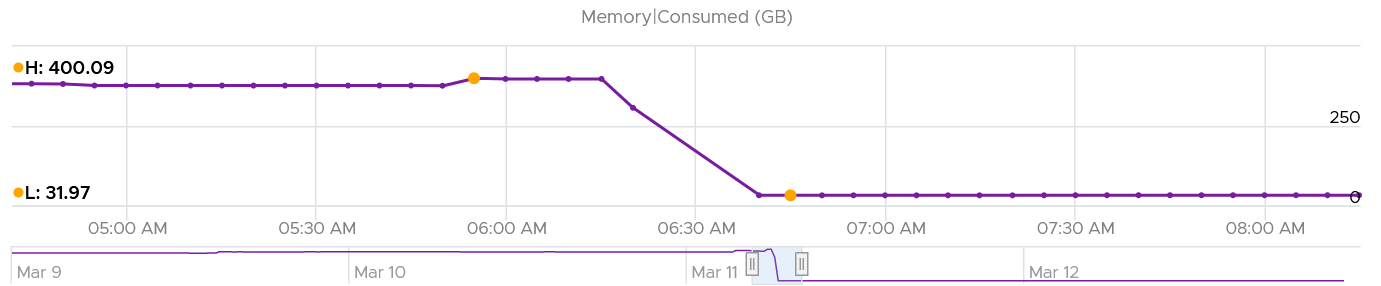
Memory Consumed also dropped. The value was 400 GB, less than 452 GB of allocated to all VM. This indicated some VM had not used the memory, which could happen.
The value dropped to 32 GB, not 0 GB. This is expected as Consumed includes every other process that runs. In this case, it is majority vSAN, which runs in the kernel.
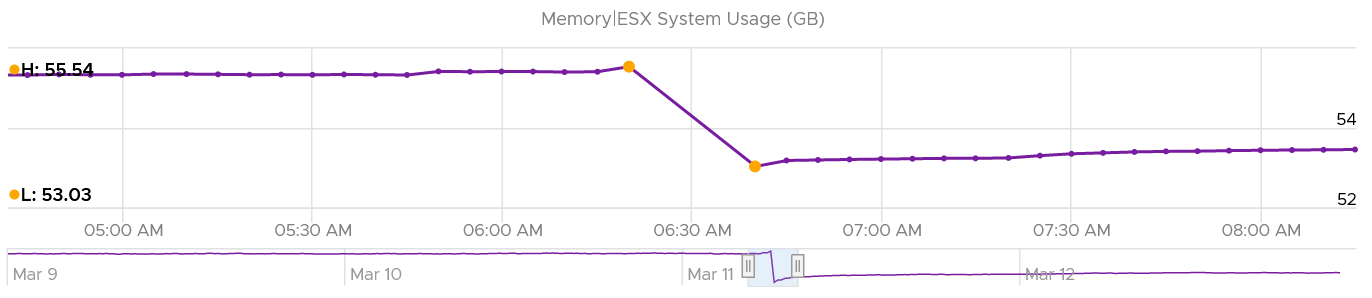
Let’s check the kernel utilization.

Notice it’s a bit smaller than Consumed, indicating Consumed has other thing. I suspect it’s BIOS and the console in vSphere Client UI.
How come the value didn’t change much? I kind of expect some changes, based on the theory that some kernel modules memory footprint depends on the number of running VM. If you know, let me know!
How about the kernel reservation? What do we expect the value to change?
Well, it won’t since the actual usage does not change.
Analysis
I compare 185 production ESXi hosts to understand the behaviour of the metrics. I averaged their results to eliminate outlier.
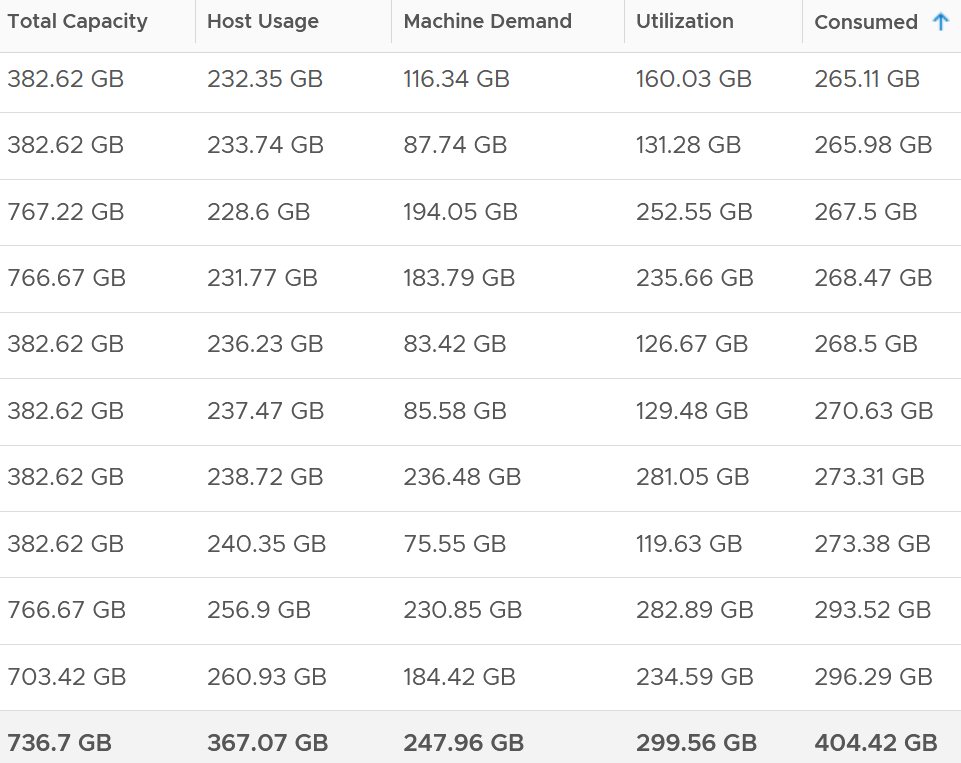
The average of all the 185 ESXi hosts have total capacity of 737 GB. This is the physical configured memory.
The metric Memory \ Usable Memory is 729 GB (not shown in above table). It’s 1% less or 8 GB than Total Capacity. I suspect this maps to Managed metric in vCenter. It is the total amount of machine memory managed by the kernel. The kernel "managed" memory can be dynamically allocated for VM, the kernel, and User Worlds. I need to check what exactly this is as I don’t see a use case for it.
The metric Memory \ VMkernel Usage is 7.6 GB (not shown in above table). This is much lower than the reservation, which is 51.6 GB.
Consumed is generally higher than the other 3 metrics. The only time it’s lower is when there is a lot of savings from shared pages.
What are these?
-
Host Usage. Sum of VM Consumed. ESX System Usage is not included. Use case is only for migration, where we don’t want the ESXi consumption.
-
Machine Demand. The sum of VM Utilization
-
Utilization. Machine Demand + ESX System Usage. You can see that the value equals ESX System Usage when there is 0 running VM.
-
Workload = Utilization against Usable
Reservation
| Total reservation (MB) | This is the amount reserved. Note it does not mean it’s actually used by the VM. It only counts reservation by powered on VM. It does not include powered off VM and the kernel reservation. See screenshot below. This metric is also labelled as Reserved Capacity. |
| Reservation consumed | The actual consumption. If this number if consistently lower than the reserved capacity, it indicates over reservation. |
| Reservation available | This is the amount that is not even reserved. That means it is available for new reservation. |
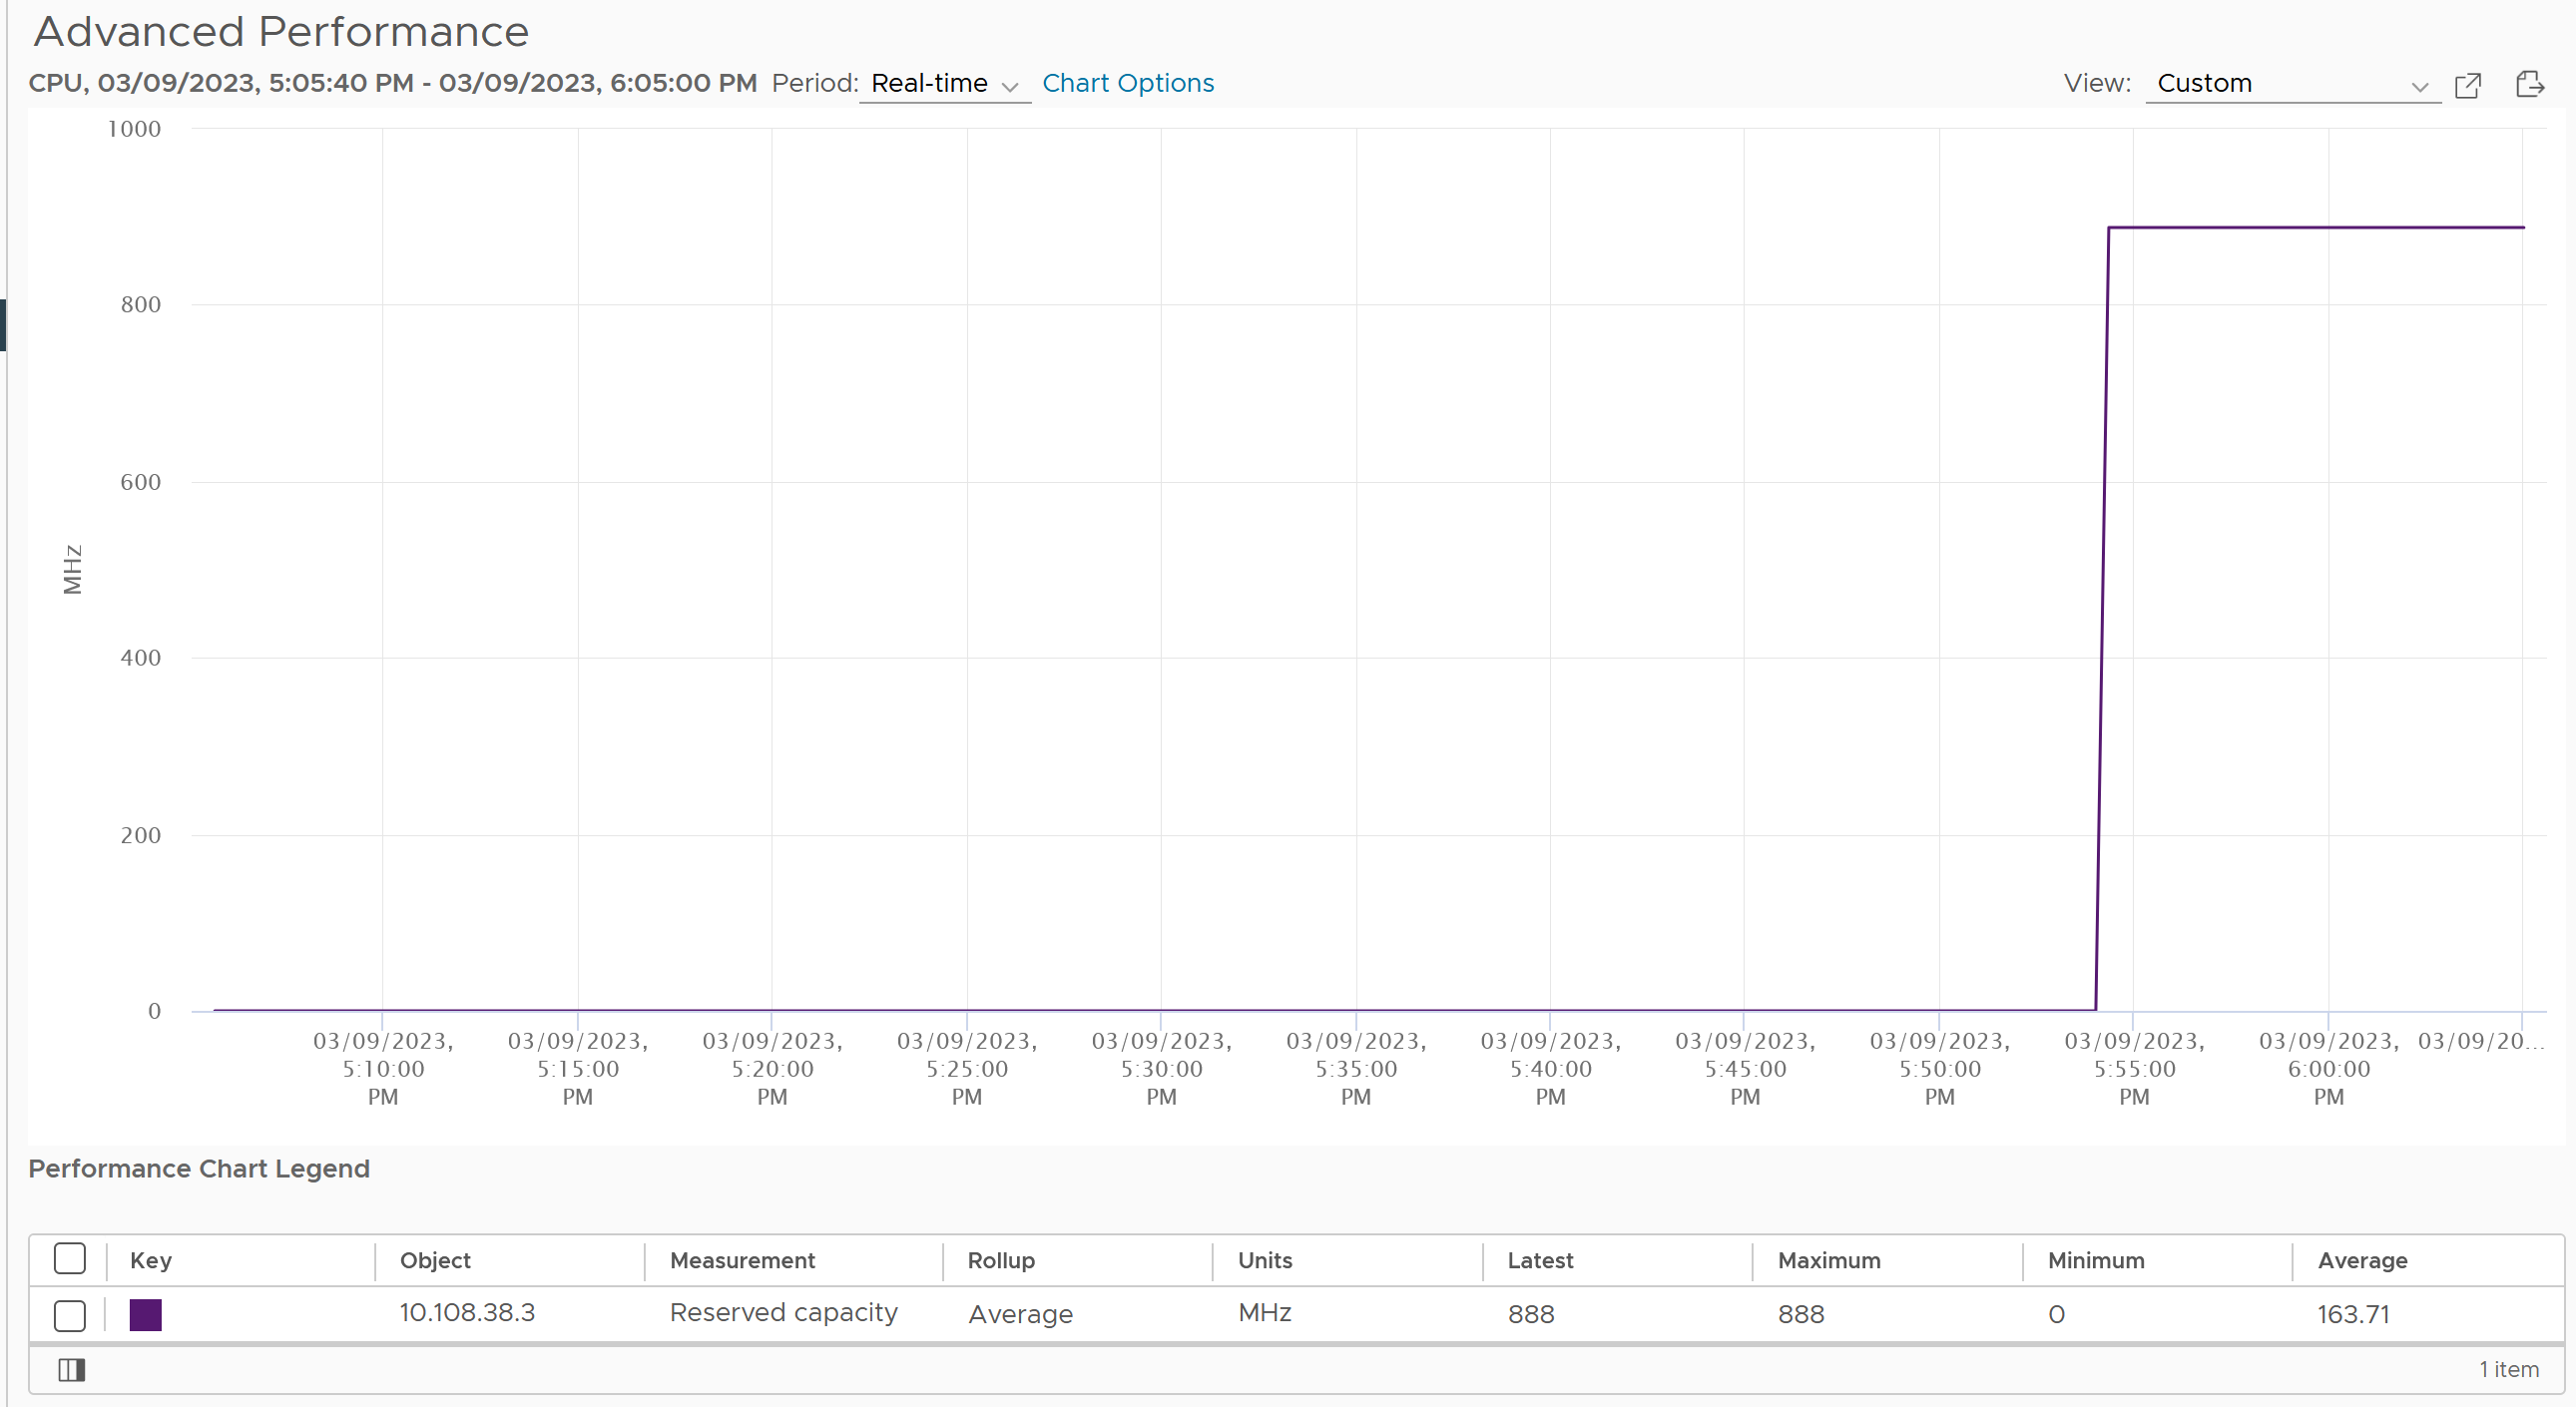
The following screenshot shows an ESXi where the CPU reservation was flat 0 MHz. I then set one of its VM reservation to 888 MHz. Notice the immediate yet constant change.
Chapter 4