Consumer
Performance: VM
This section covers metrics that cut across the 4 elements of infrastructure, or metrics that are outside these 4 elements.
VM Performance (%)
With so many metrics, how do you monitor at scale? Say you have 5000 VMs, and you want to monitor every 5 minutes and see the performance trend in the last 24 hours. That would be far too many trend charts.
Enter Performance (%) metric.
Now that we’ve mastered the raw metrics, we’re in the position to combine them to answer complex question. When we combine, we need to be mindful of which persona needs this summary metric. The answer is VM Owner. The metric is not designed for infrastructure team.
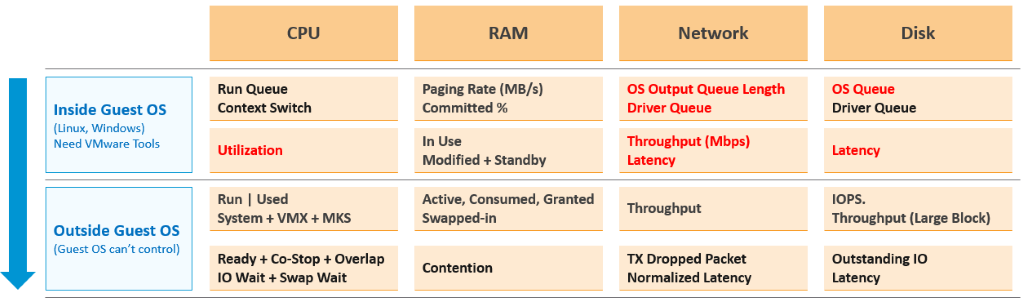
The following diagram put together all the metrics from Guest OS and VM. VM KPI includes Guest OS metrics as operationally we troubleshoot them as one, due to their 1:1 relationship.
For completeness, I added the utilization metrics to act as leading indicators.
Metric Used
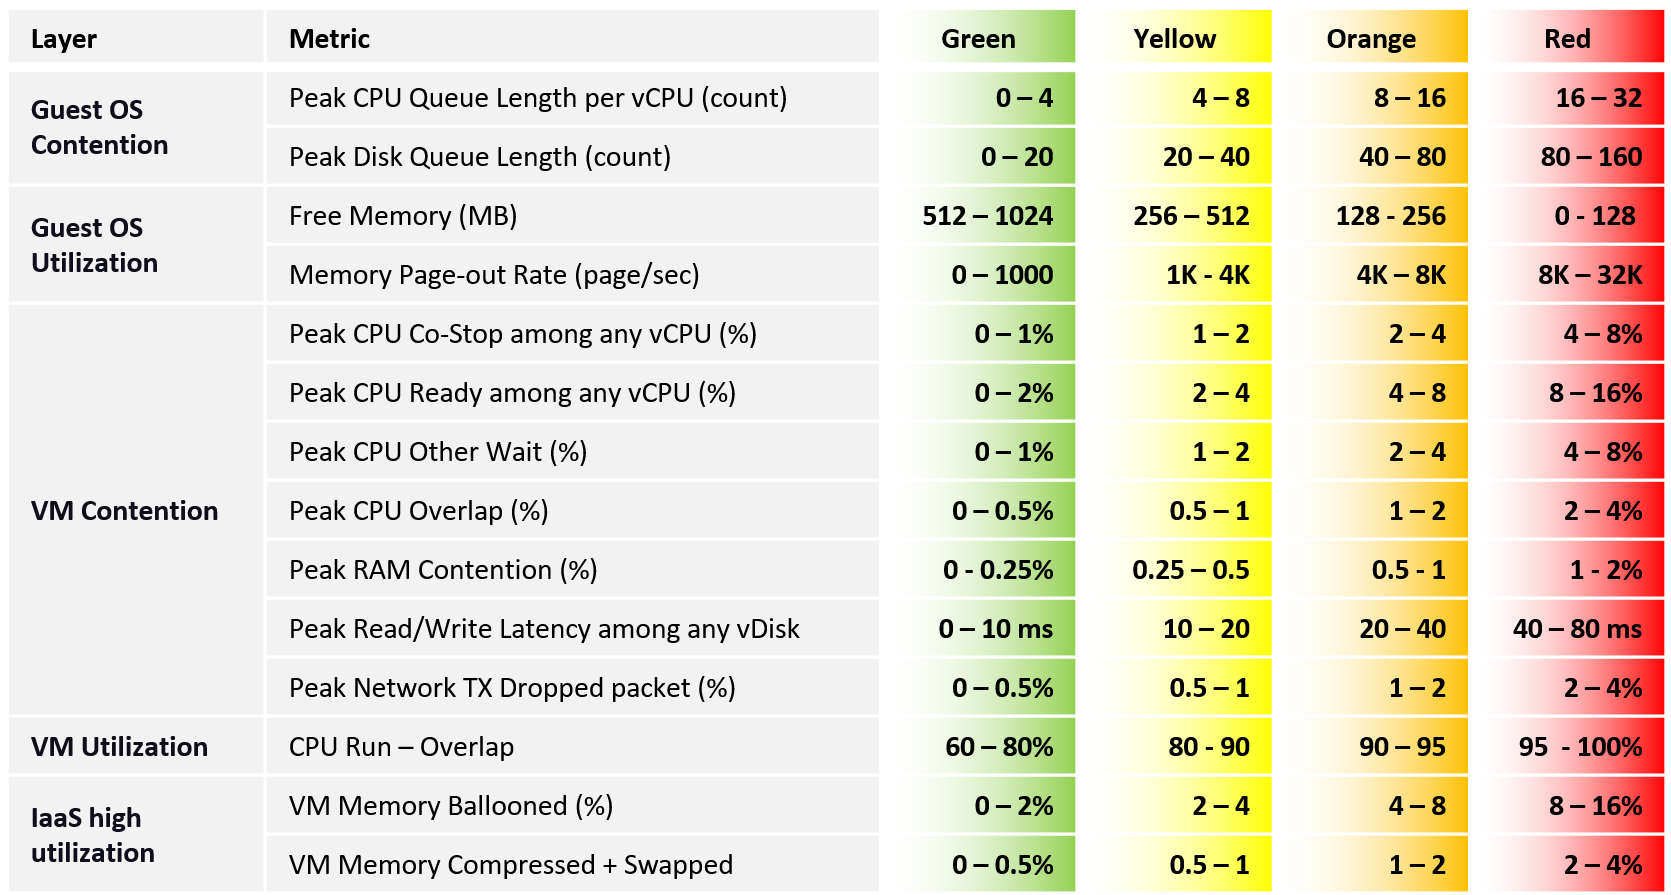
Here is what I recommend, including their threshold.
Q: Why do we use 4 metrics for CPU instead of 1? Wouldn’t that quadruple their share?
A: Yes, it will. This is a known limitation. We cannot combine them into a single metric as they don’t peak at the same time within the 20-sec period.
Q: Why do the 4 components of CPU contention have different threshold since their impact is the same?
A: They have different level of sensitivity. The gap is sizable. To standardize will result in compromise. For example, Ready tends to have 2x the value of Co-Stop.
We can only add a metric in the table if it can be quantified into the 4 brackets. If a metric cannot be bucketized, it could do a disservice to the KPI. Hence majority of utilization metrics (e.g. disk IOPS, network throughput) are not here. I do not recommend you add them as they can mask out the real problem.
| Guest OS | Guest OS metrics are included as they do not have VM equivalent, and they change the course of troubleshooting. |
| CPU run queue is set to higher than normal to reduce false positive. | |
| VM CPU | The complete set of CPU contention is provided. There are 4 metrics tracking the different type of contention or wait that CPU experiences. |
Do you know why we use CPU Net Run as opposed to CPU Usage? Read the VM CPU Metrics section. Theoretically, we should have chosen a higher threshold for CPU utilization. Practically, it’s rare the CPU Run goes to 95% as CPU Used would have reached the VM CPU capacity. I set 60% as the starting line so there is no penalty for utilization below 60%. | |
| VM Memory | Memory Contention is the only counter tracking if the VM has memory problem. VM and Guest OS can have memory problem independently. In future, we should add Guest OS memory performance metrics, if we find a good one. Linux and Windows do not track memory latency, only track memory disk space consumption, throughput and IOPS. These 2 OSes do not track latency, which unfortunately is the main counter for performance. |
| Memory Ballooned, Swapped, Compressed are added even though their presence does not indicate real performance as they are leading indicators. That’s why their threshold is higher than memory contention. | |
| Swapped and Compressed are combined as they are the result of the same action. Together they tell the complete picture. As they may not indicate actual problem, their threshold is 2x of memory contention | |
| Network | vCenter does not have latency and re-transmit. So we have to resort to dropped packet metric. |
| The threshold is not low as dropped packets are automatically restranmitted. Practically, this means the application team may not notice it. | |
| Take note of known limitation. While the packet dropped is based on the peak 20-second, the packet transmitted is based on the average of the collection period. The reason is we don’t know which data points to take among the 15 data points in the default collection period. |
With so many metrics, it can get difficult to debug. Also, the number will tend to be high as a single number will not have enough weightage to bring down. These are 2 things you can do:
-
Combine the 4 VM CPU contention into a single metric. The drawback is there is possibility that the 4 peak values happened at different time within the 5 minute window.
-
Split the table into 2 and take the lowest. There are 2 ways, both have their pros and cons.
-
Approach 1 is by layer. Table 1 is for Guest OS (4 metrics), while Table 2 is for the rest (7 metrics).
-
Approach 2 is by importance. Move less important metrics to Table 2.
-
Metrics Not Used
What metrics are missing from the tables?
Most utilization, such as disk IOPS, are excluded as we can map their values to the 4 brackets. There is no univeral mapping that works for all VMs.
The following metrics are not included, along with the reason why:
| Guest OS : VM Ratio | Guest OS IOPS : VM IOPS Ratio. They should be near 1 or a stable number, as the block size should be identical. The actual numbers may not match, as Guest OS tends to report the last value, while VM tends to report average value. If they fluctuate greatly, something amiss. I do not include as I do not have the data yet. |
| Guest OS | CPU Context Switch is not included as the profiling shows this metrics has a very wide band, making it impractical. |
| Memory page-in could contain Windows or Linux application binary, so its value could be over reported. Based on our profiling of 3300 production VM, the page-in is more volatile so I’m less confident of applying a threshold | |
| Guest OS swap file remaining free capacity is not included as I’m not sure if low value impacts performance | |
| Number of dead processes is not included as I’m not sure what value to set for each bracket. We need to profile Windows and Linux separately | |
| Memory | Popular VM metrics such as Consumed, Active, Granted, etc are not shown as they do not indicate performance problem |
| RAM Page Fault is not included as we do not have the metric. | |
| Swapped File Remaining is not included as it may corelate with available memory? | |
| Memory page-in is not included as it contains proactive fetch | |
| Storage | Adding Disk Outstanding IO will be duplicating as it’s a function of IOPS x latency |
| Snapshot latency is excluded as the metric VM Other Wait already covers it, so no need to double count | |
| Network | Network packets, such as broadcast and multicast, are not desirable. However, they do not actually cause performance. |
| Error packets are excluded as Tools do not have it. | |
| Network queue is excluded as no such metric. | |
| RX Dropped Packets is excluded as too many false positive. | |
| Packets per second is excluded as we can’t quantify the 100%. | |
| VM DRS Score | Niels Hagoort states here that “a VM running a lower score is not necessarily running properly. It is about the execution efficiency, taking all the metrics/costs into consideration.” |
The metric considers CPU, Memory (including Memory Tiering), Network, Fault Tolerance, vSAN, Storage and Maintenance. VM DRS score = Performance Goodness * 0.8 / CPU Demand 0.8 is a threshold of performance degradation. | |
| Reading the blog and other material, this metric is more about the cluster performance than the individual VM performance. Plus, it’s using metrics that are already included in the KPI, so it’s double counting. | |
| vMotion | I do not have enough data to decide the value to put for each range of either downtime or stun time. It should be within 0.2 second for green, but what about yellow? Typically, I used 2K – 4K VMs over 3 months to convince myself that the thresholds are representing real world. Use Log Insight to profile this. |
| CPU Other Wait | Too many counters for CPU, which incorrectly inflates the importance of CPU factor. Plus, there is a rare bug which results in false positive. |
Notice all of them are VM or Guest OS metrics. No ESXi, Resource Pool, Datastore, Cluster, etc metrics. Why?
The reason is the metrics at these “higher-level” objects are mathematically an average of the VMs in the object. A datastore with 10 ms disk latency represents a normalized/weighted average of all the VMs in the datastore. Another word, these metrics give less visibility than the 12 above, and they can be calculated from the 12.
And 1 more reason: You troubleshoot VM, not infrastructure. If there is no VM, there is no problem 😊
20-second Peak Metrics
VCF Operations collects and stores data every 5 minutes. This is good enough for monitoring use case, but not for troubleshooting. 300-second average is not granular enough, as performance problem may not be sustained that long. Even a performance issue that last days may consist of repeated microbursts. I check if repeated bursts exist by profiling a few thousand VMs. Here are some of the results. I compare 3 metrics (disk latency, network throughput and CPU context switch).
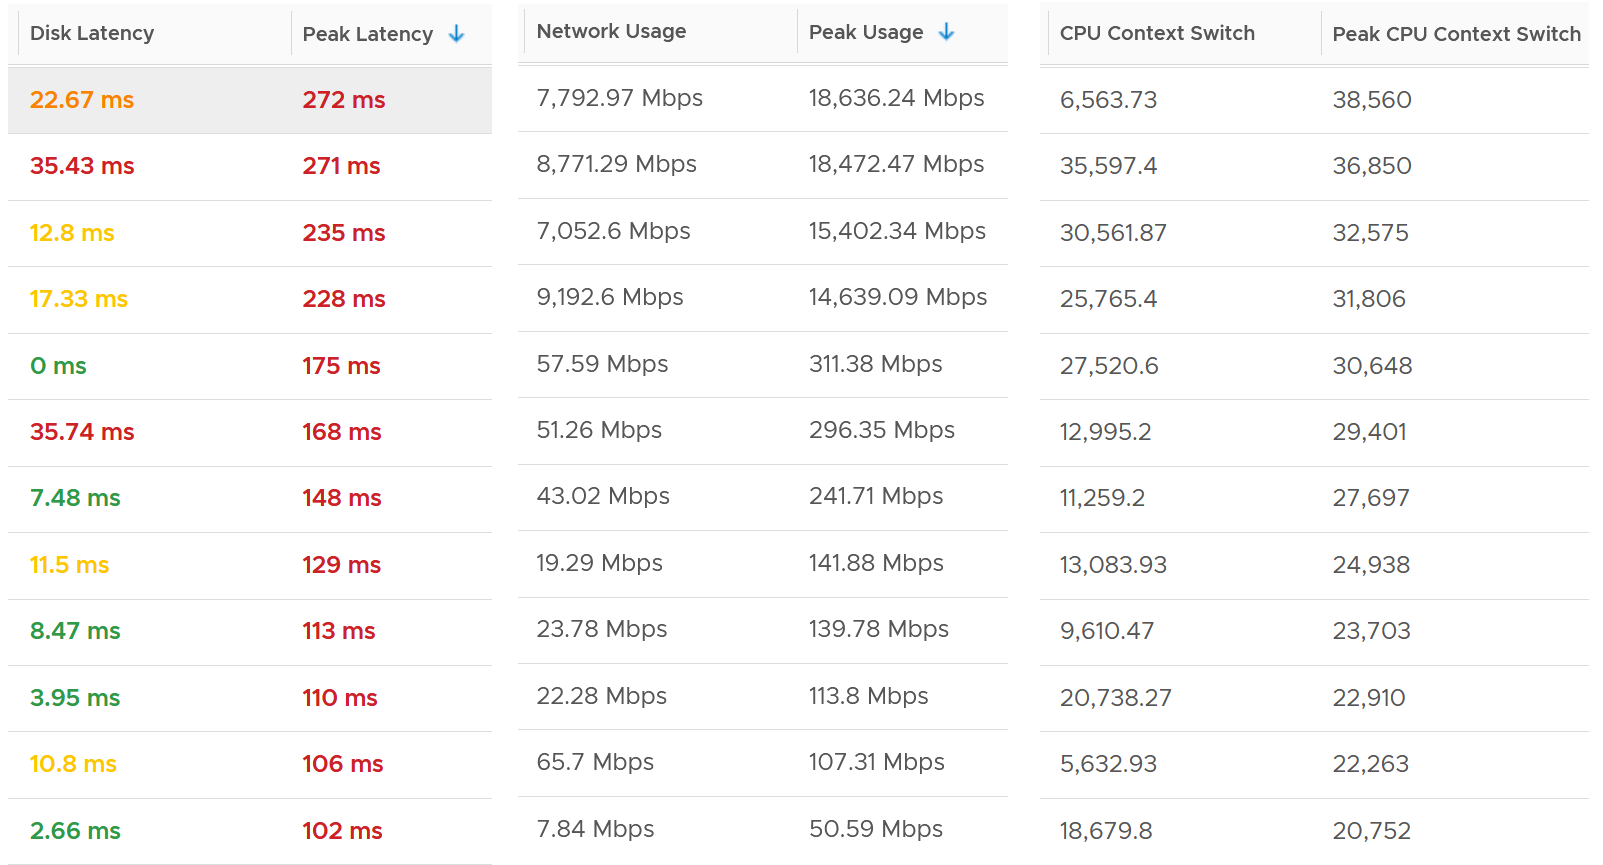
The peak column is based on 20-second average. So it’s 15x sharper than the 300-second average. It gives better visibility into the microbursts. If the burst exists, you will see something like this, where the 20-second shows much worse value consistently.
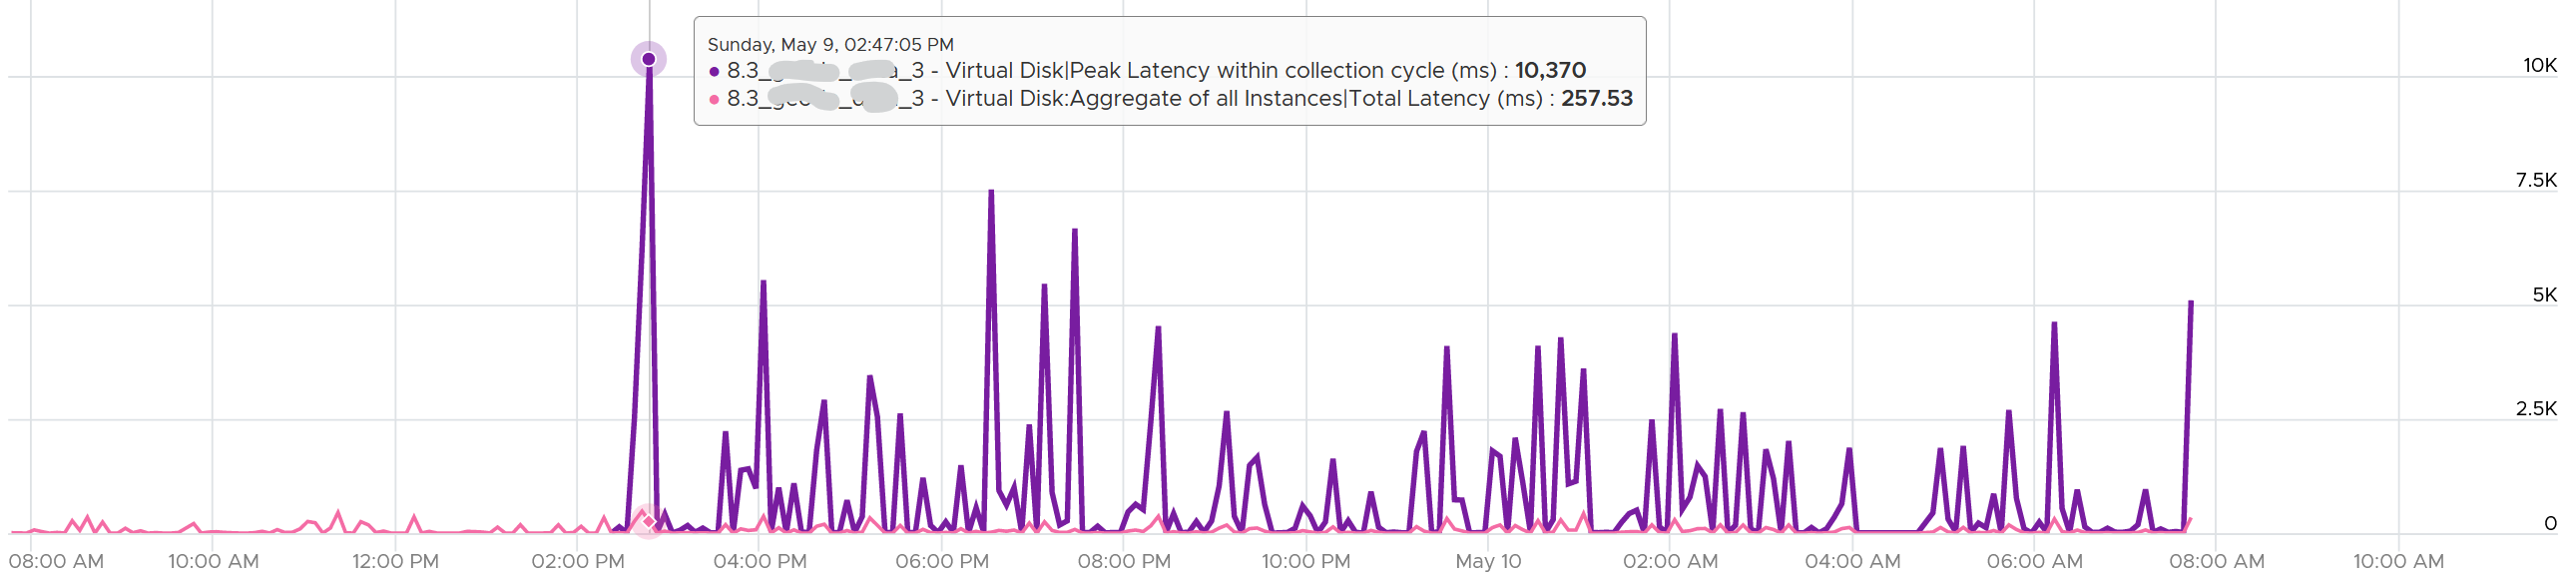
Are you surprised to see that the 20-second peak is a lot worse than 15x worse? The preceding chart shows 10370 ms latency at 20-second vs 257 ms at 300 second.
The huge gap is due to 2 things
-
There is only 1 or 2 microbursts, and it’s much higher than the average. This can happen on counter such as disk latency and CPU context switch, where the value can be astronomically high.
-
There are many sets. A VM can have many disks. For example, a database VM with 20 virtual disks will have 40 sets of metrics. Each set has 15 datapoints, giving a total of 600 metrics. The peak is reporting the highest of 600 metrics. If the remaining is much lower, then the gap will naturally be high.
How are they chosen?
Take a look at the table below. It shows a VM with 2 virtual disks. Each disk has its own read latency and write latency, giving us a total of 4 metrics.
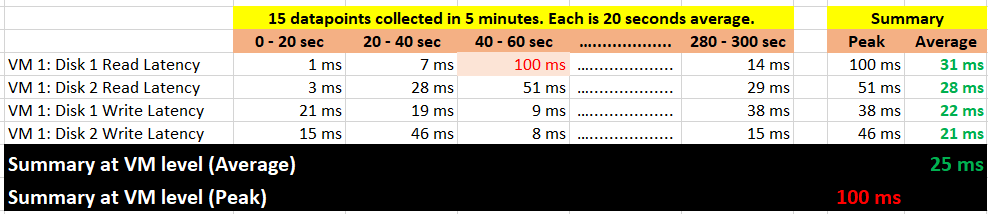
What VCF Operations 8.3 does is to add a new metric. It does not change the existing metric, because both have their own purpose. The 5-minute average is better for your SLA and performance guarantee claim. If you guarantee 10 ms disk latency for every single IOPS, you’d be hard pressed to deliver that service. These new metrics act as early warning. It’s an internal threshold that you use to monitor if your 5-minute SLA is on the way to be breached.
VCF Operations 8.3 takes the peak of these 15 data points, and stores them every 5 minutes. It does not store all 15 data points, because that will create a lot more IOPS and consume more storage. It answers the question “Does the VM or Guest OS experience any performance problem in any 20-second period?”
Having all 20-second data points are more natural to us, as we’re used to 1 second in Windows and 20 second in vCenter performance charts. But how does that additional 14 data points change the end remediation action? If the action you take to troubleshoot is the same (e.g. adjust the VM size), why pay the price of storing 15x more data points?
In the case of virtual disk (as opposed to say memory), a VM can have many of them. A database VM with 20 virtual disks will have 40 peak metrics. That also means you need to check each one by one. So VCF Operations 8.3 takes the peak among all virtual disks read and write. It does the same thing with vCPU. A monster VM with 64 vCPU will only have 1 metric, but this metric is the highest among 64 virtual CPU. There is no need to have visibility into each vCPU as the remediation action is the same. Whether it’s vCPU 7 or vCPU 63 that has the problem, it does not change the conclusion of troubleshooting in most cases.
| 5-minute Average | 20-second Average | |
| Guest OS | CPU Run Queue | Peak CPU Queue within collection cycle |
| CPU Context Switch | Peak CPU Context Switch within collection cycle | |
| Memory Page-out Rate | Peak Guest OS Page-out Rate within collection cycle | |
| Disk Queue Length | Peak Disk Queue within collection cycle | |
| VM CPU | Ready (%) | Peak vCPU Ready within collection cycle |
| Co-Stop (%) | Peak vCPU Co-Stop within collection cycle | |
| Other Wait (%) | Peak Other Wait within collection cycle | |
| Overlap (second) | Peak vCPU Overlap within collection cycle | |
| VM Memory | Contention (%) | Peak Memory Contention within collection cycle |
| VM Disk | Read Latency (ms) | Peak Latency within collection cycle |
| Write Latency (ms) | ||
| VM Network | Usage Rate (KB/s) | Peak Usage Rate within collection cycle |
| Packet/sec | Peak Network Packets/sec within collection cycle | |
| Transmitted Packet Dropped | Peak Transmitted Packet Dropped within collection cycle |
What’s the limitation?
-
You can’t see a pattern within the 300 seconds window as you only have 1 data point. This is largely mitigated by having the average counter also. If the delta between the maximum and average is high that means the maximum is likely a one-off occurrence. The pattern can also be seen over longer period of time.
-
The peak can be from a different 20-second block. That means you can’t associate that the contention is caused by high utilization as the 2 metrics can come from different 20-second block within that 5-minute time period.
Implementation
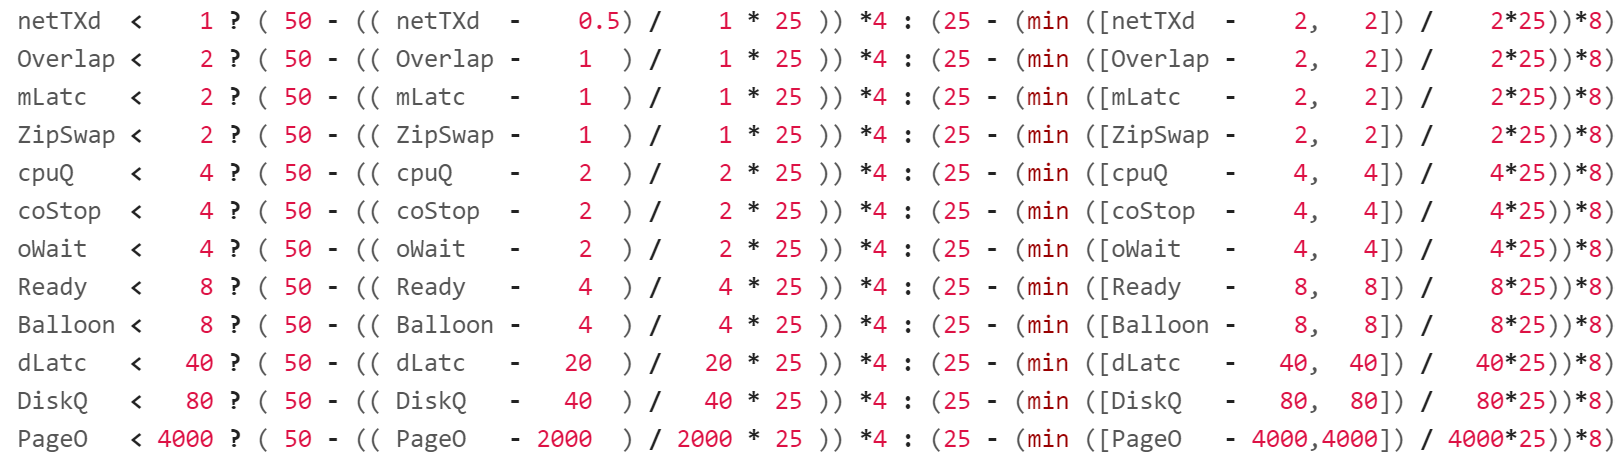
The following shows the part of the formula where we label the metrics used. Label is handy to shorten the overall length while improving readability.
It shows the 12 metrics used.
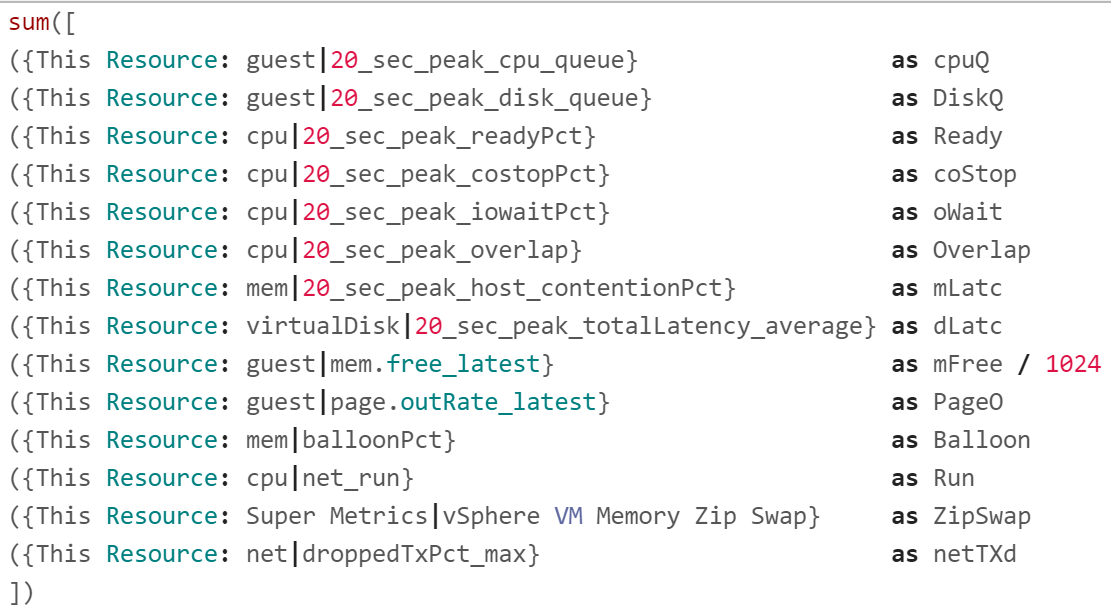
I copied into an external editor to show each metric as 1 line so you can see them more easily.
Free memory measures the disk space. It’s more important to see the latest value. Average of last 5 minutes is better than lowest 20-second period within that 5 minute period.
I’ve rearranged the metrics so you can see the 20 second peak metrics first.
Guest OS Free Memory is in KB, so we need to divide by 1024. Note the division can’t be part of the label.
There is no metric that sums the VM zipped page and swapped page, so I created a super metric for it.
The Green Range
See the concept of the 4 ranges in the Performance Modelling section of Chapter 1.
To see the threshold more easily, I rearranged the metrics from the smallest threshold, and have skipped the metrics with special logic. They will be covered later.
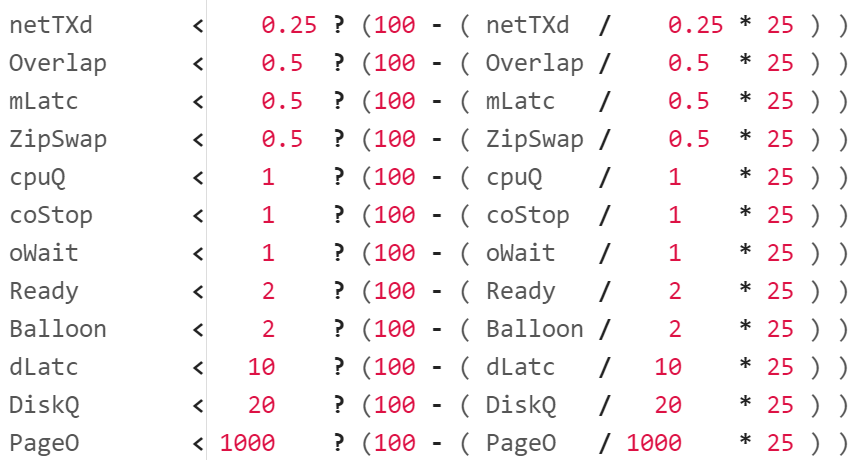
Let’s go through the first line. It checks if network TX dropped is below 0.25%, it will prorate the value to a number between 75% and 100%. To prorate, we do this logic:
-
Divide the value with the green range size to get the fraction.
-
Multiply the result by 25 to adjust the scale to 25 points.
-
Subtract the result from 100 (perfect score), the starting line for green.
BTW, I didn’t add the * 1 weightage multiplier for green at the end to keep the formula simpler. Mathematically it’s not required.
Now let’s look at CPU Run, as it’s a special case.
The range of green is 60% – 80%, not 0 – 80. This means utilization below 60% is given a perfect score of 100%.
Why do we take the maximum of Run – 60 and 0? To ensure we don’t have negative value when the CPU Net Run metric is below 60%. This max() function will return 0, hence giving us 100 – 0 = 100%.
Now let’s look Guest OS Free Memory.
This one is special as the threshold is going descending. We also need to convert the unit from KB to MB.
We want the value of free memory > 512 MB of RAM to translate into 100%. Since the formula returns 0% - 25%, I had to add 75.
The Yellow Range
When the metric value does not within green threshold, it gets evaluated for yellow.
The outcome is 50% - 75%, hence the formula deducts from 75.
Just like the green range, let’s start with the easy ones. You notice the following looks similar to the green range.
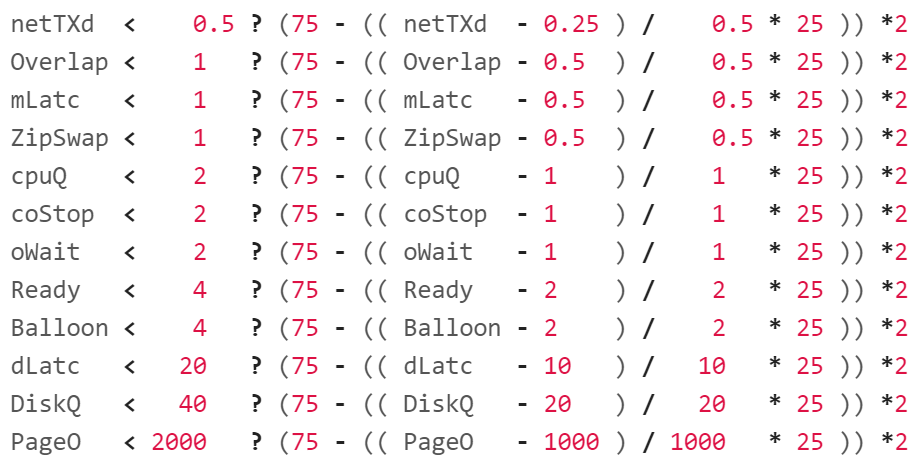
Let’s go through the first line. It checks if network TX dropped is below 0.5%, as it’s definitely above 0.25%.
It then prorates the value to a number between 50% and 75%. To prorate, it applies a logic similar to the green range.
-
Divide the value with the yellow range size to get the fraction.
-
Multiply the result by 25 to adjust the scale to 25 points.
-
Subtract the result from 75, the starting line for yellow.
The * 2 at the end is the weightage multiplier. Green is given a 1x weightage, while yellow is 2x, orange is 4x and red is 8x. The value is amplified, and then normalized again at a later portion (not shown in the screenshot).
As we’re not dealing with the edge of the range, the next 2 metrics have simpler logic.
For CPU Run, the logic becomes consistent with the simpler metrics. Just need to map 80% - 90% Run value to 75% - 50% range.
For Memory Free, we have to keep on dividing by 1024.
The Orange Range and Red Range
I’m showing them together as it’s an IF THEN ELSE. Whatever not caught by the orange is handled by red.
What do you notice in the red range?
It has a min() function. This is to guard against a very large value. For example, in CPU Ready, any value above 8% will be given a score of 0%, not negative.
The formula for CPU Run becomes simpler as it cannot go above 100. We do not need to do the min() function for the red range.
The expression 50 – caps the value of orange at 50%, while the red is capped at 25.
The * 4 at the end is the weightage multiplier for orange. The * 8 at the end is the weightage multiplier for red.
Now let’s look at the remaining metrics.
For Guest OS Memory Free, since the threshold is descending, the logic is simpler as the value cannot be less than 0.
vMotion
There are 3 metrics to watch. In order of importance, they are:
-
Downtime
-
Stun time
-
Copy Bandwidth
The first 2 are contention metrics. You should set alarm for high values.
The last one is a consumption metric.
Since the values for each vMotion migration can vary, monitor both the outlier and the average, and match them to your expectation.
Downtime
Log Insight explains it well, so I will use it with some modification:
During the final phase of a vMotion operation, the VM is momentarily quiesced on the source ESXi host. This enables the last set of memory changes to be copied to the target ESXi host. After that, the VM is resumed on the target host. The guest briefly pauses processing during this step. Although the duration of this phase is generally less than 200 milliseconds, it is where the largest impact on guest performance (an abrupt, temporary increase of latency) is observed. The impact depends on a variety of factors such as network infrastructure, shared storage configuration, host hardware, vSphere version, and dynamic guest workload.
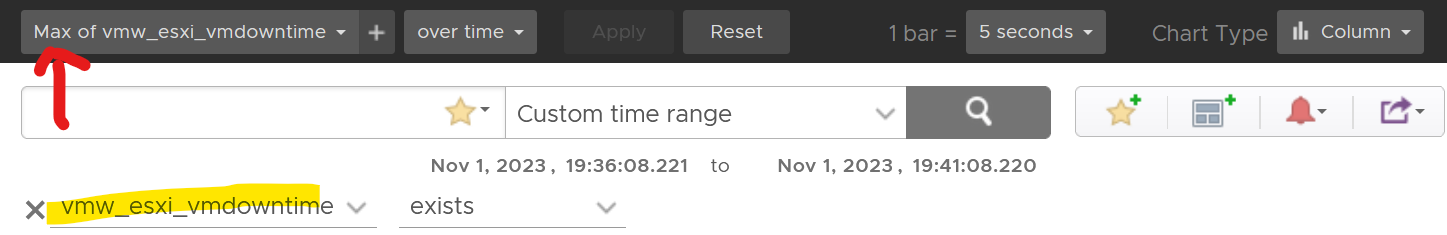
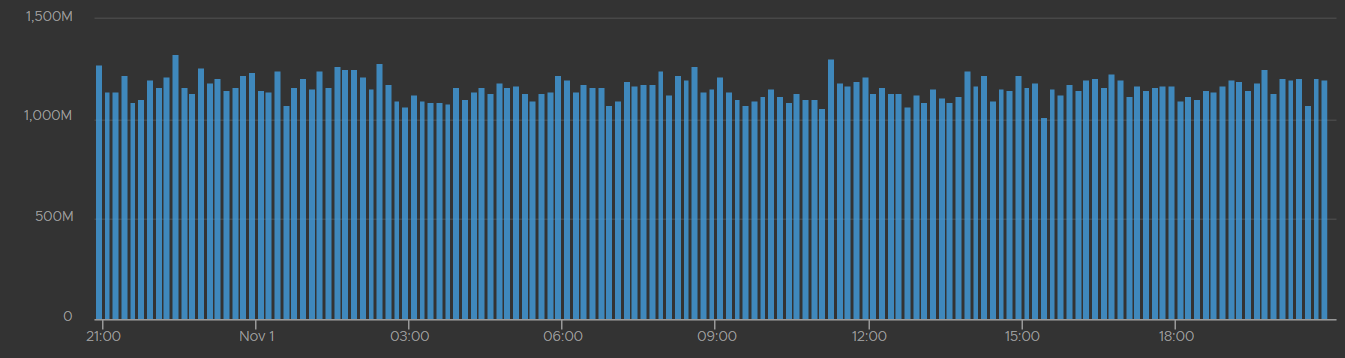
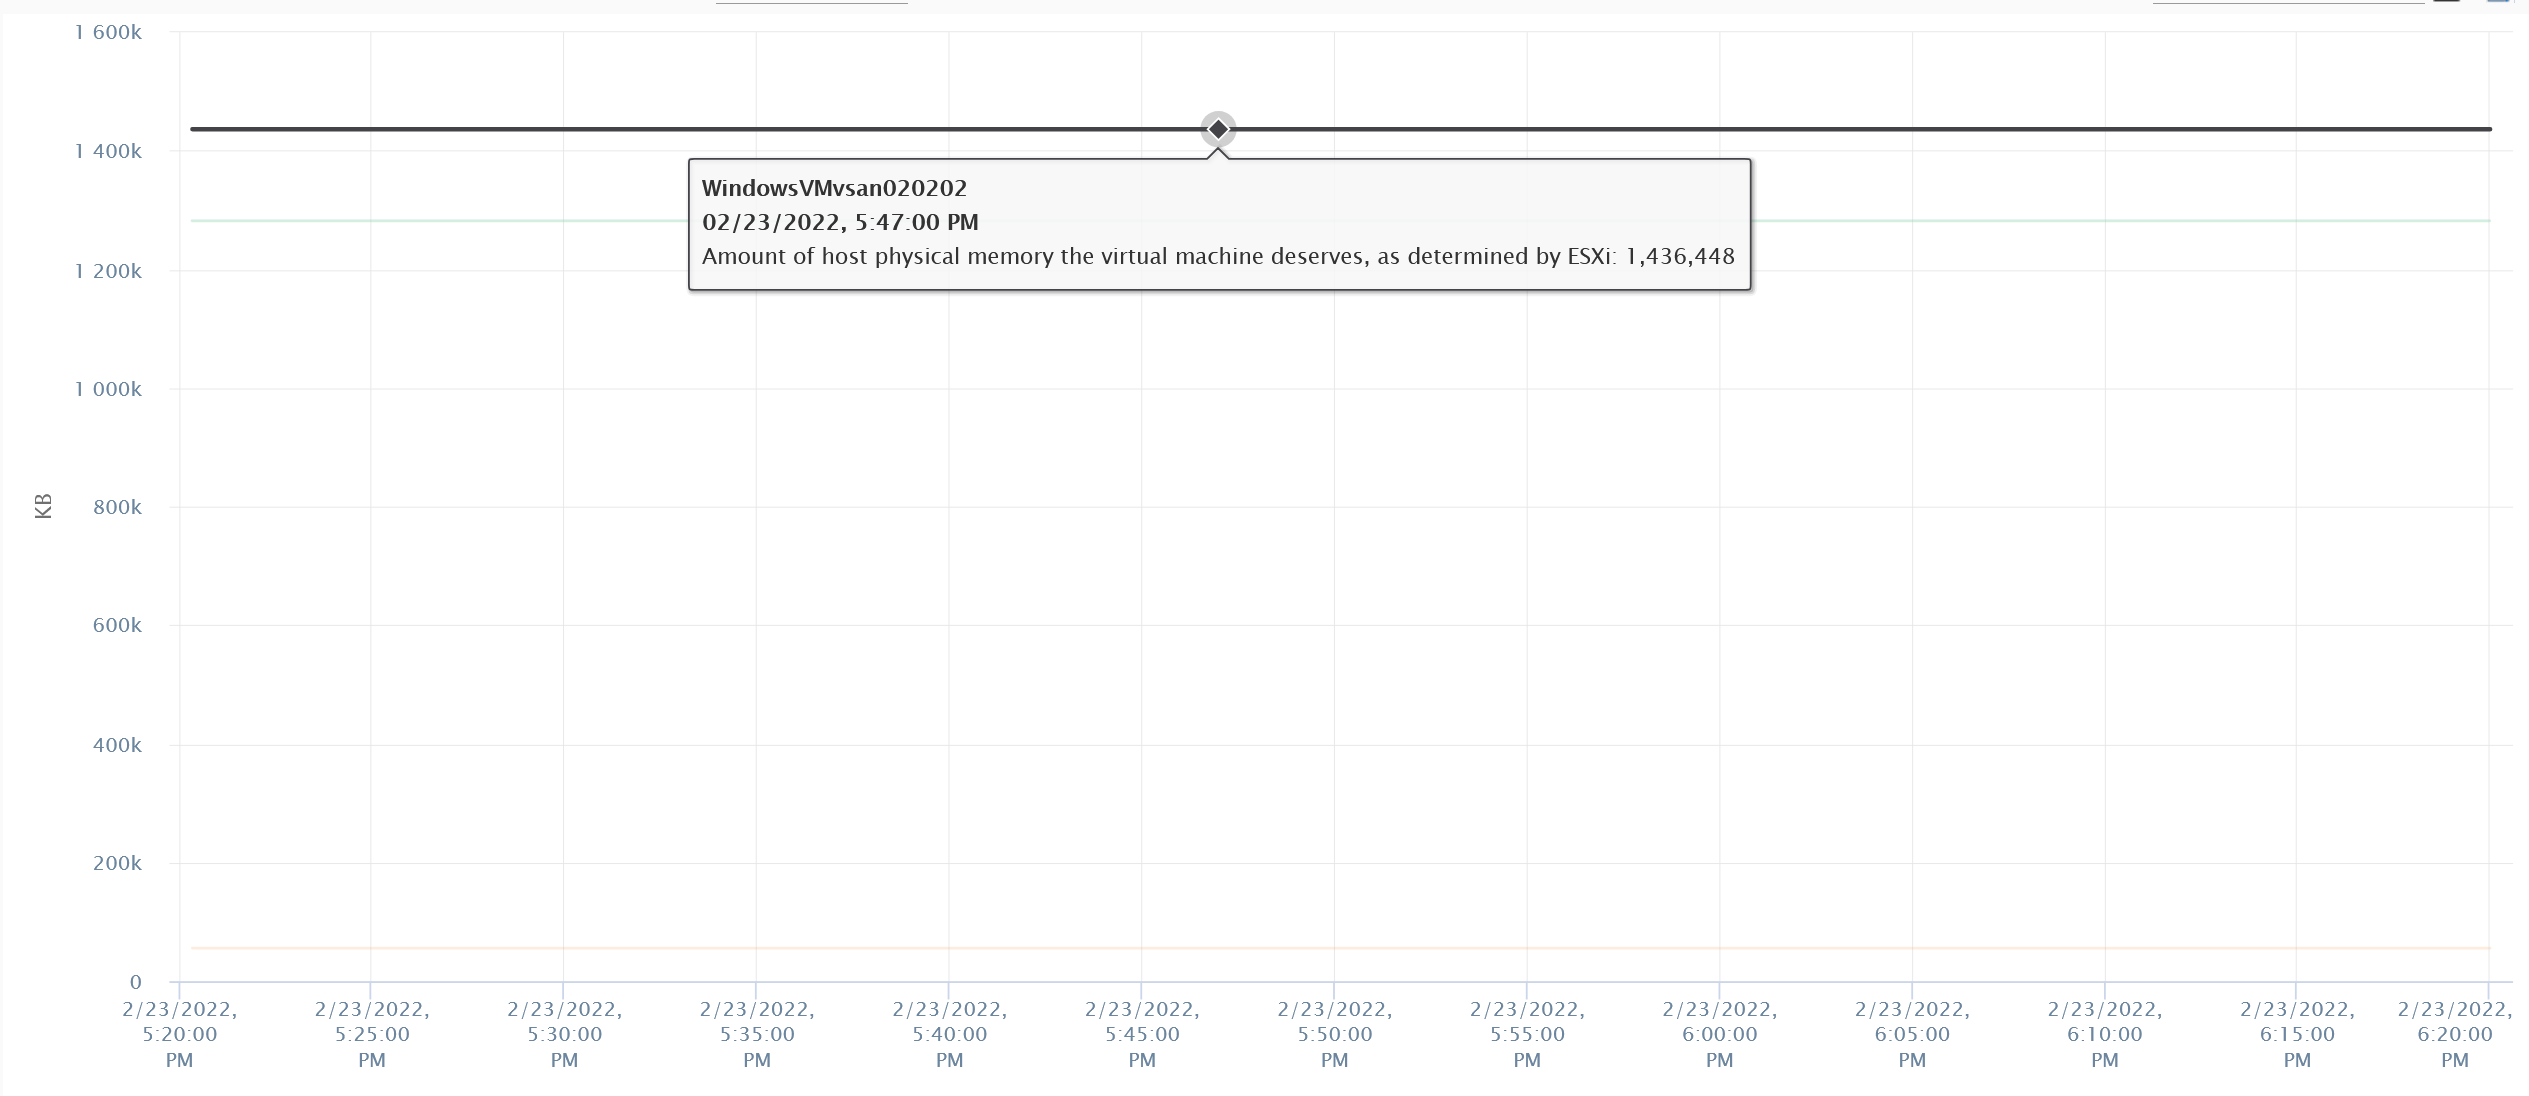
The following screenshot shows trend towards unhealthy range.
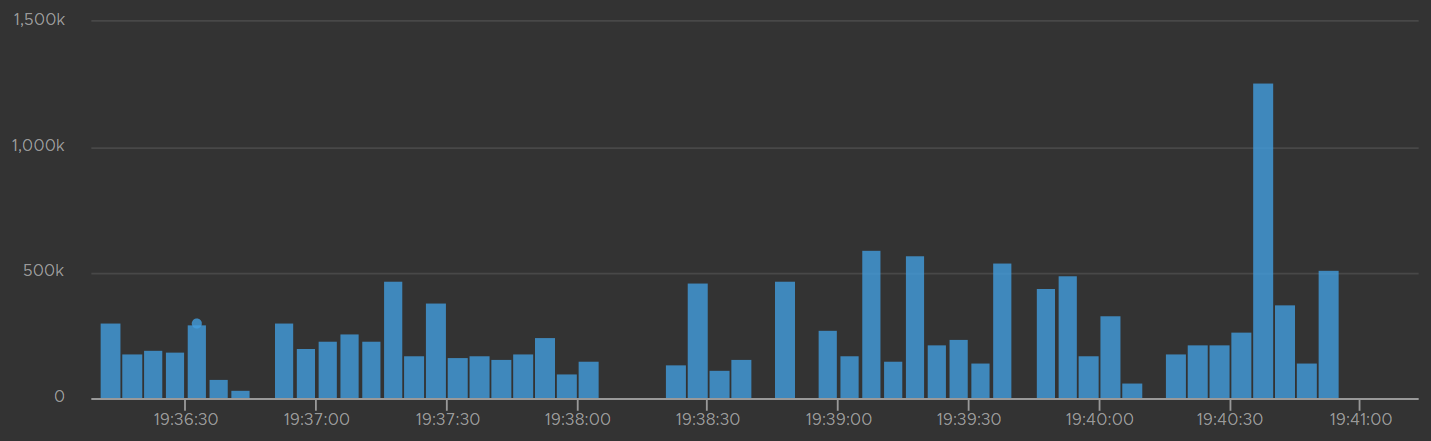
The time unit is in microseconds. The expected time is 200 milliseconds. Anything over one million microseconds (one second) is a cause for concern.
Log Insight has a metric called vmw_esxi_vmdowntime. Plot the worst value as it’s a leading indicator.
Stun Time
Stun Time is the period the VM gets a checkpoint stun, where no guest instruction is executed on the same vmx file. Operations that incur checkpoint are device reset, disk branching, disk promotion, snapshot take, and snapshot consolidate. A long stun time will impact Guest OS performance.
During the first phase of a vMotion operation, a snapshot is created for the VM. Snapshot means a delta VMDK is being created, which requires a stun operation. The VM then switches its write operations to the delta disk.
The time unit is in microseconds. 200 millisecond is a good threshold, and anything above 1 second should be investigated.
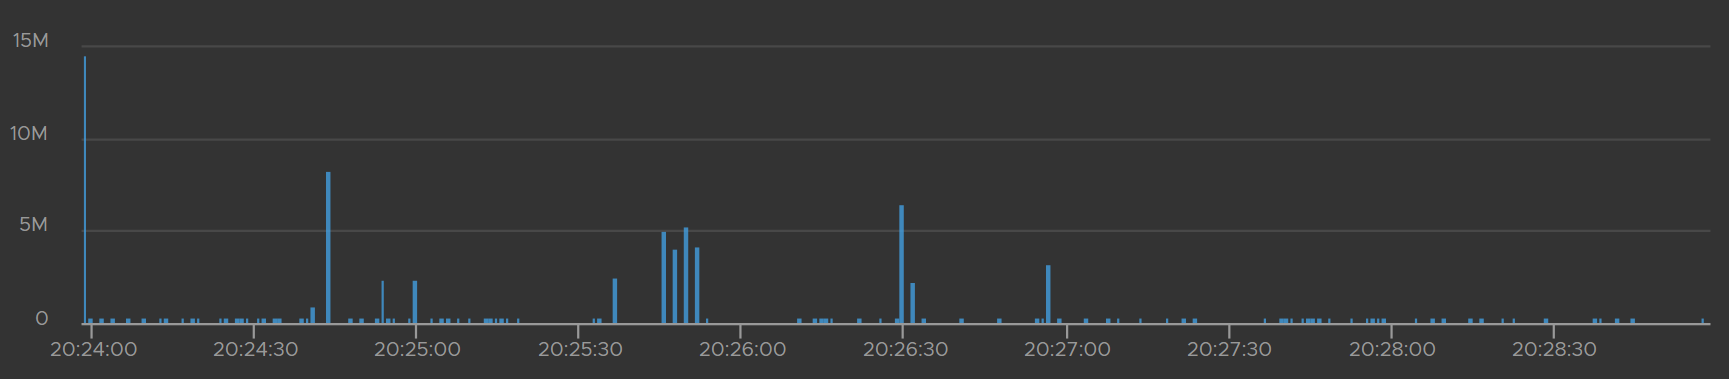
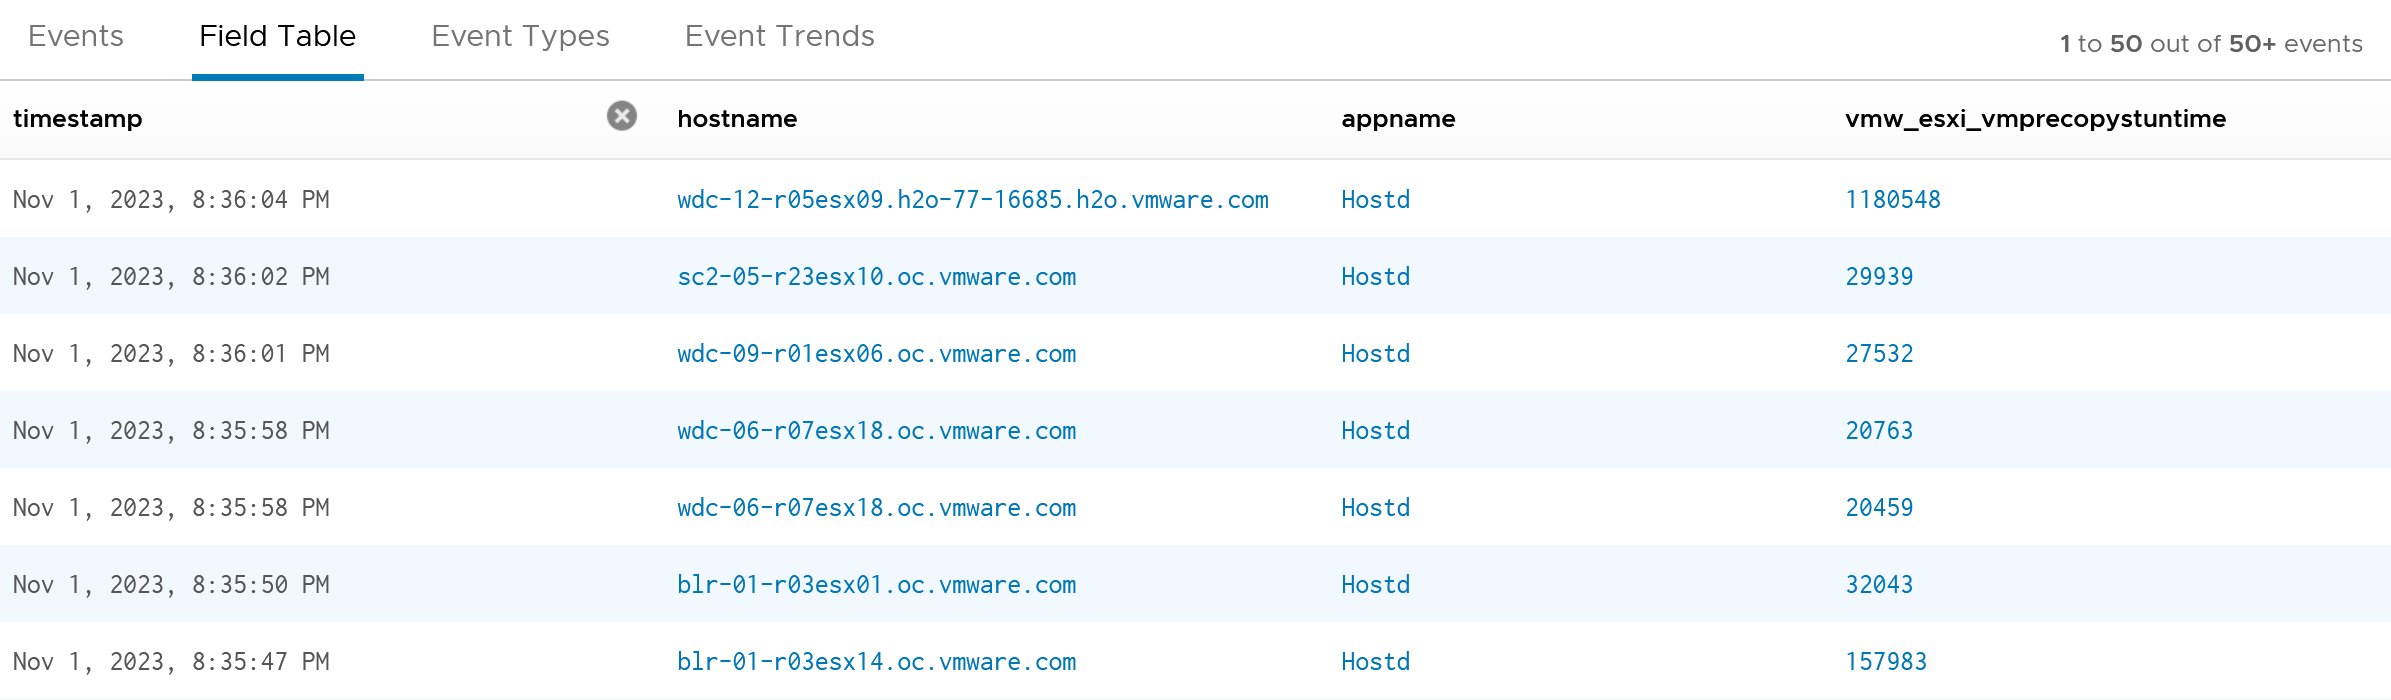
Log Insight has a metric called vmw_esxi_vmprecopystuntime. Plot the highest value as it’s a leading indicator.
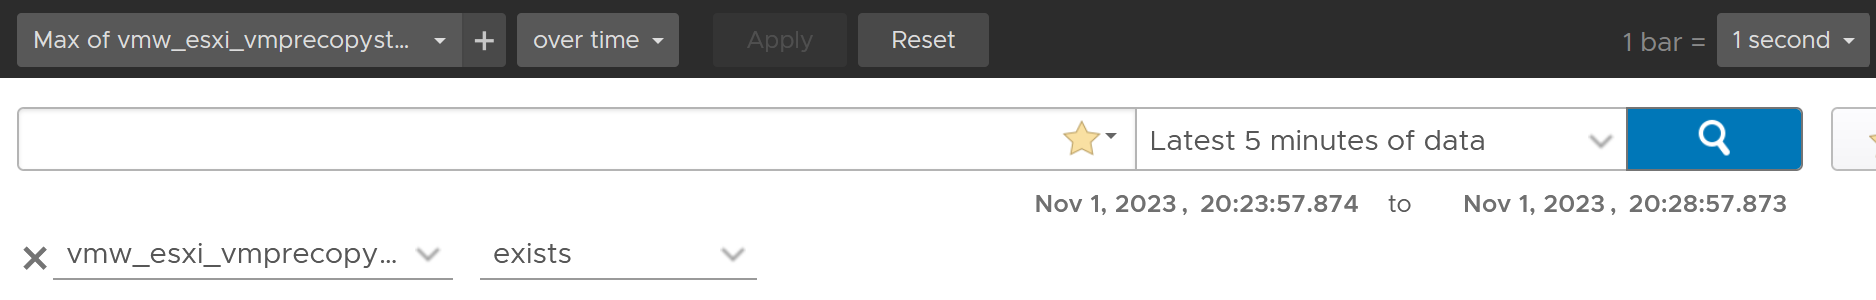
Complement the above trend chart with a table that shows the ESXi host. Note the table does not show the VM name.
Copy Bandwidth
Since this is a consumption metric, ensure the values are not too low, as that will slow down vMotion progress.
The bandwidth (Gb/s) should be relatively stable and matches the assigned capacity for vMotion traffic.
Latency Sensitivity
You can reduce the latency and jitter caused by virtualization by essentially “reserving” the physical resource to a VM. In the vSphere Client UI, edit VM settings, and go to VM Options tab.

Scroll down until you see this option.
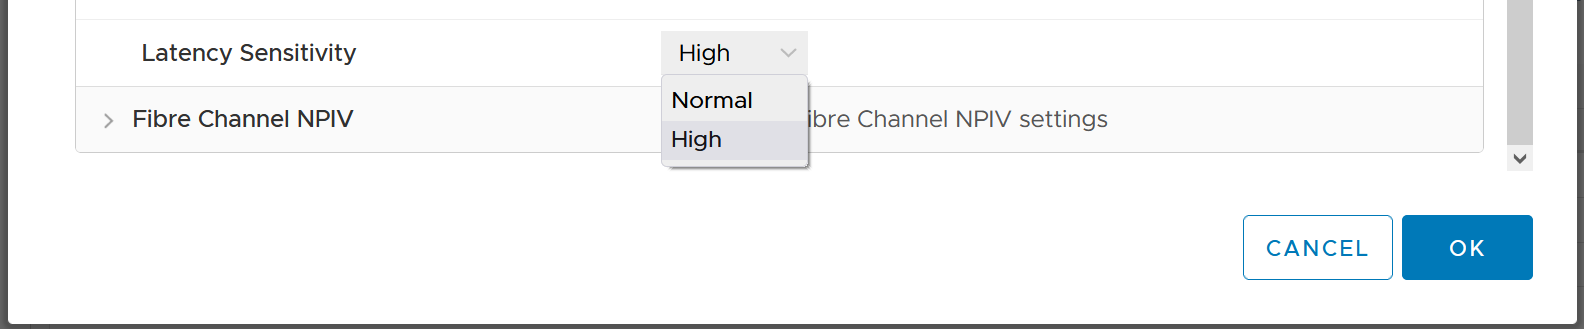
What happens to the metrics when you set Latency Sensitivity = High?
CPU Impact
The CPU “pipeline” has to be made available. In a sense, the CPU is scheduled 100% of the time. This prevents any wakeup or scheduling latencies that result of having to schedule a vCPU when it wakes up in the first place. Yes, the exclusive bit of exclusive affinity is literal.
Let’s see what it looks like in esxtop. I’ve removed unnecessary information so it’s easier to see. What do you notice?
GID NAME %USED %RUN %SYS %WAIT %IDLE
153670 vmx 0.03 0.03 0.00 100.00 0.00
153670 NetWorld-VM-2127520 0.00 0.00 0.00 100.00 0.00
153670 NUMASchedRemapEpochInitialize 0.00 0.00 0.00 100.00 0.00
153670 vmast.2127520 0.00 0.00 0.00 100.00 0.00
153670 vmx-vthread-212 0.00 0.00 0.00 100.00 0.00
153670 vmx-filtPoll:WindowsTest 0.00 0.00 0.00 100.00 0.00
153670 vmx-mks:WindowsTest 0.00 0.00 0.00 100.00 0.00
153670 vmx-svga:WindowsTest 0.00 0.00 0.00 100.00 0.00
153670 vmx-vcpu-0:WindowsTest 0.31 100.21 0.00 0.00 0.00
153670 vmx-vcpu-1:WindowsTest 0.16 100.21 0.00 0.00 0.00
153670 vmx-vcpu-2:WindowsTest 0.15 100.21 0.00 0.00 0.00
153670 vmx-vcpu-3:WindowsTest 0.15 100.21 0.00 0.00 0.00
153670 LSI-2127520:0 0.00 0.00 0.00 100.00 0.00
153670 vmx-vthread-212:WindowsTest 0.00 0.00 0.00 100.00 0.00
We can see Run shot up to 100%. This means Wait has to go down to 0%.
Strangely, Used remains low, so we can expect that Usage remains low too. This means the formula that connect Run and Used do not apply in this extreme scenario. You’re basically cutting a physical core to the VM.
But what about Demand?
Demand shot up to 100% flat out.
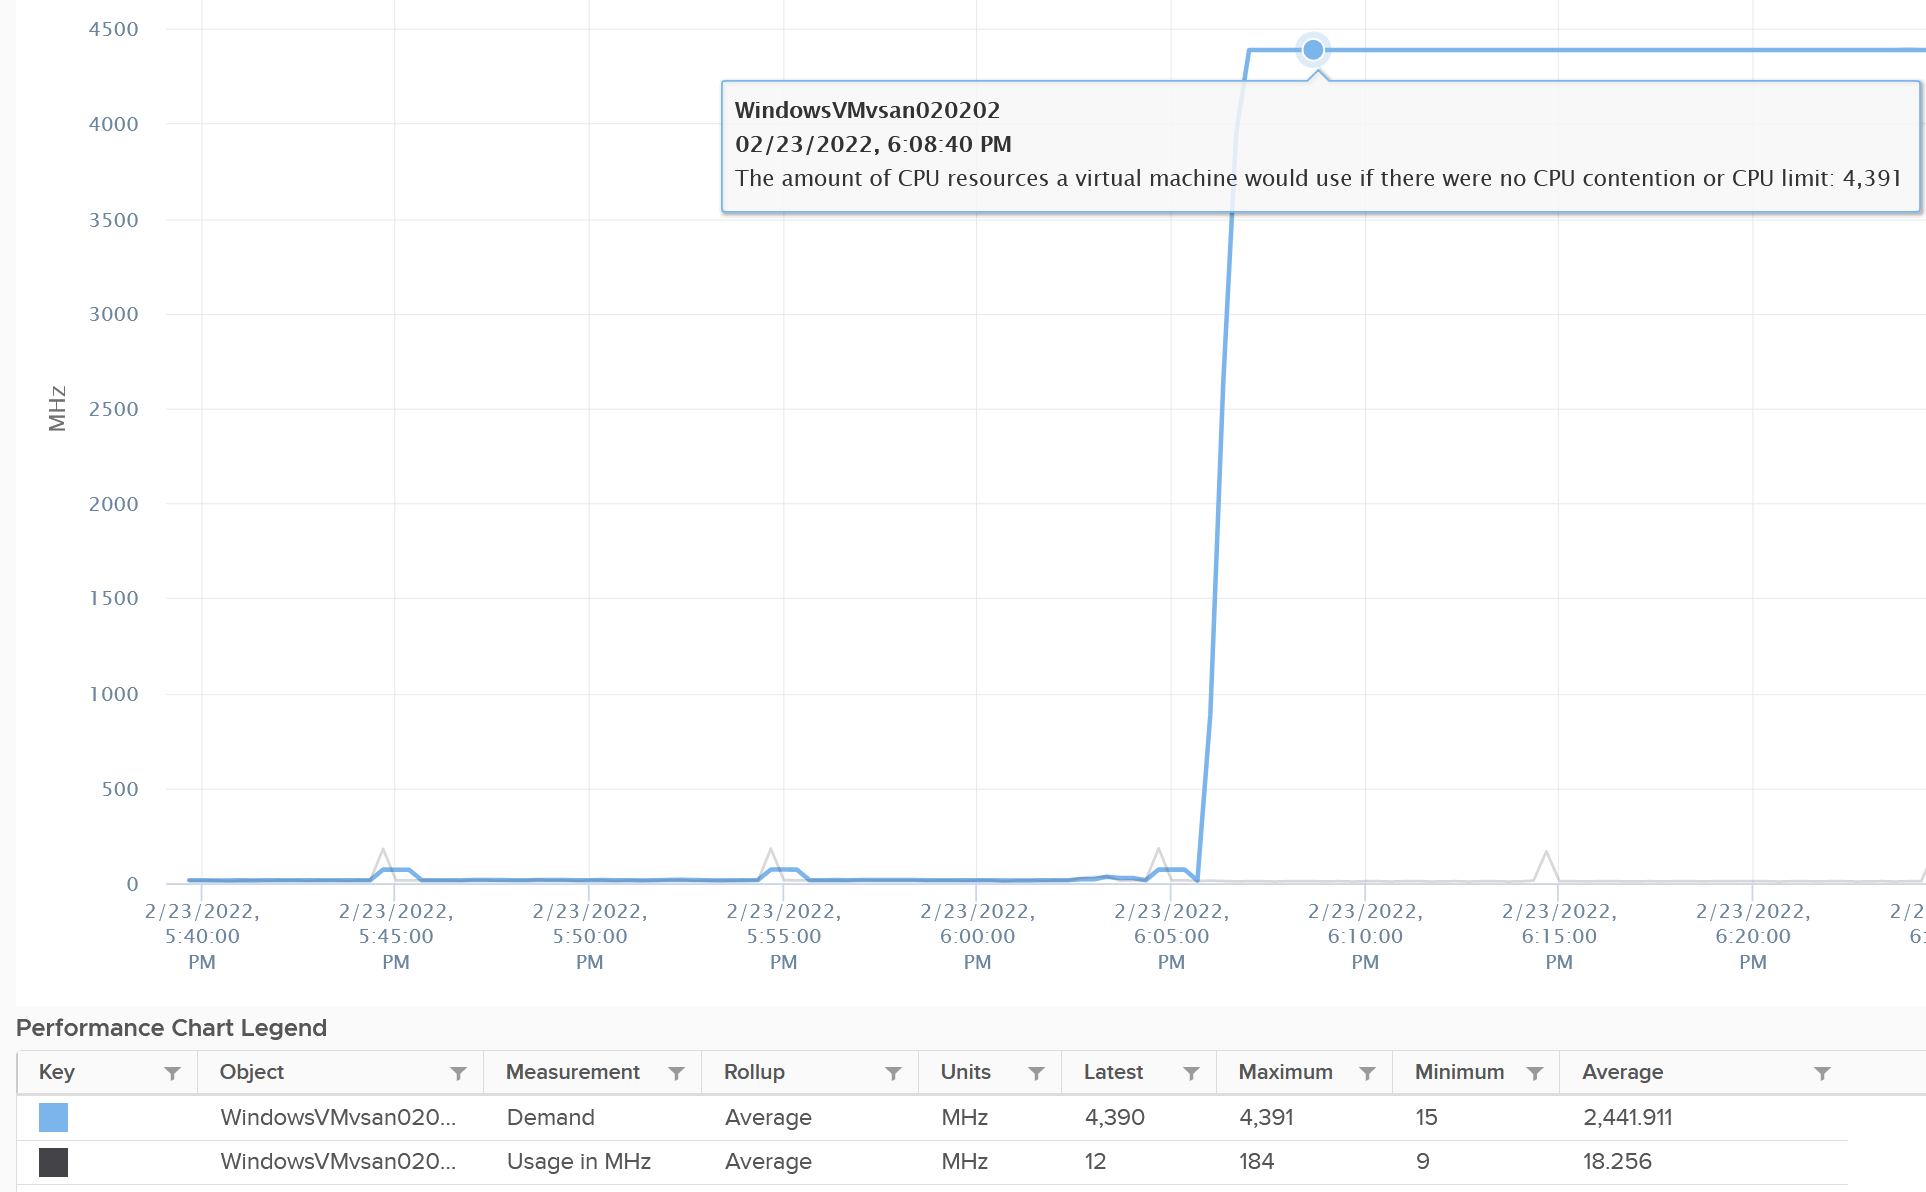
So you have an interesting situation here. Demand is 100%, Usage is 0%, yet Contention is 0%.
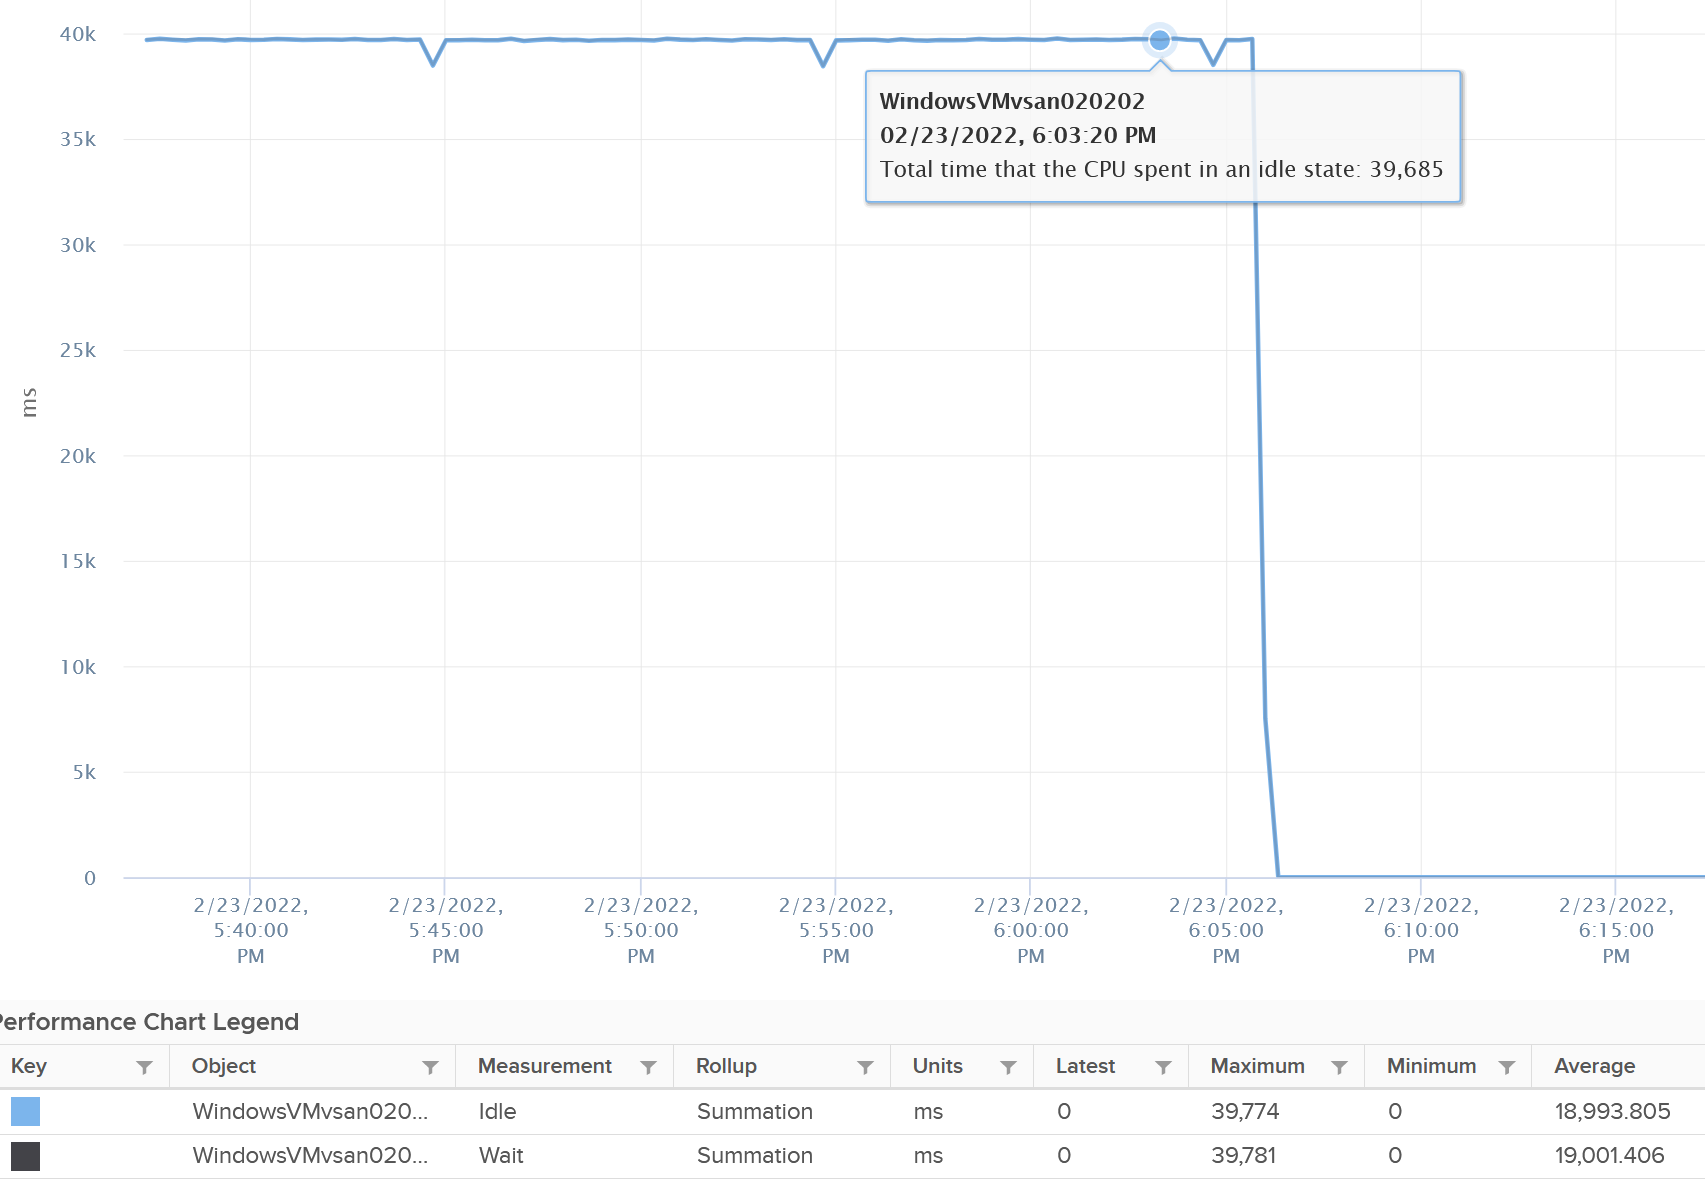
Now let’s plot what happened to Wait and Idle. Notice both went from 100% to 0%.
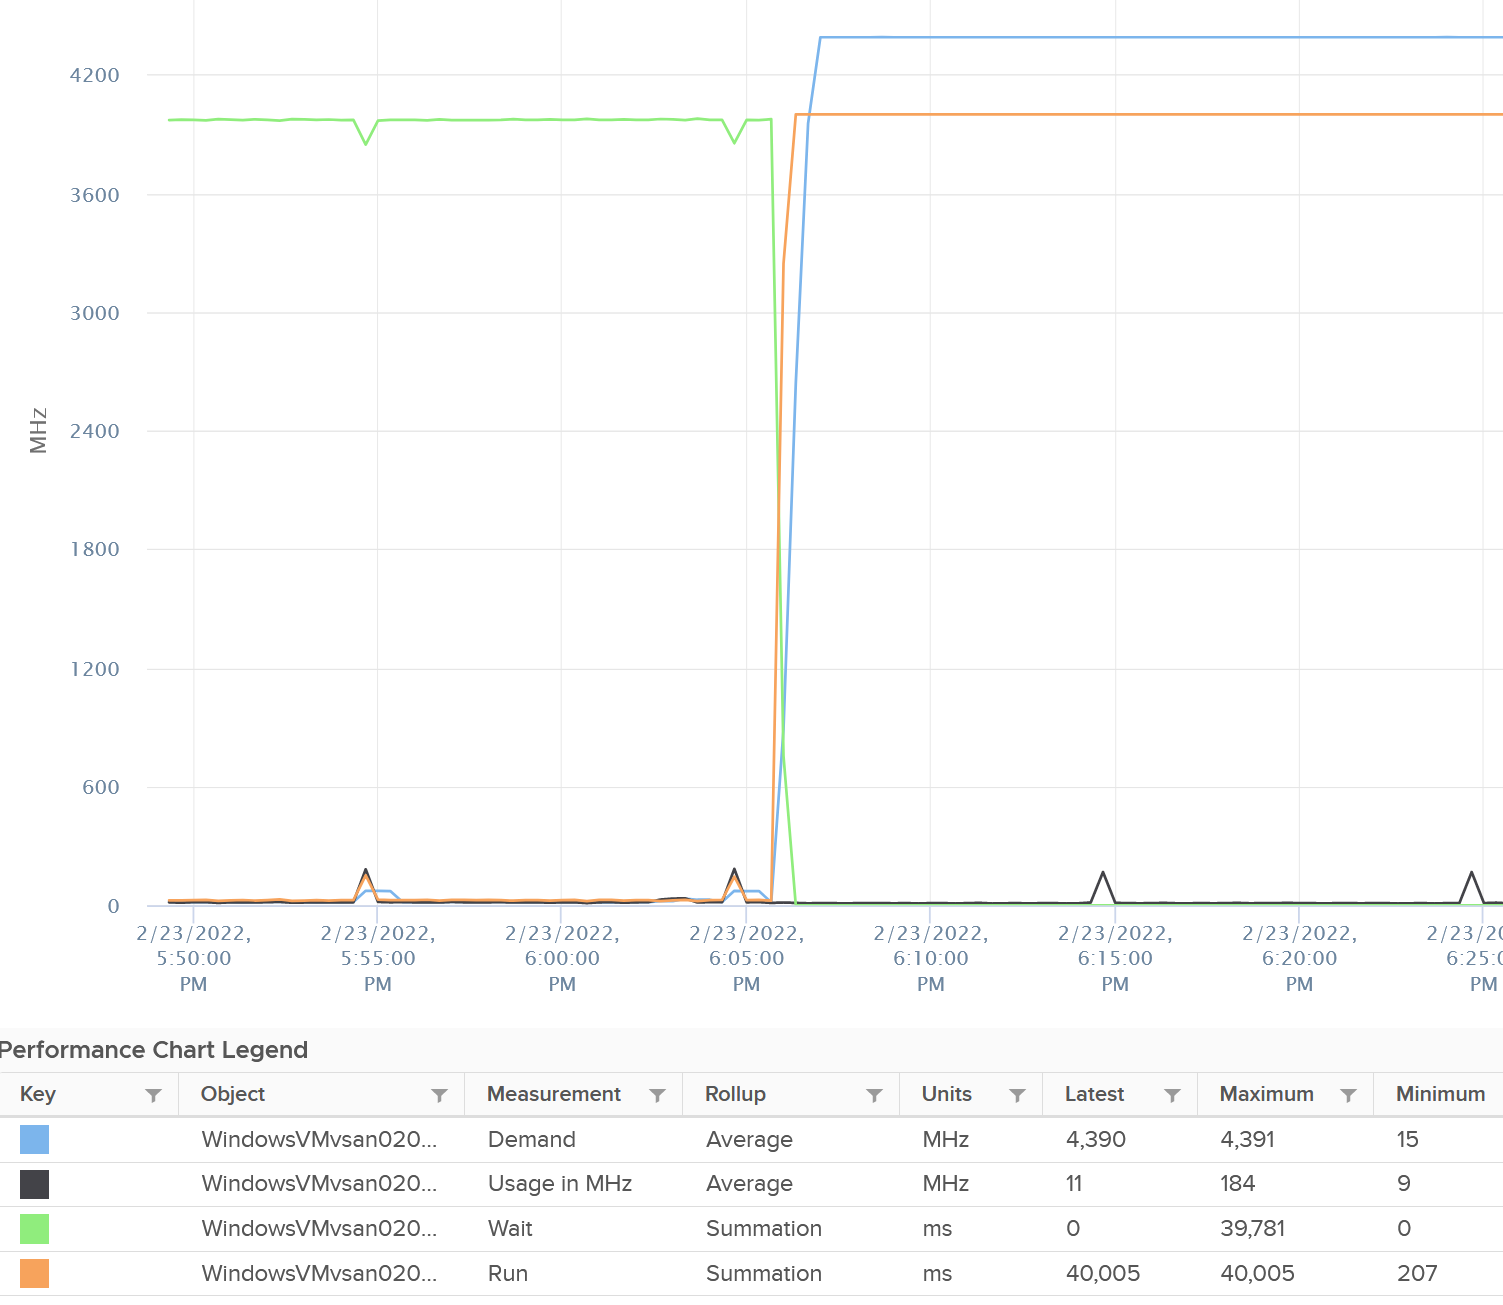
So if you combine Run, Demand, Wait and Usage metrics, you can see basically Run and Demand shot up to 100% as Wait drops to 0%, while Usage is oblivious to the change.
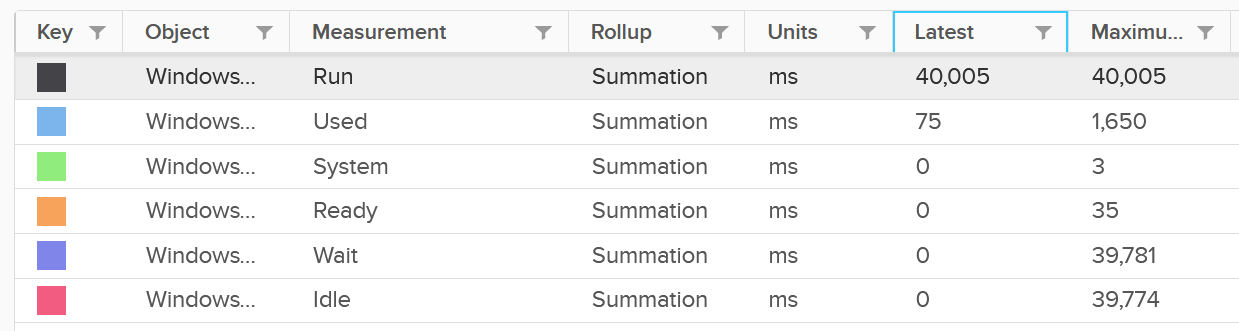
Just for documentation purpose, System and Ready are obviously not affected.
Memory Impact
Memory is fundamentally storage. So I do not expect any of the counters to go up. They will go up when the VM actually needs them.
The above VM has 4 GB of RAM, fully reserved. But since it’s basically idle, there is no change on the counter.
Capacity: VM
VM right-sizing is a commonly misunderstood term because there are actually 2 distinct formulas: 1 internal and 1 external.
-
Internal means sizing the Guest OS, which lives inside a VM. Let’s call this Guest OS Sizing.
-
External means sizing the footprint of the VM to the underlying ESXi and infrastructure. Let’s call this VM Footprint.
VM Footprint | Guest OS Sizing
To see the difference between internal and external sizing, let’s examine a few popular use cases:
-
Your application team asks for extra vCPU. In this case, the hypervisor overhead is irrelevant. When you size NSX edge vCPU, you do not need to add extra vCPU for the overhead to do the packet processing. This means you’re sizing Guest OS.
-
Infrastructure team is migrating a VM to a new ESXi with CPUs that are 2x the speed. For example, from a 2 GHz ESXi to 4 GHz. All else being equal, you can cut down the VM size by 2. A 16 vCPU becomes 8. In this case, the hypervisor counter is more accurate.\
However, you are worried about causing queue inside the Guest OS as the application may expect 16 slow threads vs 8 fast ones. In this case, you need to look inside Guest OS but do that after rightsizing.
-
You’re migrating a VM from classic VMFS to vSAN. In this case, use the hypervisor metric as it will be adjusted according to vSAN FTT policy.
-
You’re converting VM virtual disks from thin to thick. In this case, the consumption at Guest OS level is irrelevant as you’re inflating the virtual disk into its configured size.
From the above use cases, we need two different formulas:
| Purpose | Method |
| Guest OS Sizing | Using Windows/Linux counters. Excludes VM overhead, includes Guest OS Queue. Used to size the “VM”, meaning the CPU and RAM requirements of Windows or Linux. For disk, that means the size of the Guest partitions, but expressed in terms of virtual disks. |
| VM Footprint | Using vSphere counters. Includes VM overhead, excludes Guest OS Queue. Used to size the “infrastructure footprint” of the VM |
Once we know what the VM needs, we need to project based on past data and recommend the new size. The new size is then adjusted to comply with NUMA.
You’ll see below that CPU, RAM and storage all require different approach.
Benefits
Rightsizing is important for a VM, more so than for a physical server. Here are some benefits:
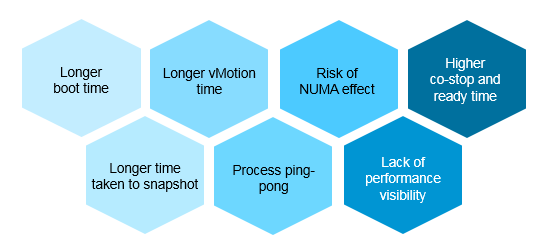
I’ve seen large enterprise customers try to do a mass adjustment, downsizing many VMs, only to have the effort backfire when a tiny percentage of VM performance suffers. Take time and effort to educate the VM Owner that right sizing actually improves performance, despite the seemingly odd logic. A carrot is a lot more effective than a stick, especially for those with money. Saving money is a weak argument in most cases, as VM Owners have paid for the VMs.
Here is an example where accuracy in right-sizing matters:
-
The ESXi CPU has 2 socket, 16 cores each.
-
The VM has 16 vCPU. It runs at 90%, so it fits into a single socket.
-
The queue inside Linux is below 2 per vCPU for 95% of the time. This means the 16 vCPU is working hard, but able to serve all processes well.
-
However, you decide to use the CPU Usage counter, which runs 25% higher due to Turbo.
-
16 vCPU x 90% x 125% = 18 vCPU
-
Based on the above, you incorrectly increase the size to 18 vCPU
-
The VM now spread into 2 NUMA nodes. You can have either 9 per side, or 10 vs 6. You do not like the idea of running odd numbers, plus you think it’s safer to give buffer, so you bump the number to 20 vCPU.
-
The VM vCPU will now be spread into 2 CPU. This means the memory will be spread too. The result is NUMA effect.
With CPU having CCD complex within a single socket, the NUMA effect does happen within a socket albeit with less penalty.
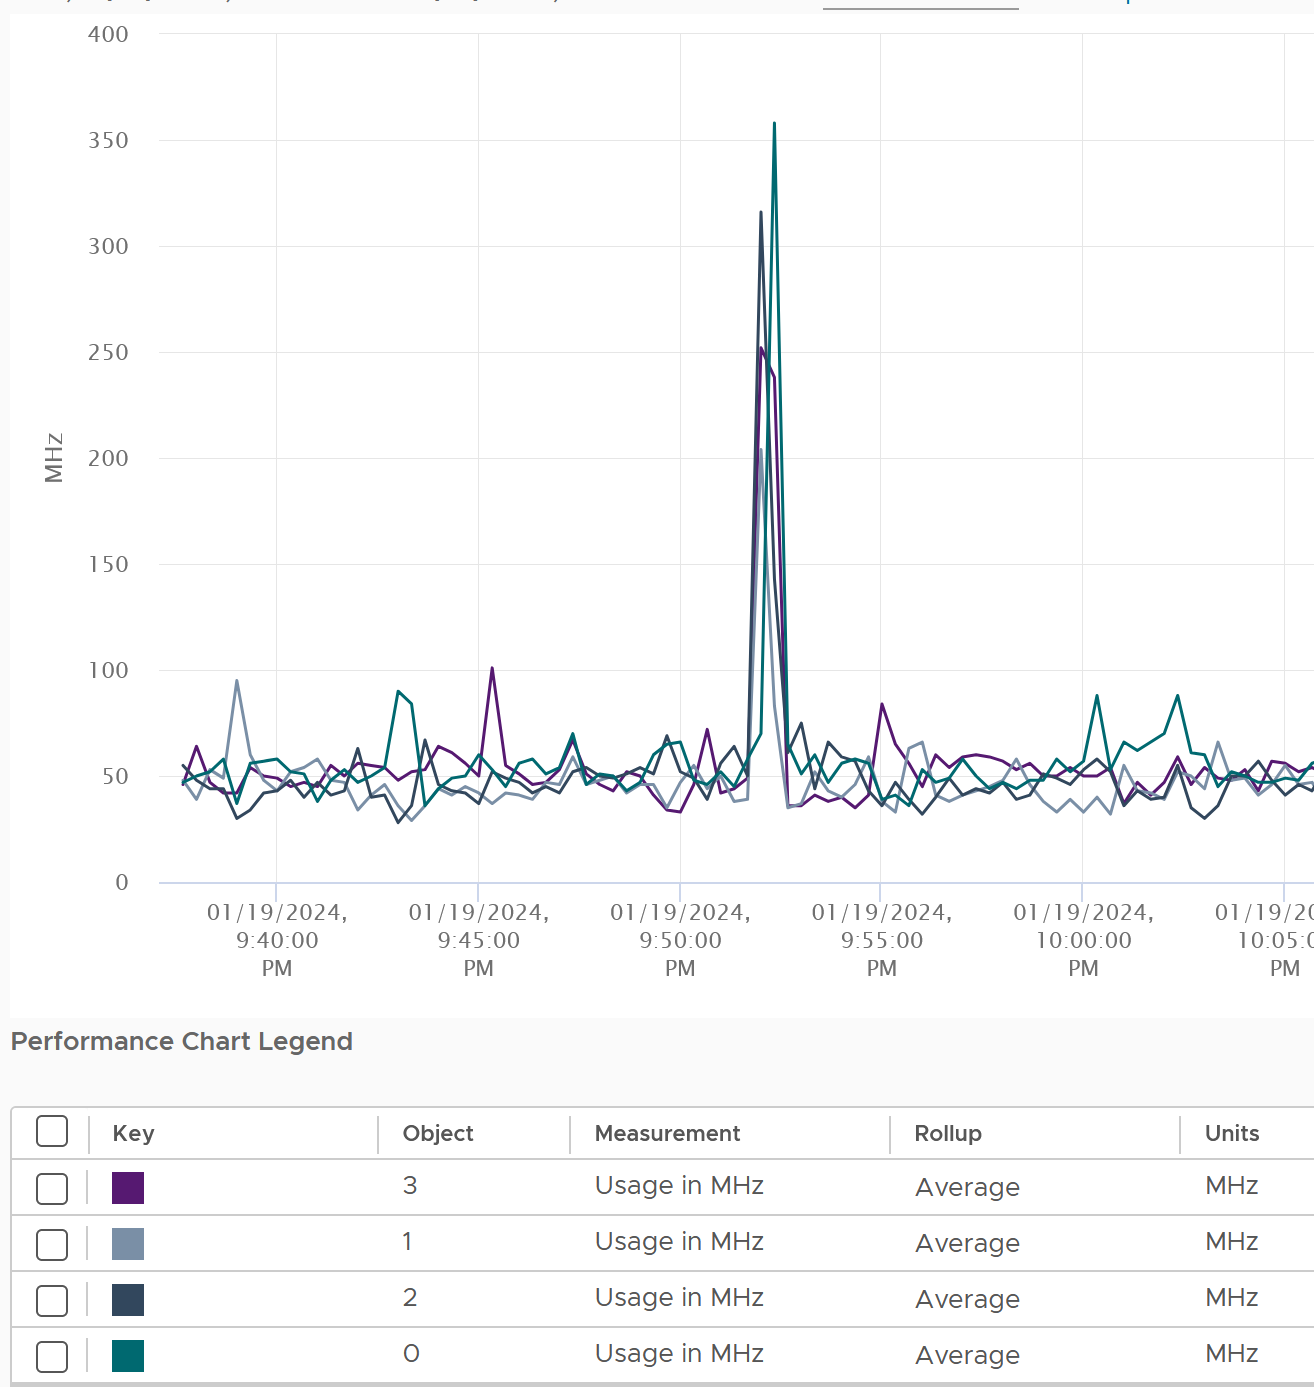
Another benefit of rightsizing is potentially faster speed from higher CPU frequency. Less vCPU means less physical threads to run. This means ESXi is able to boost the active threads by keeping unused cores. To see this, choose the CPU Usage (MHz) counter and show all the vCPU.
Lower co-stop and ready time. Even if not all vCPU is used by the application, the Guest OS will still demand all the vCPU be provided by the hypervisor.
Faster snapshot time, especially if memory snapshot is included.
Faster vMotion. Windows and Linux use memory as cache. The more it has, the more it uses, all else being equal.
Faster boot time. If a VM does not have a reservation, vSphere will create a swap file the size of the configured RAM. This can impact the boot time if the storage subsystem is slow.
Guest OS Sizing
What rules to follow then sizing the Guest OS?
CPU Sizing
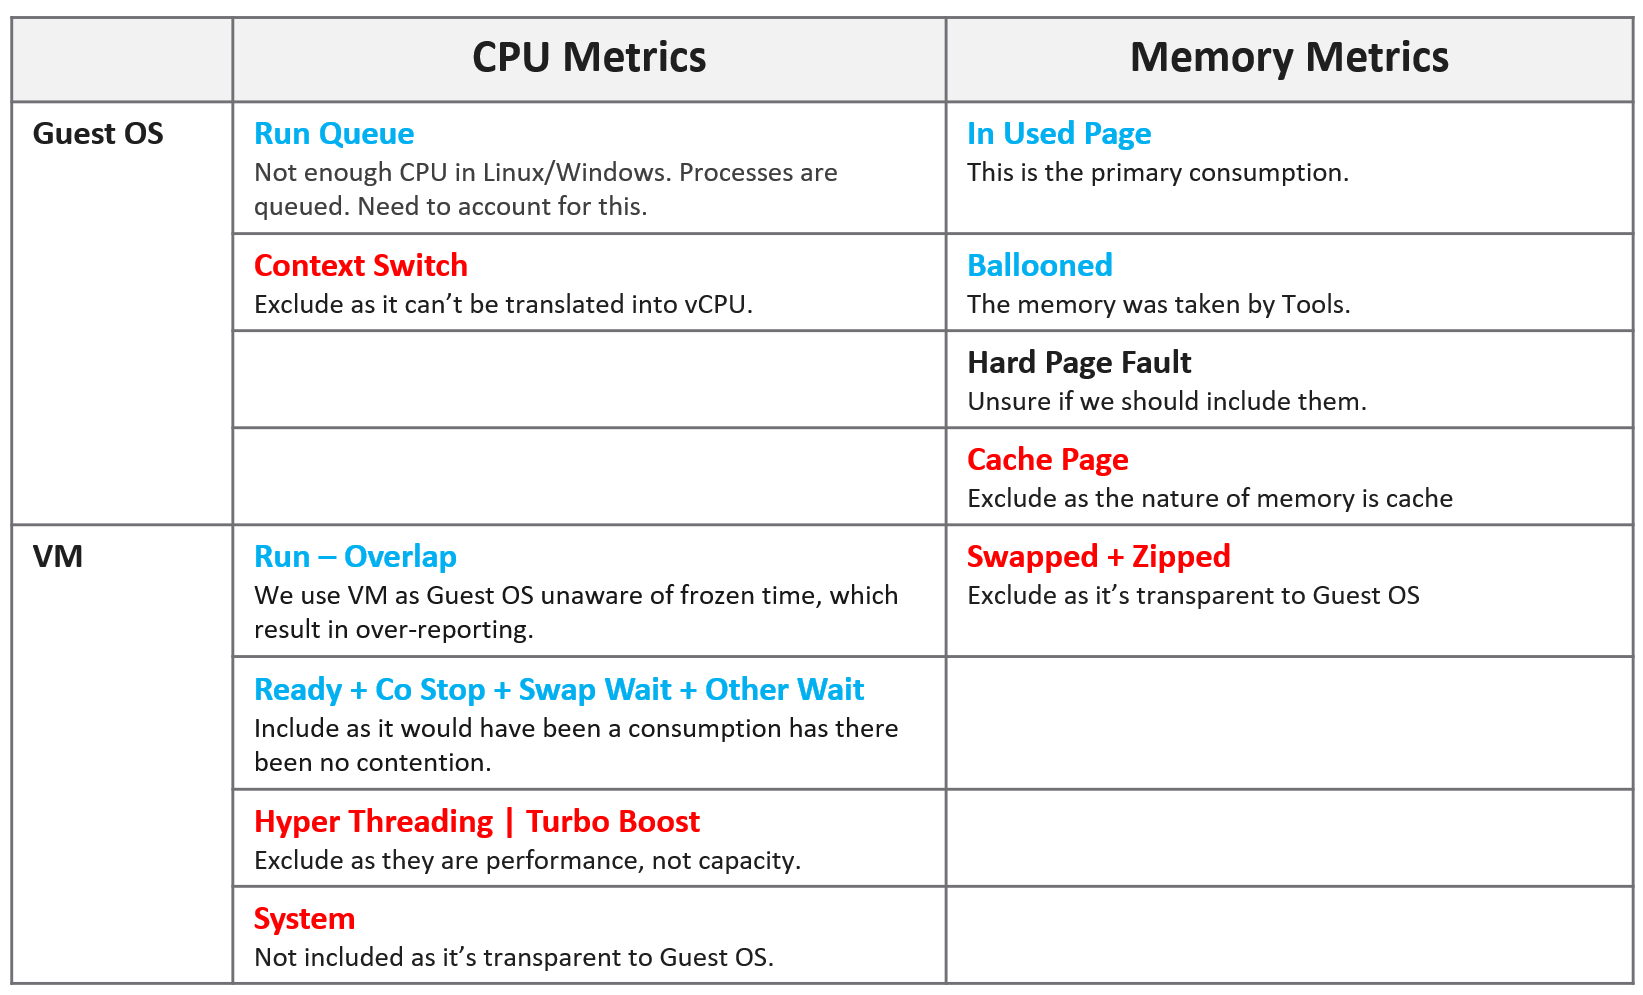
What metrics should be excluded when sizing Guest OS? What metrics should be included?
Having the correct inputs increase the accuracy of the prediction.
Exclusion
| Hyper-Threading | The Guest OS is unaware of HT. Windows/Linux is still running, regardless of speed and throughput. When Windows/Linux vCPU happens to run on a thread that is sharing a core with another thread, the OS will simply run with lower efficiency. It experiences 37.5% drops in computing power. For example, instead of running on a 3 GHz, it feels like it’s running on 1.875 GHz chip. The VM CPU Demand and VM CPU Usage metrics are not suitable as their values are affected by CPU Frequency and HT. |
| CPU Frequency | Same reason as above. The only exception here is the initial sizing, when the VM is not yet created. The application team may request 32 vCPU at 3 GHz. If what you have is 2 GHz, you need to provide more vCPU. |
| CPU idle time | Guest OS CPU will be idle for a while when waiting for ESXi to execute IO. However, while making the IO subsystem faster will result in higher CPU utilization, that’s a separate scope. |
| CPU Context Switch | 3 reasons:
|
| Hypervisor overhead | Reason is they are not used by the Guest OS. MKS, VMX, System. While it’s part of Demand, it’s not a demand coming from within the Guest. The VM CPU Used, Demand, Usage counter include system time at VM level, hence they are not appropriate. |
Inclusion
| Co-stop & Ready | The Guest OS actually wants to run. Had there been no blockage, the CPU would have been utilized. Adding/reducing CPU does not change the value of these waits, as this represents a bottleneck somewhere else. However, it does say that this is what the CPU needs, and we need to reflect that. We need not consider CPU Limit as it’s already accounted for. Guest OS number will be inaccurate because there is “no data”, due to its time being frozen. |
| Other Wait | Guest OS becomes idle as CPU is waiting for RAM or IO (disk or network). So this is the same case with Ready and Co-stop. |
| Swap Wait | |
| Overlap | The Guest OS actually wants to run, but it’s interrupted by the kernel. Note that this is already a part of CPU Run, so mathematically is not required if we use CPU Run counter. |
| Guest OS CPU Run Queue | This is the primary counter tracking if Windows or Linux is unable to cope with the demand. |
Formula
Based on all the above, the formula to size the Guest OS is:
Guest OS CPU Needed = Configured vCPU – Idle + CPU Run Queue factor
The result is in the number of vCPU. It is not in % or GHz. We are sizing the Guest OS, not the VM.
We’re including all the time the vCPU cannot run (Ready, Costop, Swap Wait, Other Wait) as the Guest OS would have wanted to run.
Guest OS CPU Run Queue metric needs some conversion before it can be used. Let’s take an example:
-
VM has 8 vCPU.
-
CPU Run Queue = 28 for the entire VM.
-
Using Run Queue = 3 as the threshold per vCPU, the VM has 24 queues before we add vCPU.
-
There is a shortage of 28 – 24 = 4 queues.
-
Each additional vCPU can handle 1 process + 3 queues.
-
Conclusion: we add 1 vCPU.
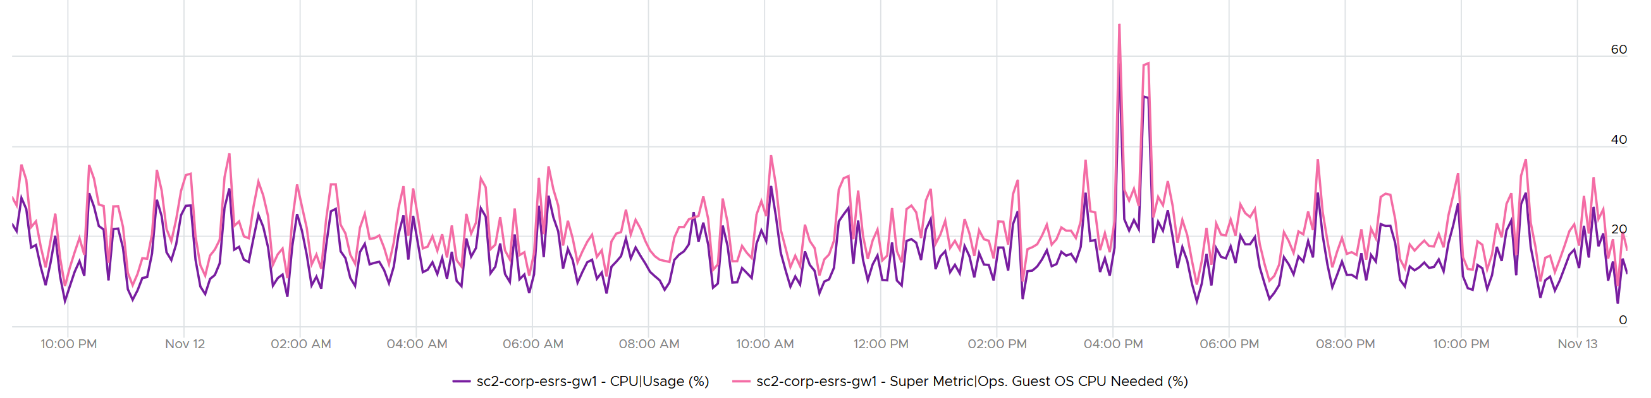
Compared with CPU Usage, Guest OS Needed without the CPU run queue factor tends to be within 10% difference. Usage is higher as it includes system time, and turbo boost. Usage would be lower in HT and CPU frequency clocked down case.
Here is an example where Usage is higher.
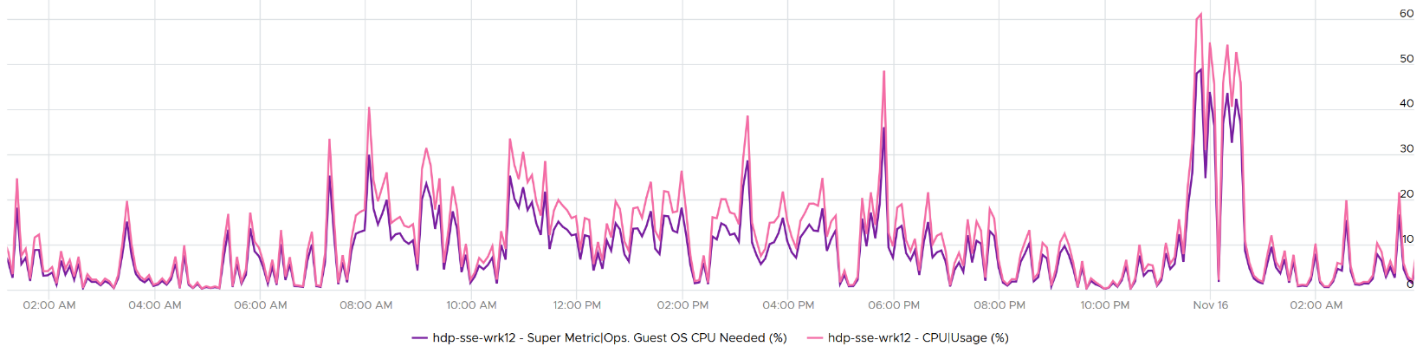
Here is an example where Usage is lower.
Once we know what the Guest OS needs, we can then calculate the recommended size. This is a projection, taking lots of value. Ideally, the recommendation is NUMA aware. It is applied after the sizing is determined. You size, then adjust to account for NUMA. This adjustment depends on the ESXi Host. So it can vary from cluster to cluster, if your vSphere clusters are not identical.
Guest OS Recommended Size (vCPU) = round up NUMA (projection (Guest OS Needed (vCPU))
For basic NUMA compliant, use 1 socket many cores until you exceed the socket boundary. That means you use 2 vCore 1 vSocket instead of 2 vSockets with 1 vCore each.
With the release of Windows 2008, switching the Hardware Abstraction Layer (HAL) was handled automatically by the OS, and with the release of 64-bit Windows, there is no concept of a separate HAL for uniprocessor and multi-processor machines. That means one vCPU is a valid configuration and you shouldn’t be making two vCPU as the minimum.
You should use the smallest NUMA node size across the entire cluster, if you have mixed ESXi with different NUMA node sizes in the cluster. For example, a 12-vCPU VM should be 2 socket x 6 cores and not 1 socket x 12 core as that fits better on both the dual socket 10 core and dual socket 12 core hosts. Take note that the amount of memory on the host and VM could change that recommendation, so this recommendation assumes memory is not a limiting factor in your scenario.
Notice the number is in vCPU, not GHz, not %. Reason is the adjustment is done at a whole vCPU. In fact in most case, it should be an even number, as odd numbers don’t work in NUMA when you cross the size of a CPU socket.
Note that when you change the VM configuration, application setting may need to change. This is especially on applications that manage its own memory (e.g. database and JVM), and schedule fixed number of threads.
You can enable Hot Add on VM, but take note of impact on NUMA.
Reference: rightsizing by Brandon Gordon.
Memory Sizing
Accuracy of Guest OS memory has been a debate for a long time in virtualization world. Take a look at the following utilization diagram. It has two bars, showing memory utilization of Windows/Linux. They use different set of thresholds.
Which one should you use for memory?
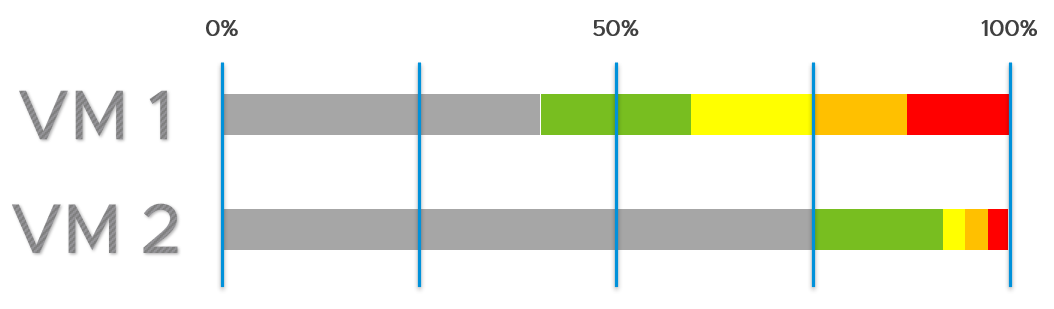
My recommendation is no 2.
The reason is memory is a form of cache. It stays even though it’s not actively used.
When you spend your money on infrastructure, you want to maximize its use, ideally at 100%. After all, you pay for the whole box. In the case of memory, it even makes sense to use the whole hardware as the very purpose of memory is just a cache for disk.
The green range is where you want the utilization to fall. Below the green threshold lies a grey zone, symbolizing wastage. The company is wasting money if the utilization falls below 50%. So what lies beneath the green zone is not an even greener zone; it is a wastage zone. On the other hand, higher than 75% opens the risk that performance may be impacted. Hence I put a yellow, orange and red threshold. The green zone is actually a relatively narrow band.
In general, applications tend to work on a portion of its Working Set at any given time. The process is not touching all its memory all the time. As a result, the rest becomes cache. This is why it’s fine to have active + cache beyond 95%. If your ESXi is showing 99%, do not panic. In fact, ESXi will wait until it touches 99.1% before it triggers ballooning process. Windows and Linux are doing this too. The modern-day OS is doing its job caching all those pages for you. So you want to keep the Free pages low.
| Include cache | Guest OS uses RAM as cache. If you size the OS based on what it actually uses, it will have neither cache nor free memory. It will start paging out to make room for Cache and Free, which can cause performance problems. As a result, the name of this proposed counter should not be called Demand as it contains more than unmet demand. It is what the OS needs to operate without heavy paging. Hence the counter name to use is Needed Memory, not Memory Demand. The challenge here is how much cache do you want to include? |
| Exclude page file | Including the pagefile will result in sizing that is too conservative as Windows and Linux already has cache even in their In Use counter. Guest OS uses virtual RAM and physical RAM together. They page-in proactively, prefetching pages when there is no real demand due to memory mapped files. This makes determining unmet demand impossible. A page vault does not distinguish between real need versus proactive need. |
| Exclude balloon | It results in more usage inside the Guest OS, if it comes from the free page. |
| Don’t fallback to VM metric | Since we are sizing the Guest OS, we use Guest OS only. No falling back to VM as it’s inaccurate. |
| Exclude latency | RAM contention measures latency, hence not applicable. We’re measuring the disk space, not latency. Space, not Speed. Utilization, not Performance. |
Unlike CPU, there are more difference between Windows and Linux when it comes to memory.
For VCF Operations specific implementation, review this post by Brandon Gordon.
VM Footprint
What rules to follow then sizing the footprint of the VM to the underlying SDDC?
CPU Sizing
| Include Hyper-Threading | When a VM runs on a thread that has a peer thread running, it’s getting less CPU cycle. |
| Include CPU Frequency | It impacts the footprint. For example, moving a VM to cluster with lower frequency may require more vCPU |
| Include contention | The VM actually wants to run, but blocked by hypervisor. This means Overlap needs to be added as Used does not include it. |
| Include VM overhead | They are not insignificant in cases such as Fault Tolerant. |
| Exclude Guest OS queue | It’s transparent to the VM |
Based on all the above, the formula to size the VM is:
VM CPU Needed = (Used + Overlap + Co-stop + Ready + Other Wait + Swap Wait) + System / 20000
You express in GHz (utilization model) and vCPU (allocation model).
The GHz is especially important when you need to migrate into another ESXi with different clock speed. To convert into GHz, we multiply the number by the nominal, static clock speed.
Enhance the sizing by considering CPU generation and speed. Take note this can introduce a new problem if not done properly. An application may perform poorly after the reduction in vCPU if it works better with many slow threads vs a few fast threads.
Memory Sizing
Since the goal is to calculate the total footprint, you need to include all the pages associated to the VM.
VM Memory Needed = Consumed + Overhead + Swapped + Compressed + Ballooned
The effect of Transparent Page Sharing should be included as that likely persist when you vMotion the VM. The challenge is it’s not possible to separate intra-VM sharing and inter-VM sharing.
Memory contention is not included as that measures speed, not space.
Chapter 7