SP5 Framework: Process
Day 0 & Day 1 are typically done by the Architecture team, and Day 2 is typically done by the day-to-day operations team. In large organisation, Day 1 could be different as there is enough workload for them to continuously upgrade. For example, if you have 6000 ESXi hosts, and you have a 5-year depreciation policy, you’re basically replacing 100 boxes per month. That means 25 hosts per week on average.
Troubleshooting is often wrongly elevated in importance or status, as if it’s a singular or major area of operations. It is not. What you can troubleshoot, and how you troubleshoot it, should be planned during system architecture phase. Another word, think of what can go wrong, how they can be detected, and the remediation action. If you do not plan the troubleshooting element of your architecture, each actual troubleshooting event will be more painful that it needs be.
Day 0
| Plan | This is where you set the goals. The goal should follow the SMART criteria. Make sure they are aligned with the business deliverable. For example, if you plan to build a private cloud, how do you measure success? What are the metrics, so you know how successful you are? |
|---|---|
| Size | A big chunk of planning is sizing the environment. Some companies perform stress tests and load tests, so they know what to expect when the real load occurs. Without planning and testing, you don’t know if the reality should be, as you do not have a measured goal. When you architect vSAN, how many milliseconds of disk latency did you have in mind? For example, you set the goal of 10 ms measured at VM level (not at the vSAN level and not at the individual virtual disk level) based on 5-minute average? |
Day 1
| Design | This is where you design, build the system, and launch the service. This includes configuring the various operations inputs such as cost drivers (e.g. application license costs, electricity rates). This is not part of the book as there are plenty of materials on it. Day 1 is generally closer to Day 0, as it’s the realization of your plan. |
|---|---|
| Build | Ideally this is automated to ensure what is designed is 100% identical to what is built. This includes deployment of the infrastructure, physical and virtual. |
| Test | Ensure what is built works as intended. For example, if you build a vSphere cluster, test that each ESXi host can recover from an HA event. |
| Upgrade | I do not consider them as part of Day 2. Upgrade varies from a simple patch to complete rearchitecting, where you are running the old and new system side by side. This type of upgrade is basically a migration, as you have the luxury of a new build. It also involves substantial planning, so you might have to circle back to Day 0. |
| Migrate |
Day 2
Day 2 is when the real challenge happens, as this is the stage you need to ensure critical workload is served well.
As a result, it includes proactive tests of the system resiliency and security. Monitoring is more than just checking. It’s about ensuring that the system is able to handle emergencies and remain secured.
Define your Standard Operating Procedures (SOP) to ensure knowledge is captured and lessons are learned. It’s also important to know “who does what when” to ensure gaps are covered. If your operations are partly or fully outsourced, ensure the vendor provides the documentation.
Having SOPs does not mean that you do not have ad-hoc tasks at all. You do, however, want to keep them minimum and so they are manageable.
| Deploy | This refers to the deployment of workloads, not infrastructure. Workload lifecyle management happens throughout the years, hence it’s considered Day 2. |
|---|---|
| Prove | You have redundancy (HA) and DR, right? How do you know they work if you never test them? A pair of core switches that have been left untouched for years may give you a surprise when there is an unplanned HA event. Once a year, test your HA to make sure they work. Annual reboots could be a good idea to clear cache and logs. As part of firmware, driver, OS, and VM Tools updates you may need to reboot anyway. Take advantage of this downtime by testing the resiliency of your infrastructure. Another area you need to test is security. Conduct independent penetration tests. |
| Monitor | These 2 will be elaborated as they form the bulk of Day 2 activities |
| Troubleshoot | |
| Optimize | As part of your monitoring, you may not discover a problem, but you spot an opportunity to make performance even better, reduce costs even further, and free up wastage in capacity. It’s common for new versions to deliver performance improvement. Again, you do this proactively, not waiting for complaints to happen. |
Monitor | Troubleshoot
Monitoring is What, while Troubleshooting is Why.
Monitor is where you compare Plan vs Actual. That’s why the goal must be clearly defined. Does the reality match what your architecture was supposed to deliver? If not, then you need to adjust your plan. That’s why Plan and Monitor form a circle.
For example, you plan to deploy VDI for 10K users. At 1K, you find out that the users are consuming more resources than plan. You either need to scale down your deployment or add more resources.
You do this when reality is worse than planned, or something is amiss, not when there is a complaint. You want to take time in troubleshooting, so it’s best done proactively. And quietly with no one rushing you for results.
| Monitoring | Troubleshooting | |
|---|---|---|
| Question answered | What is the problem? | Why does it happen? What is the actual cause of the problem? |
| Nature | Proactive. | Reactive. |
| Expertise | Low. A junior IT person is better suited, as it’s repetitive tasks with the aid of predefined dashboards and alerts. | High. Needs experienced IT Pro as there are wide variances on the steps taken. Also needs someone who understands the environment. |
| Metric | Generally, 1 metric. And this metric is also the SLA. This is the 1st metric you or your customer check. Primary metric. You check it proactively as part of your SOP. | Always many metrics. There are layers of metrics, one impacting another. Secondary metric. You only check if the primary is reaching threshold. |
| Duration | Should take just 5 minutes. | Can take days, with back-and-forth discussion amongst various teams. |
| Frequency | Performed daily. Gold Class will have higher frequency of regular monitoring than Bronze, as part of the SLA. | On demand. |
| Timeline | Now and Future. You consider future load and anticipate. | Now. Future is irrelevant. Your focus is to put out the fire or potential fire. |
| Logs | Not required. Metrics, properties, and Event suffice. | Almost always required. For network troubleshooting, you also need netflow data. |
| SLA | SLA is applicable in monitoring. | Yes. It becomes urgent if SLA is breached. |
| KPI | Use KPIs in monitoring instead of individual metrics. | Yes, but as a starting point. You then drill down into supporting metrics, which are often raw metrics. |
In most cases, monitoring is best done using a 5-minute interval, as 1 minute of bad metrics may not have business impact. Troubleshooting on the other hand may require per-second granularity. However, that does not always mean you need to see each and every counter if your remediation action is the same.
Health Check
When you monitor, what you check is the health of the system. Health Check is just another buzzword as it’s relatable to human health.
This is part of monitoring. There is no need to complicate with another jargon.
When you monitor the health, cover all 3 aspects of health:
| Present Health | Future Health | Better Health | |
|---|---|---|---|
| Focus | Illness | Illness (risk) | Fitness |
| Nature | Mostly Reactive. With KPI, you can do some proactive action for performance management. | Proactive. Alert is not a suitable UI or flow as there is intra-day urgency. | |
| Scope | Availability (Reactive) | Capacity | Cost |
| Performance (Proactive) | Configuration | ||
| Security (reactive part) | Security (proactive part) | ||
Frequency
How often should you monitor?
The answer depends on the types of information available:
-
For issue where there is no early warning, then no point wasting time doing proactive check as you won’t find any signs of degradation. You can only rely on alerts and be reactive. Availability is an area where the software or hardware typically go down without warning.
-
For issue where there is early warning, the frequency depends on the suddenness.
-
For situatiosn where the degradation is rapid, you may even need live streaming screen that is conveniently displayed 24/7.
-
For situations where the degradation is slow, such as capacity, once a week is enough.
-
Since daily fits well with business cycle, the overall performance is best checked daily, complemented with NOC screens and alerts.
-
For details of the health metrics, see the vSphere Metrics book.
Troubleshoot
There are many things that can go wrong, especially in production and on the eve before you take a vacation.
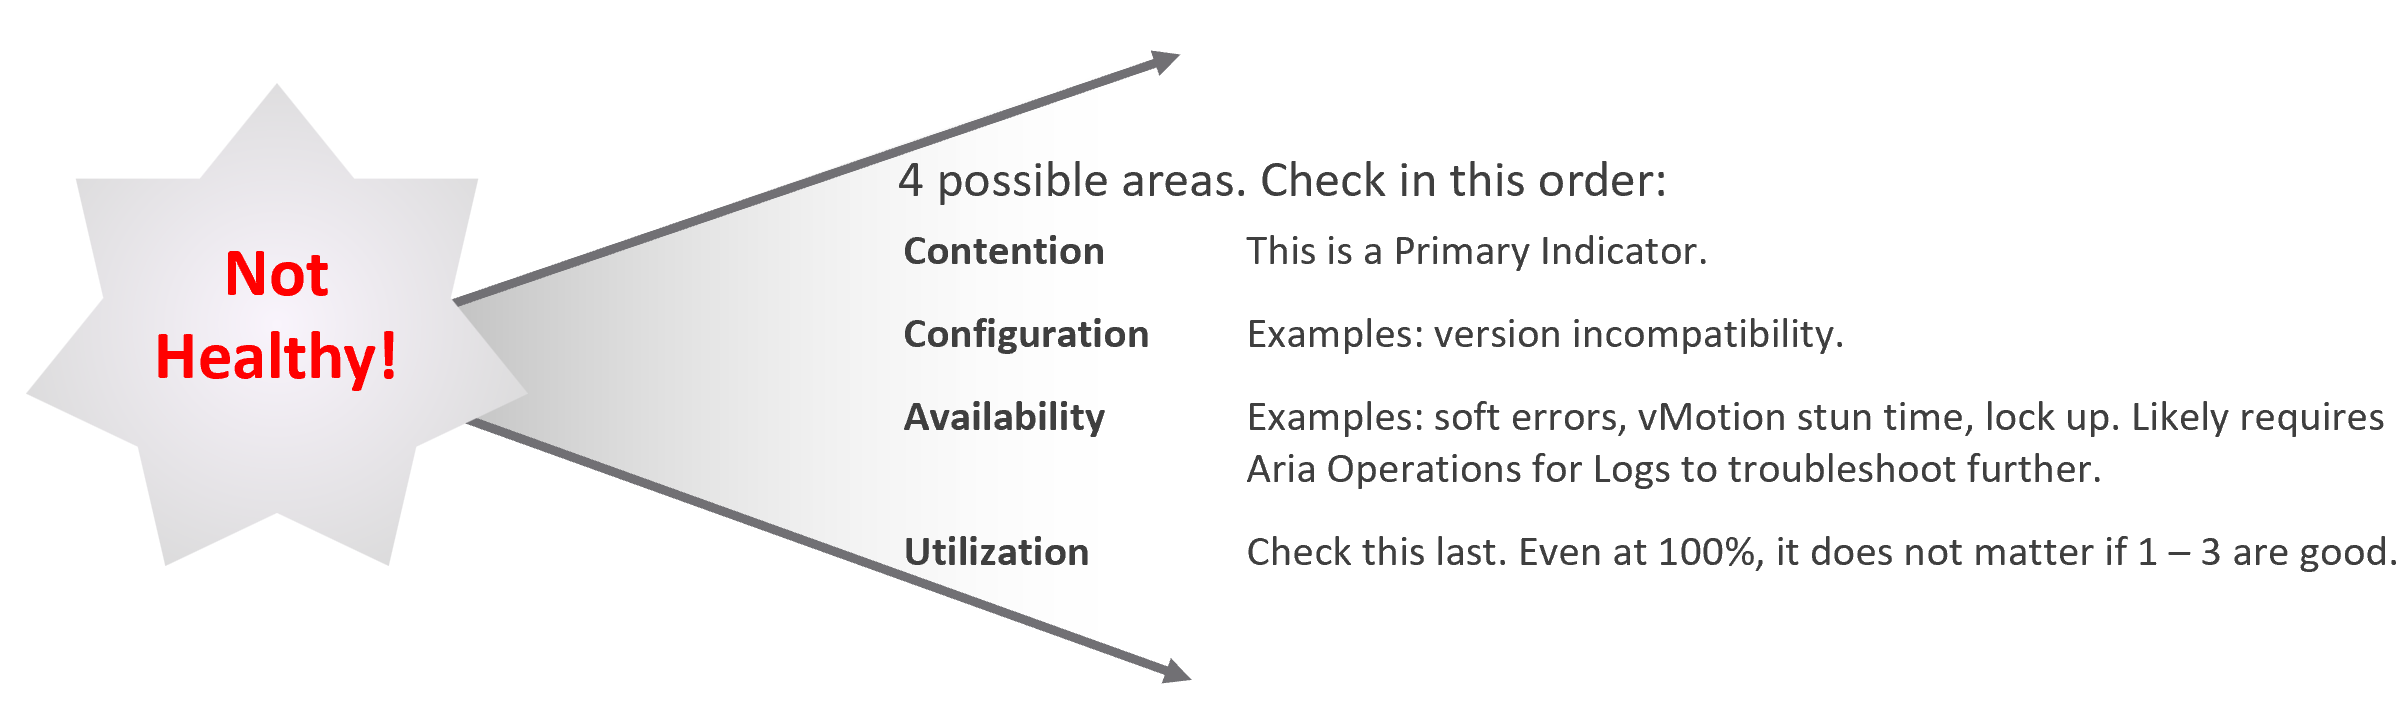
Troubleshooting requires expert team. The expert team is also the team setting up the thresholds used by the Level 1 team. Troubleshooting involves logs analyzis, as many systems do not generate complete metrics, and there can be many different causes behind a common problem. At the end, the actual root cause may not even be closely related to the problem. Troubleshooting is much more than simply “finding out” and goes beyond just gathering facts. It focuses on why, and then formulates a solution to prevent future incidents. Incidents mean something is dead, slow, or breached. You troubleshoot availability, performance, and security. Capacity and cost are not something you troubleshoot.
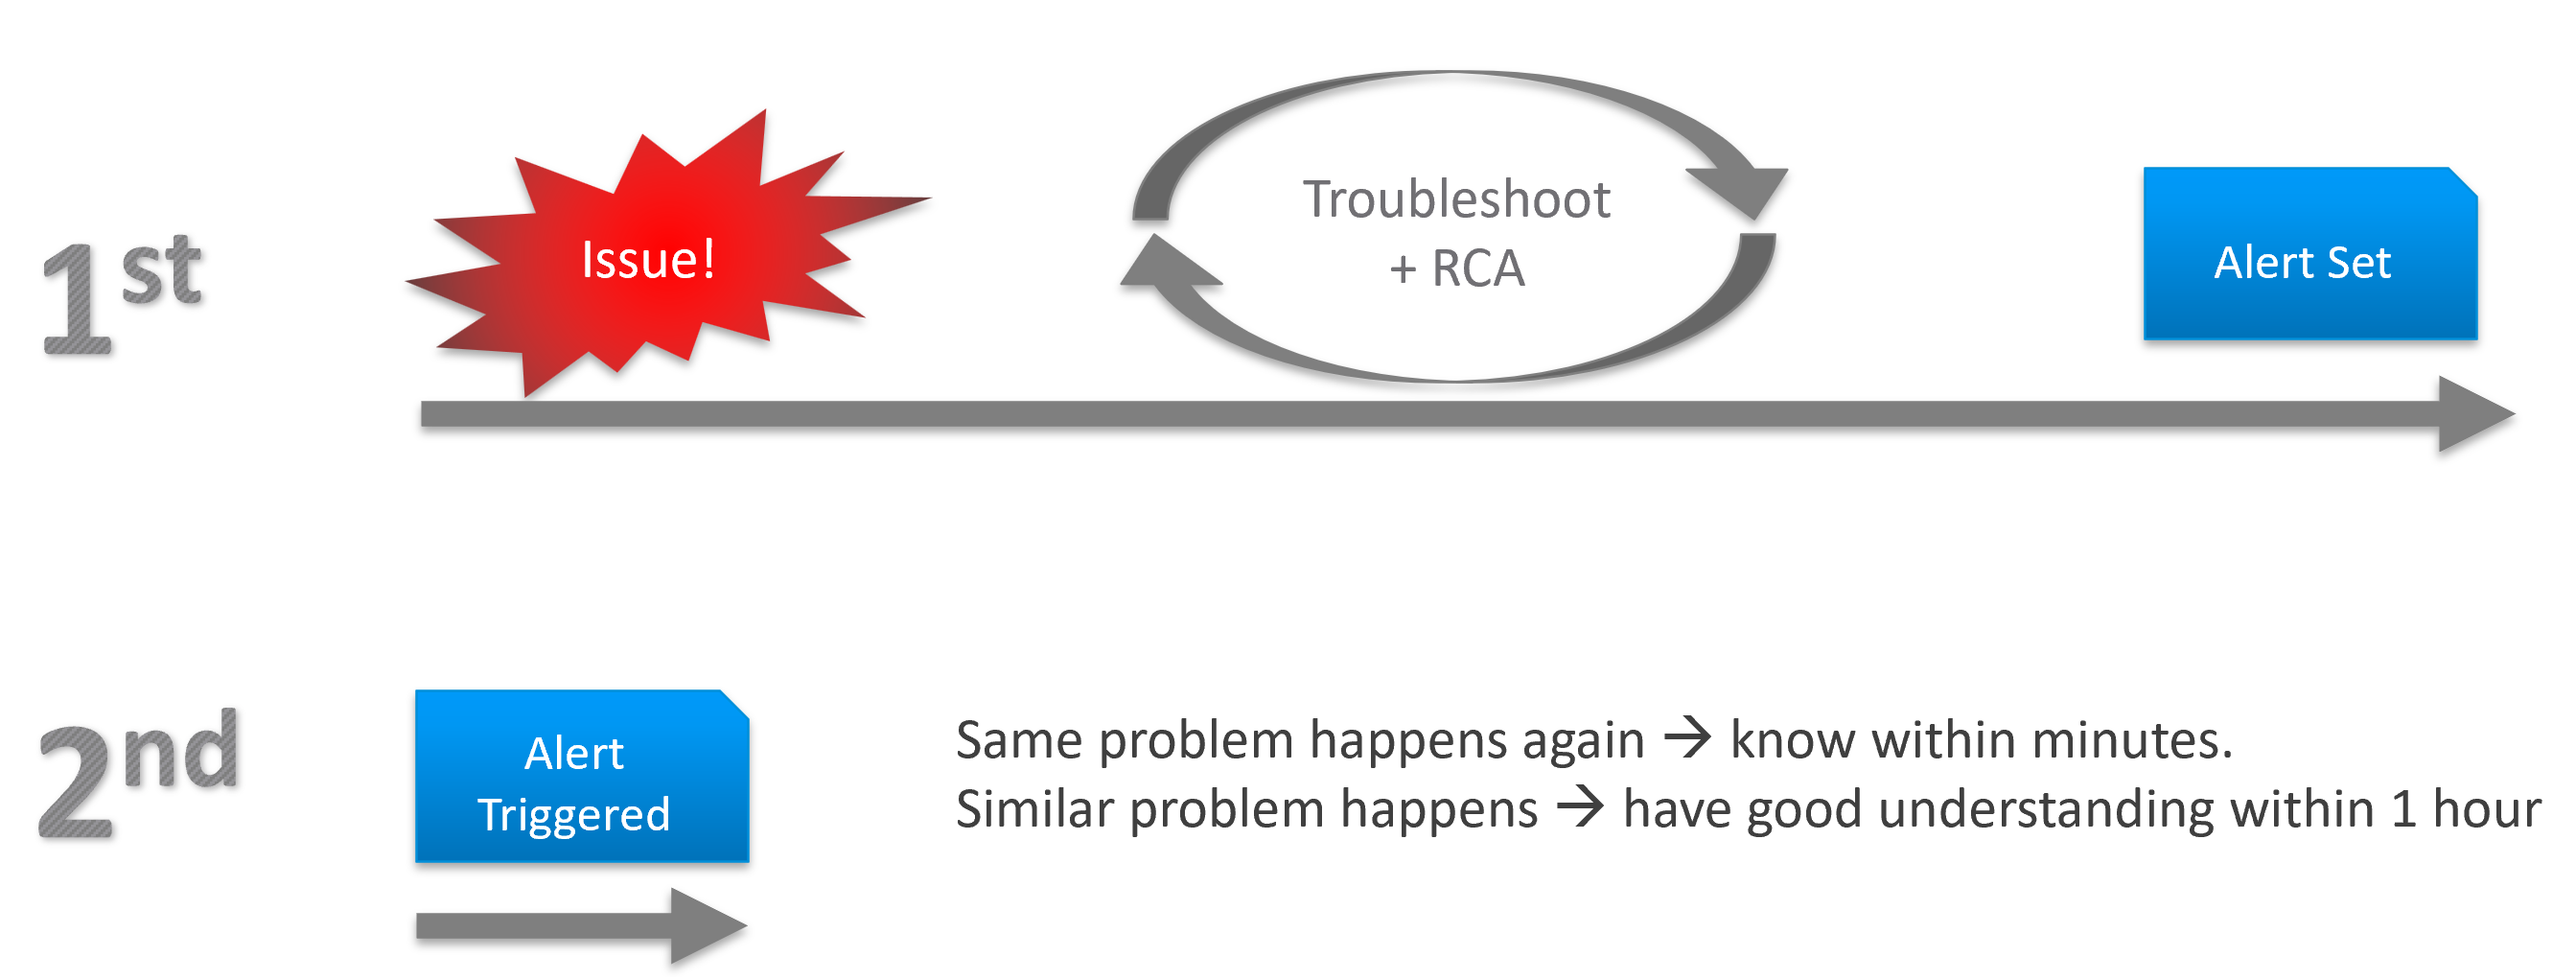
Due to its complex nature, the first time an incident happens is forgivable.
To codify troubleshooting, consider a layered approach. This makes it easier for the less technical teams. Classify your troubleshooting metrics, events and properties into two categories:
| Primary Metric | This defines performance. It is the What. This is always expressible as 0 – 100%, so it’s easier for the Level 1 team. It’s almost always a hybrid metric. Example: Kubernetes Cluster Performance (%) |
| Secondary Metrics | This provides some explanation to the primary metric. It is the Why. Aim for this to be expressible as 0 – 100%, so it’s easier for Level 1 team. Example: Highest ESXi Memory Consumed (%) in a Cluster. Metrics that can’t be color coded are harder for Level 1 teams, as the meaning depends on the context. Example: VM Disk IOPS |
Root Cause Analyzis
Root Cause Analyzis (RCA) is an important component of an optimized process for operations management.
The structure of an RCA report varies among customers, even if the issue they are troubleshooting is essentially the same. Regardless of structure, what do you think is the most important content in the report from an operations management perspective?
The most important content in the report should be the corrective actions to prevent recurrence, such as alerts that are configured to proactively highlight indicators of recurrence. Without these alerts, you cannot reliably detect the issue before it reoccurs and take corrective actions if required.
There is a good chance that the root cause is different than the symptoms. It may happen on a different object altogether and the error message could be seemingly unrelated. A root cause typically starts as a log message, meaning it has not bubbled up into the screen (UI) as formal alarm. When the vendor support team recommends you a specific log message to trap, how do you validate it is correct?
You need to ensure that the alert is valid. That means it should not result in false positive.
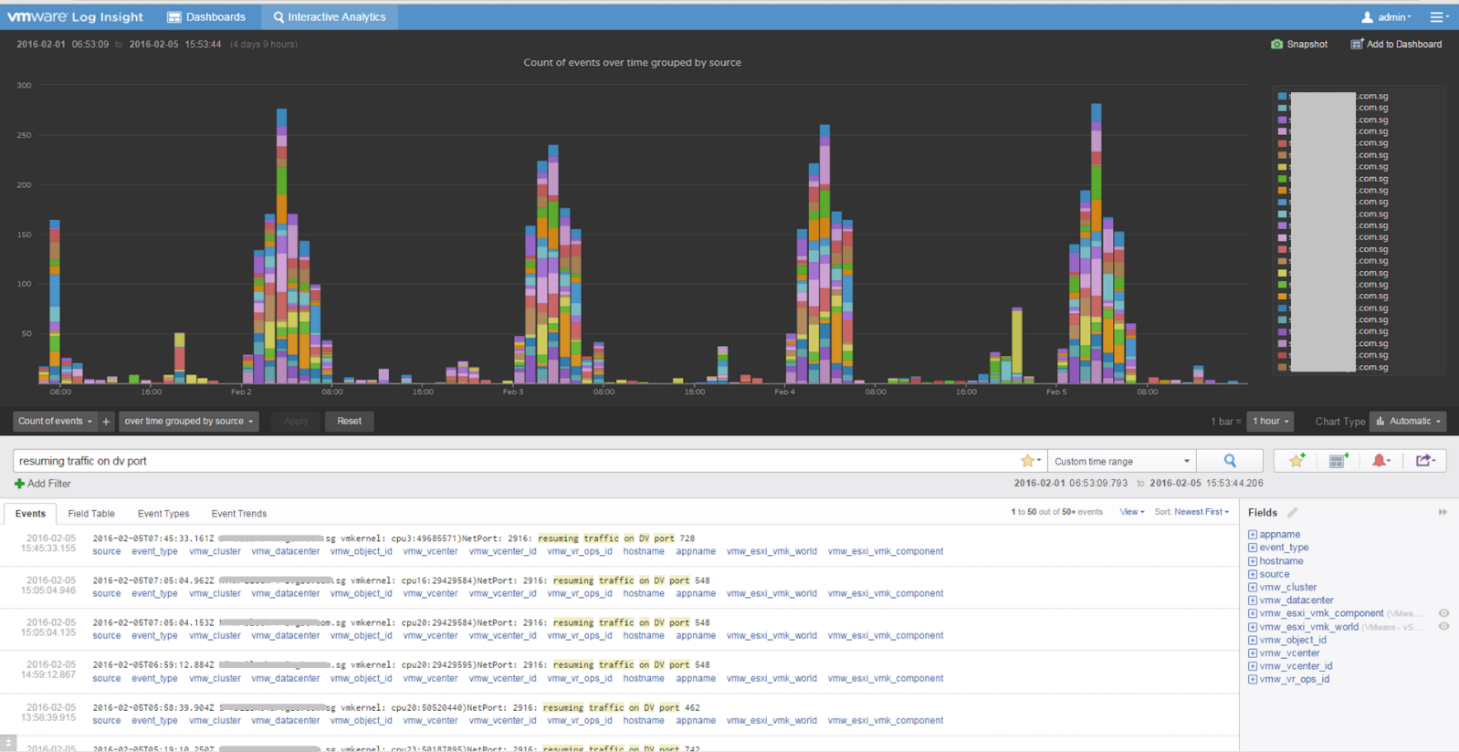
Let’s take an example. Take a VDI mass disconnect issue, where >100 users had their sessions disconnected at the same time. The analyzis concludes that the problem started with a log message (“resuming traffic on DV port”), so we need to trap this message when it appears again.
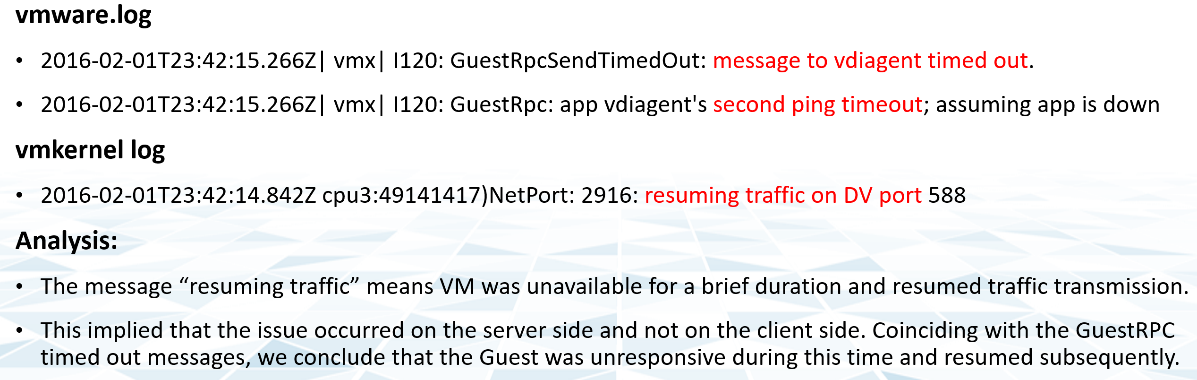
The first thing you need to do is validate the above alert. Using tools like VCF Operations for Logs, you cross check the message against your entire environment, especially the healthy (in this case, unaffected users). Ideally, you cross check for entire week, not just during the time the incident happened.
The following was the result when I cross checked against all the users in the last 5 working days. The log message has happened more than 1000 times, meaning that “resuming traffic on DV port” is not the message that I should base my alert on. There are too many of them and there is a clear pattern following office hours.
Optimize
The outcome of monitoring is not always troubleshooting. You may discover nothing to fix. However, that does not mean you discover nothing as you may discover the opportunity to improve.
Optimization delivers many practical benefits and real business results. Here are some of them:
| Lower Cost | Reclamation: Orphaned VMs, powered off VMs, Idle VMs, Oversized VMs, snapshots. Reduce DC footprint: Saves Software (MS, RedHat, VMW, etc.) and Hardware (server, storage, network) + Data Center (rack, space, cooling, UPS) Move burst capacity from Own to On-Demand. |
|---|---|
| Better Performance | Performance Profiling. Enable proactive monitoring via actual baselines. Establish Performance SLAs, complementing Availability SLAs. NOC Dashboards. Insight, then Alerts. Faster business service via self-service + approval workflows. |
| Lower Complexity | Standardize architecture. Simplify business policy or security policy. Standard Operating Procedures (SOP). Reduce human error via automation. Replace ageing hardware and upgrade outdated software. |
| Higher Customer Satisfaction | Internal IT department. Reputation among Applications Team. External SP. Repeat business. Ability to justify or defend pricing. Price/Performance. |
| Higher Compliance | Internal compliance with evolving, mandatory and/or optional security benchmarks, such as VMware security hardening guides, CIS, ISO, or FISMA baselines, or industry regulation such as DISA, PCI DSS, or HIPAA. |
I’m sure there are more of them. Drop me a note with your real-world stories!
Day to Day Operations
The daily discipline of who does what everyday matters.
-
The most important and the most basic is availability. If your system is down, you cannot have performance problem.
-
The next thing you ensure is performance. A system that is so slow is as good as down, perhaps to the point the hackers get tired of waiting 😊
-
Yes, security is number 3, not number 1 in the grand scheme of operations.
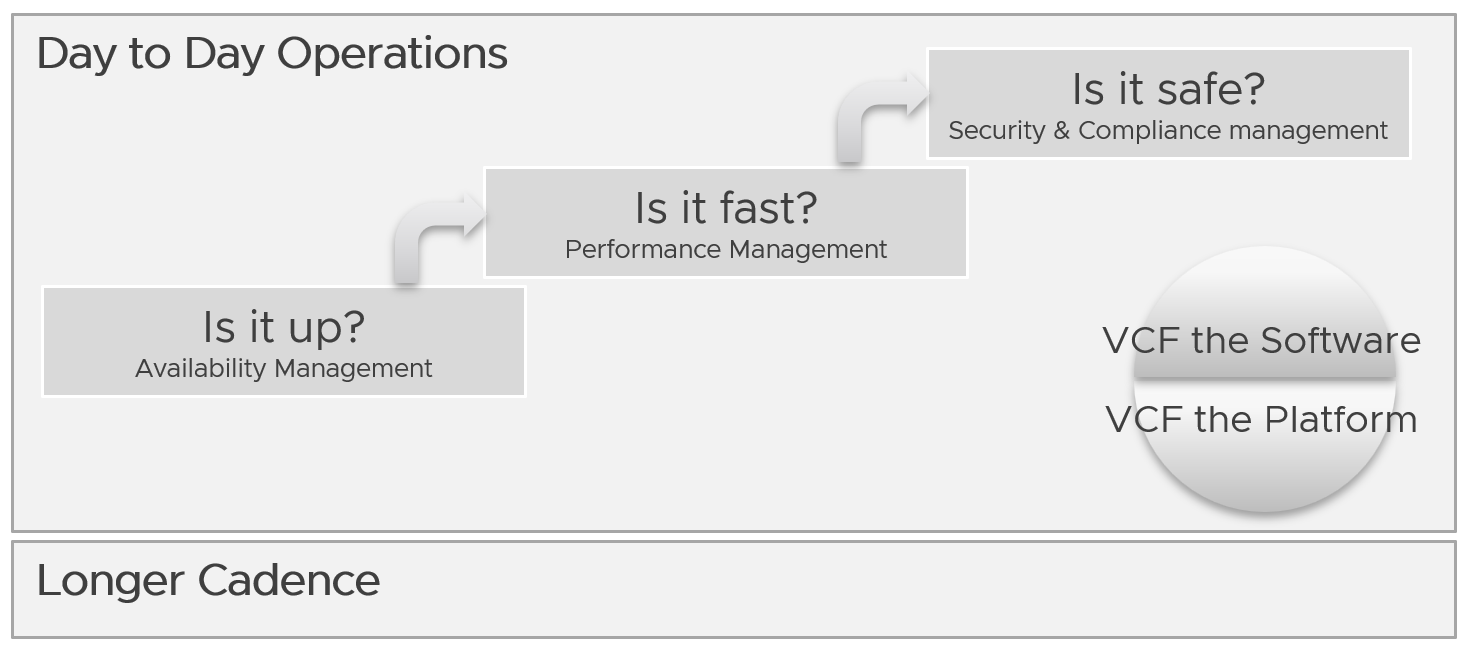
You assess the above on both “sides” of VCF, as they are intertwined. We covered this in earlier part of this book.
Day to day operations become more systematic when you distinguish between monitoring and troubleshooting.
Real Time
This is assisted with a set of live dashboards on the big screen in the NOC, showing real-time metrics and events. As the time duration is basically minutes, capacity is typically not relevant. You focus on availability, performance, and security.
The focus is to gain early warning, hence buying time if operations turn into an emergency. That means there is no alert triggered yet.
You want to put out fire fast.
| Availability | Focus on undesirable events. Make sure they match your expectations of what is actually happening in your environment at that time. For example, if you’re not deleting VMs and the live screen shows many VMs being deleted, something’s amiss. |
|----|----|
| Performance | Focus on overall performance and make sure the fluctuation is within your expectation. |
| Security | Focus on suspicious activity such as loosening of firewall rules or usage of administrator accounts. |
Daily
The daily SOP should look ahead, using the historical data and business context as a guide.
| Availability | Check for soft errors. This likely requires you to look at the logs from each hardware and software vendor. For example, vSphere has proactive HA. |
|---|---|
| Ensure backups are performed. For example, if you take a snapshot of 1549 VMs and only removed 1518, the backup likely failed to consolidate the snapshot. | |
| Performance | Insight analyzis. Look at the overall environment. Mission Critical VM Performance. Focus on looking forward to the next 1 day, by considering the pattern over the last 1 week. Know the expected workload, by working closely with the business owner. |
| Compliance | Ensure non-compliance is remediated. |
| Security | Check for potential security attacks, such as loosening of firewall rules and usage of administrator accounts. |
| Configuration | Check for misconfiguration that can cause issues. |
| Implement urgent patches, after appropriate validation | |
| Capacity | VM provisioning. Ideally this is automated, so it happens throughout the day. In this way, your developers need not wait for the end of the day. What you need to ensure is the aggregate load does not overwhelm the shared environment. |
Snapshot deletion. Set up a policy to delete snapshot older than say 3 days. You do not want to wait until 1 week. Ensure the exclusion is properly implemented, so you do not delete from VM whose snapshot you’ve agreed to keep. | |
| Powered-off VM deletion. Once a VM passes the powered-off definition, there is no need to wait for another week before you delete them. You do have backups, don’t you? | |
| Powering off Idle VMs. Once a VM passes the idle definition, there is no need to wait for another week before you gracefully shut the OS down. |
Longer Cadence
Let’s review some examples of SOPs that you should have.
Weekly
Weekly or longer is suitable for different types of tasks. As you have more time and are working on longer time horizon, you should look at both the big picture and look ahead.
The end of the week is a good time to document the changes and lesson learned from the week, and plan ahead for the next week.
| Capacity | Capacity monitoring and planning. Check actual growth vs projection (plan). |
|---|---|
| Reclamation Process. VM rightsizing, Idle VM, etc. This can be done weekly as you need to deal with the VM owners. | |
| Compliance | Root cause for non-compliance is documented, and preventive measurement is put in place so it does not happen again. |
| Configuration | Minor updates. For example, from vSphere 7.0 U1 to U2. This is typically part of standard IT tech stack hygiene, where you keep up with the update from all your vendors while making sure they are compatible. This protects you from security non-compliant and emergency patching during business hours. Review does not mean immediate implementation. For example, there is a newer version of VMware Tools. You may decide to start implementation in 2 months, as you have 15K VM and you need to prioritize and batch them. |
| Major upgrade. For example, from vSphere 6.5 to 8.0. This is typically a one-off project, as opposed to regular maintenance. The implementation is typically executed within a green zone, so other regular maintenance may be deferred to make space. | |
| Overall | Weekly Management Report. Focus on reviewing the operations of the week, and plan for next week. |
| Review of ad-hoc events. What are the lessons learned, and can they be turned into an SOP and alerts set up? |
Monthly
The month serve as logical time period as human and business relate well with calendar months. There are different activities at the end of the month or the start of the month.
| Availability | Restore test of backup. Make sure it can be restored and the data is readable. |
|----|----|
| Configuration | Less urgent update. Review new versions and ensure you do not fall too far behind. |
Longer Cadence
You complement the above frequent SOPs with a regular cadence with a longer time horizon. Naturally, the focus is on the big picture, major projects, and strategy.
| Quarterly | Overall | Quarterly Management Report. Focus on longer term items such budgeting. |
|---|---|---|
| Cost | Budgeting. Review actual versus plan. | |
| Availability | DR Test (Production is still running). Isolate the network. To ensure users are comfortable with the procedure when actual DR strikes. | |
| Half-yearly | Availability | HA Test. Actual test that your HA works as intended. Covers vSphere, physical switches, storage array, etc. |
| Yearly | Availability | Actual DR Failover (Production not running) and Failback to primary DC |
| Capacity | Inventory Stock Take. To discover unused VMs and physical items in data center | |
| Ad-hoc | Capacity | Unexpected demand. This is why it’s important for capacity teams to stay close with the business, especially the ones working on major initiatives. |
VM Life Cycle
This should be supported with an approval system, so all Change Requests and associated actions are properly recorded. This eliminates finger-pointing in the future. It will also support audit: who is keen on “who did what change to which object on when”?
| Stage | Notes |
|---|---|
| Request | If a VM is free (price is basically $0), then rely on business justification and IT policy. Policy states the criteria for the different class of services. VM size is requested by the application team, approved by their management. For size or quantity above certain thresholds, IT should review. |
| Creation | The actual deployment of the VM in vCenter. This is ideally automated. This stage generates the actual VM name, create folders if necessary, and places the VM into the correct folder. Once the VM object is registered in VCF Operations, create the custom group is necessary, and set the custom property. |
| Changes | Changes in VM size need to be approved as it impacts capacity and performance. If you have to use shares and reservation, ensure they are updated accordingly. |
| Retire | Delete the VM and remove it from inventory. |