Service Level Agreement
The difference between an enterprise grade Cloud and non-enterprise grade Cloud is the SLA. A cloud provider can state that they have the best technology, the most experienced professionals, the most innovative process, industry certifications, blah blah blah to prove that they are the best. All that will not carry weight if they are afraid to back it up with the SLA in their contract. The SLA enables customers to hold the cloud provider accountable as it carries a financial penalty.
Once the SLA is defined, then customers want to know how it will be delivered. This is where the process, architecture, certification etc. come in. The what always comes before the how.
With that, let’s define “SLA”.
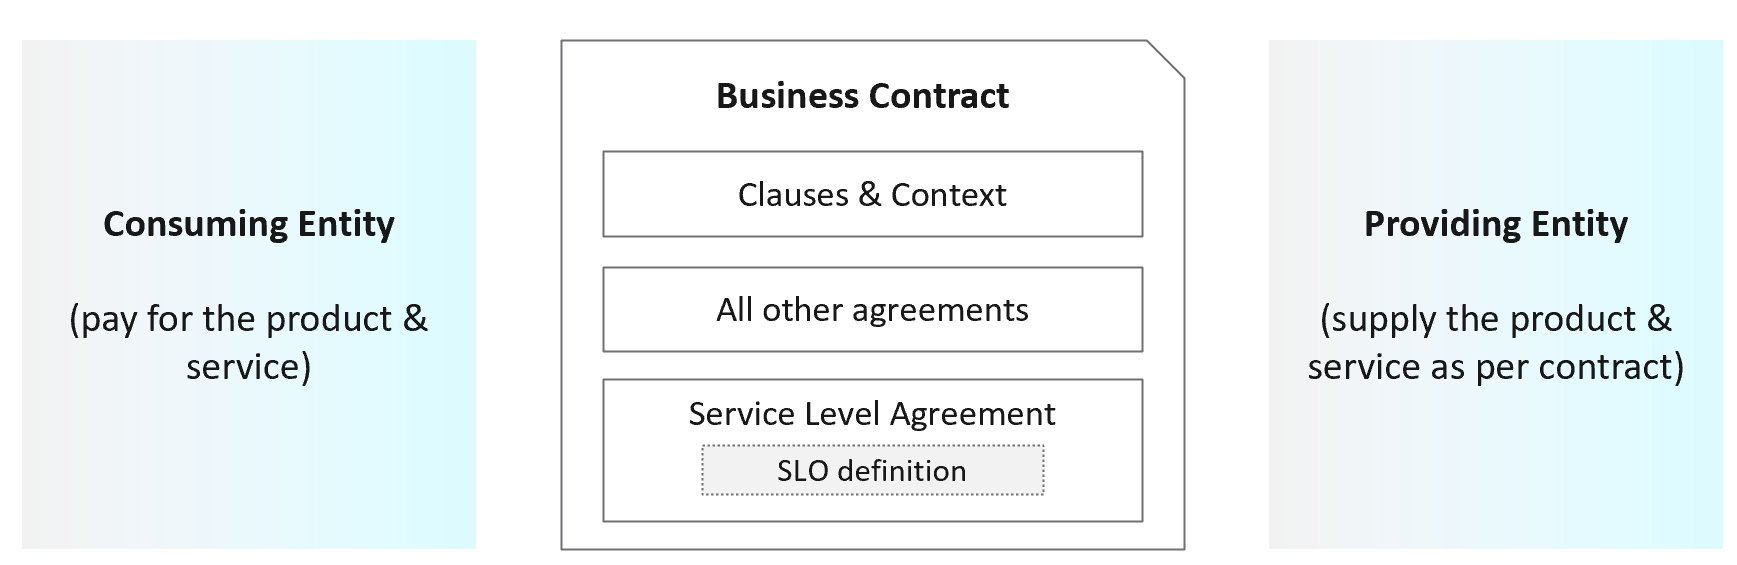
First, it is just a component of a business contract. The business contract is a legally binding document which has many other clauses outside the SLA section. The contract first needs to set the context and definition. After that, it has a set of agreements, with SLA being one of them. Examples of other agreements include confidentiality agreements, terms of payment, non-competitive agreements, and marketing agreements.
The SLA section has actual metrics that define the SLA. Google calls this SLO. It works for them as they do not have SLA (to you as their customers). As enterprise IT, you have SLA to your tenants. SLO creates confusion as it sounds like a peer to SLA, when it’s just a goal. I’m not using SLO, as SLA and SLI are sufficient in practice. For SLI, a better explanation is SLA Leading Indicator, not Service Level Indicator. It’s a leading indicator as it tells you in advance the chance of you meeting SLA or not at the end of the month. SLI is not a peer to SLA.
Guess how many SLAs do you need?
It depends on the type of services. Most service providers will only commit to the simplest and most obvious one, which is availability. It’s the simplest as it’s binary. The darn thing is either up or down. Google only covers availability in their SLA post here, which is based on Google Cloud’s SLA. AWS only cover their infrastructure, and not your EC2 VM. I have read this and many other articles. While it makes sense for Google business, it’s not suitable for IaaS. Happy to discuss my documented analyzis.
Just because something is up, does not mean it is fast. In fact, a service that is slow to the point it’s unusable is as good as down.
Just because something is fast, does not mean it’s secured. This is why a Security SLA is necessary.
The 4 SLAs of IaaS
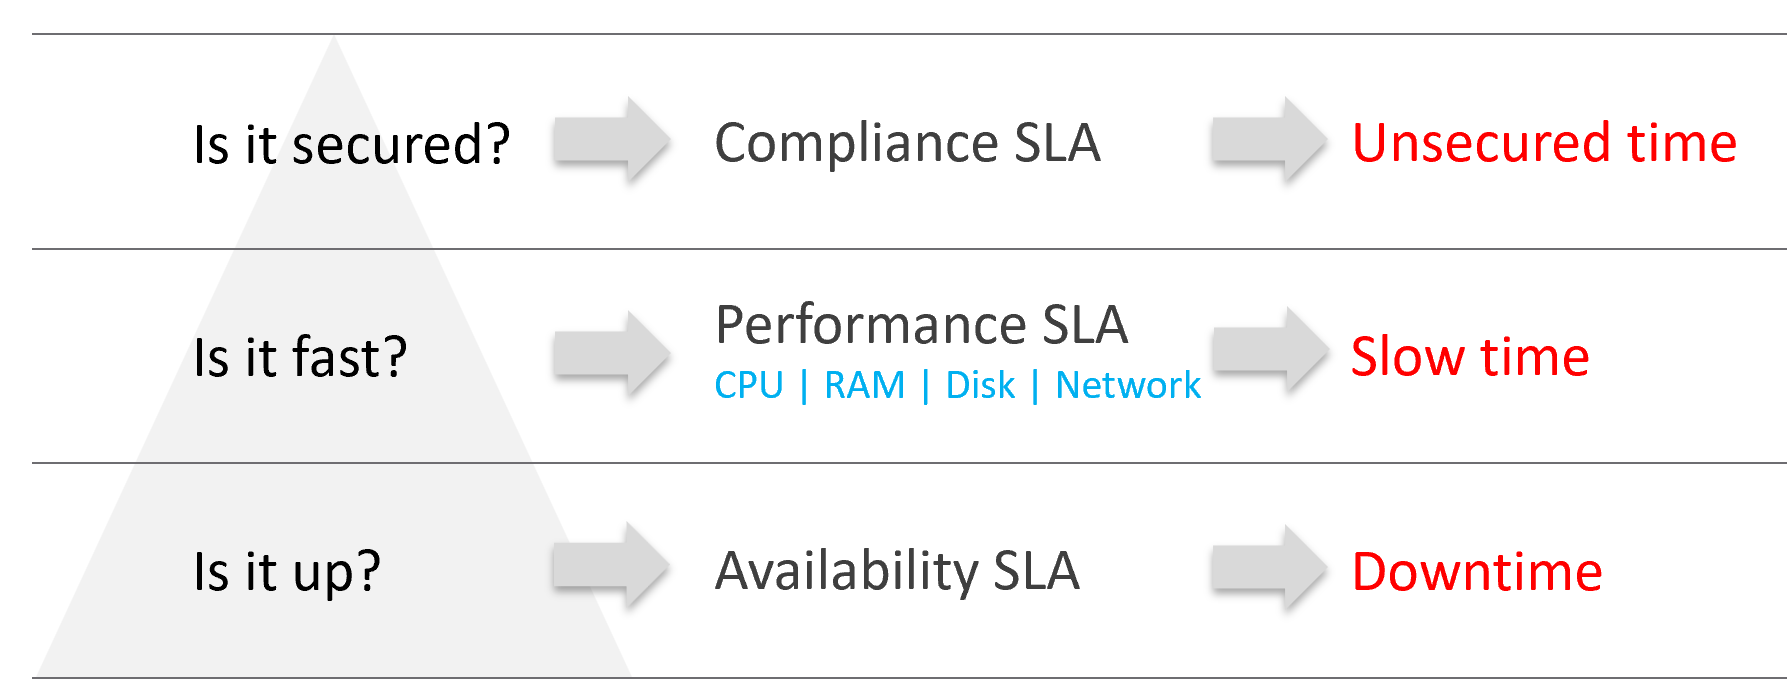
The business of IaaS should provide four SLAs, as customers want complete coverage. These four are focused on Availability, Performance, Compliance, and Service. Below is a diagram showing the first three: what they do, and what they measure.
Wait, why am I not showing the 4th one?
Because it plays a secondary role. The first 3 covers the actual workload, while the 4th one covers the human (typically tenant or application team).
| Availability | This is the most basic SLA. It is the oldest and most well-known. In reality, it is largely a given. It does not matter what the agreed number is. If the darn thing is down, you better hurry to bring it up before there is a complaint or things get worse! |
|---|---|
| Performance | The Performance SLA is far more valuable than Availability SLA. It is the solution to complaint-based operations by defining what exactly is “fast”. In IaaS, it covers CPU, Memory, Disk and Network, hence there are four metrics used. |
| Compliance | Also called Security SLA as the goal is secured environment. This is hardly talked about, as customers and providers expect this to be 100%. This is why you need to provide an SLA, as promising 100% will lead to disappointment. It measures the security compliance to industry regulation or certification. |
| Service | Service provided by both human and system (typically in the form of self-service portal) |
In the Availability SLA, you measure downtime. In the Performance SLA, you measure ”slow time”. In the Compliance SLA, you measure unsecured time. Regardless, you measure something and express it in 0 – 100%, with 100% being perfect relative to the contract.
VM vs Guest OS
VM and Guest OS are 2 separate objects but they are 1 logical entity due to 1:1 permanent relationship. It is common for IaaS provider to cover both.
If your responsibility includes the Guest OS, then your SLA needs to include Windows or Linux.
| Type of SLA | Virtual Machine | Guest OS |
|---|---|---|
| Availability | VM is powered on. BIOS is up and running. A VM is basically a virtual motherboard. Windows and Linux are not part of SLA. | Windows or Linux is up and running. This may include basic services such as security agents. Application is not part of SLA |
| Performance | VM is getting the CPU, memory, disk, and network resources it demands | Windows or Linux performance counters are within expectation. |
| Security | VM is protected as per vSphere hardening guide or industry regulation. | Windows or Linux is protected as per respective vendor or industry regulation. |
In this book, I assume your IaaS offering includes Guest OS. However, the metrics for Windows and Linux are not yet complete due to the lack of maturity of their performance modelling.
Availability SLA
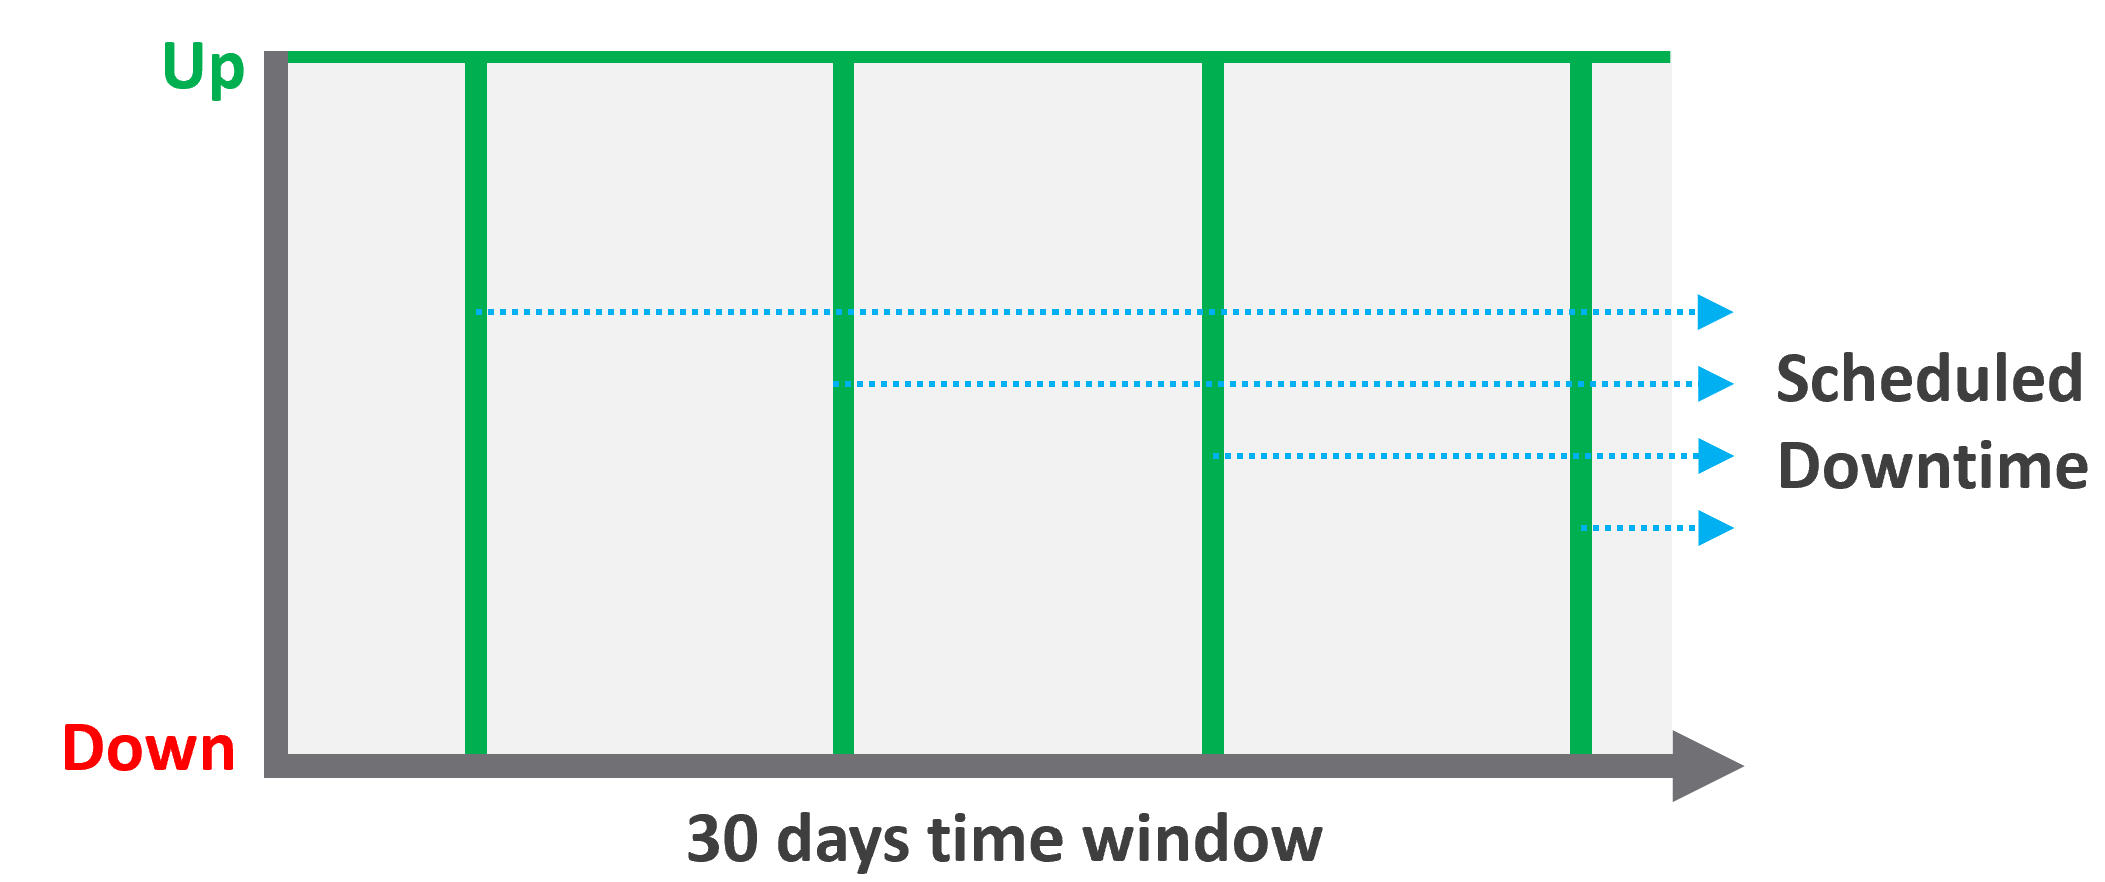
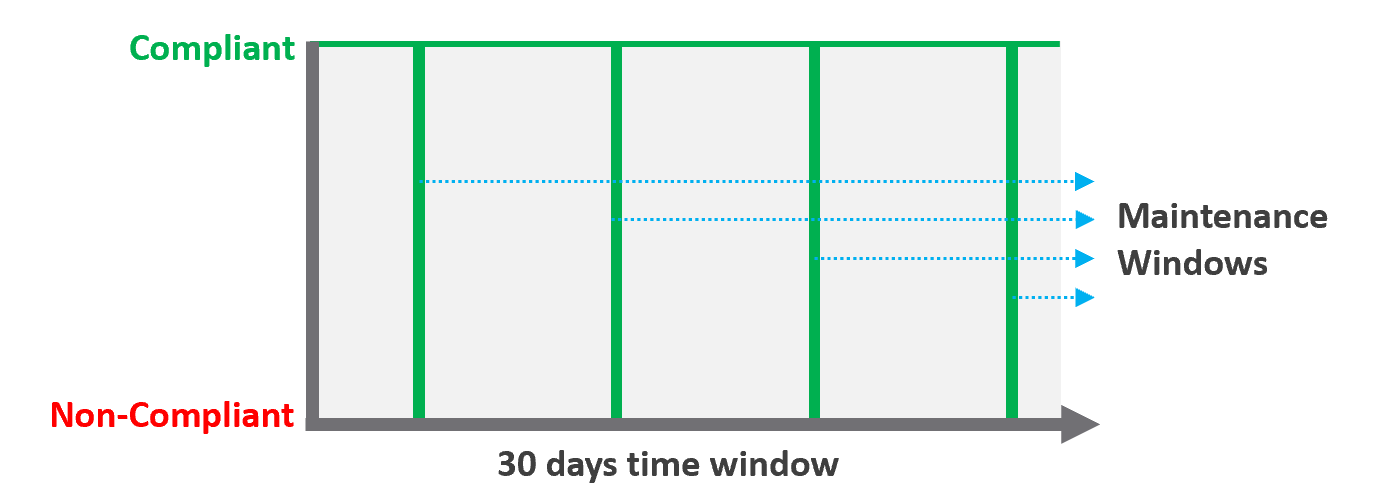
Many vendors claim a very high availability SLA. This is misleading as they do not include scheduled downtime. This unique saving grace lets you state you’re 99.999% available even though the actual reality, experienced by end customer, is lower. This is why you need 2 metrics:
-
One for availability as defined in the SLA.
-
One for actual availability. It reflects reality.
The 2 metrics names are:
-
Actual Availability (%).\
This is much easier to measure as it does not consider context. Down is down, regardless of when, who and why.
-
Operational Availability (%)\
This is harder to measure.
Example:
-
All VMs has weekly scheduled downtime to apply urgent security patch. It’s every Sunday 0000 – 0200 hours.
-
Last month, the database server was brought down for patching 3 times. But all happened within the scheduled downtime. While Windows was only shutdown for 15 minutes, the large database took 45 minutes to fully restore.
-
In this case, the Operational Availability (%) for the month of June is 100%. It meets SLA.
-
The Actual Availability (%) accounts for the 3 hours of total downtime.\
It’s 3x of (15 minutes + 45 minutes).\
In the month of June, there are 24 hours x 30 days = 720 hours.\
Actual Availability (%) = 717 / 720 = 99.58%
Formula
| Definition | Defined as Guest OS is pingable, because running but isolated fails the availability test. The Ping Source is predefined and set by the IaaS provider, not the customer. It pings the VM, not a specific process (e.g. web server. This is IaaS, not web server as a service.). |
|---|---|
| The uptime only covers the Guest OS. If it takes the application 15 minutes to become fully operational as it has to load files and other services, that’s not counted. | |
| Inclusion | If the crash is caused by VMware Tools or IT Infrastructure owned drivers/agents, then it’s counted. |
| Exclusion | Unscheduled downtime caused by customers. If the crash is caused by bad applications behaviors, the SLA is not affected as that’s not within the control of IaaS provider. As it takes time to figure out what caused the downtime, you need to be able to recalculate the metric. |
| VM owner-initiated reboots as they might reboot their OS to solve problems or after installing software. How to track as developer may not inform the IaaS team, as Windows does not fully trap this event? | |
| Scheduled downtime. Guest OS upgrades, patches that requires reboot, Tools upgrade, VM Hardware version are not counted if you execute within the agreed scheduled downtime. | |
| Complication | A challenge that impacts availability but not performance is recovery time. Windows or Linux maybe up in 1 minute, but it needs to perform fsck (filesystem consistency check) before application can launch. This is considered as part of downtime. |
Supporting Techniques
You need to back up your promises with solutions that are convincing for customers. Here are some solutions that you may offer to justify and support the higher availability SLA.
| Backup | Gold Tier provides application-level back up. It also provides more frequent full back up, and customers are provided with self-service individual file restore. | |
|---|---|---|
| High Availability | Gold Tier provides application-level monitoring. Customers can also ask for specific boot-up sequence of their VMs, and ask for VM-Host affinity rules to minimize risk. | |
| Disaster Recovery | Gold Tier provides lower RPO and RTO. Customers are also entitled to annual real-world tests, where the production workload is run from the DR site. | |
| Snapshot | Gold Tier provides longer snapshots and larger snapshots. | |
| OS Management | Gold Tier provides flexibility in patching. Customers can specify delay in patching and request custom patch packages, where not all patches from Microsoft or Red Hat is applied. | |
| VM Management | Gold Tier provides flexibility in updating Tools and VM Hardware. Customers are allowed to defer the updates. | |
Performance SLA
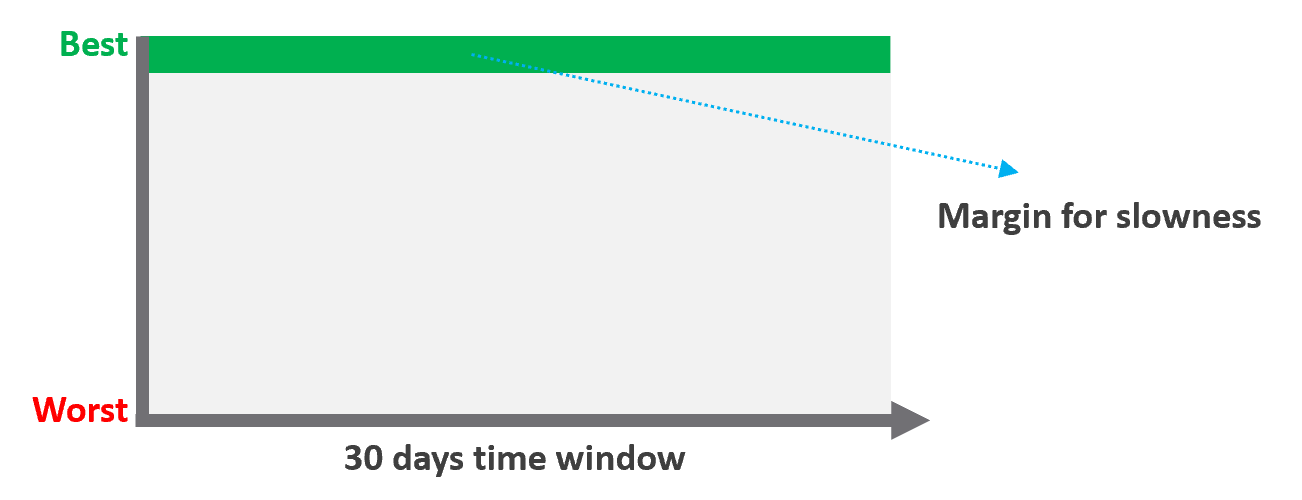
Unlike availability, which has the luxury of scheduled downtime, there is no such thing as scheduled “slow time” with performance. You can’t say that you’re doing infrastructure upgrades and use that as excuse for why VM performance will be slow. As a result, you need to put your margin or buffer somewhere else.
Slow is not binary. It’s a spectrum from 0 contention to absolute worst (as good as dead). Some metrics such as disk latency can never be 0. It will be a small number, but it’s not 0. The same goes with the value of the CPU Ready metric. So, we need to define a threshold above 0.
| Definition | All are measured at VM level, not individual vCPU or vDisk. For disk, it’s also the average of Read & Write. All are averaged over 300 seconds, which is an appropriate balance for SLA monitoring. An SLA that is based on a 1-minute average will be too tight and result in either a cost increase or a reduction in threshold. |
|---|---|
| Inclusion | 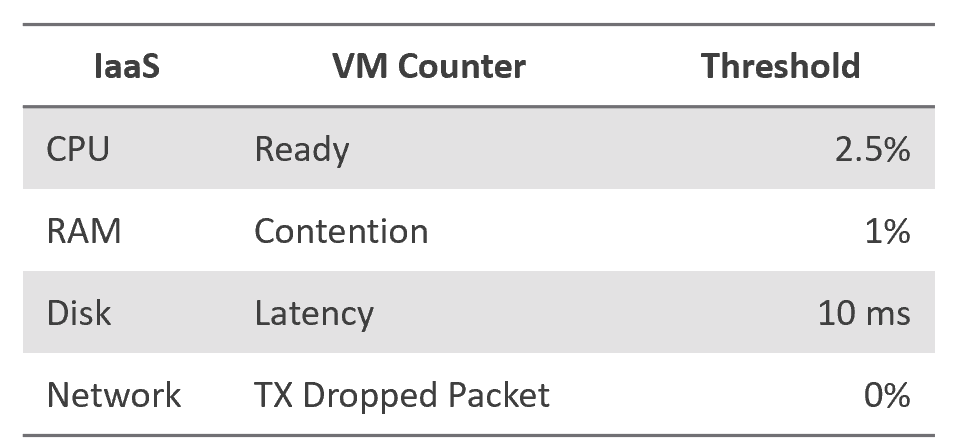 |
| Exclusion | Received Packet Dropped. It’s not reliable enough to be used in the SLA contract due to false positives. A packet could be dropped as it’s not for the VM. More details in the Network metric chapter. |
| Other forms of contention, such as CPU Overlap, CPU Other Wait, and vMotion. They are too granular for the purpose of a contract. You track them via KPIs instead. |
Why should you only use CPU Ready and exclude CPU Co-Stop and CPU Contention from the Performance SLA?
It took me years to vrealize the mistake.
You should exclude CPU Contention because its value can go as high as 37.5% without the application noticing any degradation. You can login to Windows or Linux and feel that it’s responsive.
Use the above threshold as they are. There are two main reasons:
-
Major changes in the value, such as changing CPU Ready from 2.5% to 5%, will require you to adjust your “nines” to a higher number. This requires you to profile your environment first.
-
A common value in the industry will also enable you to compare with your peers and get an industry-acceptable numbers. You can then compare how well you serve your mission critical VMs, your Test/Development VMs, etc.
Just like in Availability, there are extra things you can do to give confidence to your customers. For example:
- Gold Tier provides priority on the network. Customers can opt for a periodic ping service to ensure network latency between their applications remain within the agreed threshold.
Compliance SLA
| Definition | Percentage of compliance against an agreed security policy or benchmark. A compliance SLA differs from an Availability or Performance SLA in one key area: the compliance SLA should promise perfect compliance. Compliance is binary: you are either compliant or you aren’t. You shouldn’t be telling your customers that you will have less than perfect compliance with your own security requirements. It has a window, typically ad-hoc, to enable investigation or maintenance which may result in temporarily becoming non-compliant against your compliance benchmark. Compliance calculation is purely from Infrastructure Team point of view. |
|---|---|
| Inclusion | Internal security standards, typically an adaptation of VMware best practices or the VMware Security Hardening Guides. Regulatory benchmarks, e.g. CIS, ISO, DISA, FISMA, PCI DSS, HIPAA. For the vSphere infrastructure, compliance with these benchmarks (and custom ones) can be directly managed through the compliance features of VCF Operations. |
| A VM compliance must consider its immediate surrounding. If the parent ESXi, the vSAN storage, and the distributed network and storage is not secured, the score need to reflect it. | |
| Exclusion | This depends on the definition of your IaaS Service. You are only providing SLAs for what you control. |
If you provide the guest VM OS as part of your IaaS service, then you will need to maintain compliance by managing configuration (using something like Group Policy and/or a configuration management tool) and you will also most likely have some security tools and agents that run inside each VM. When the guest OS is part of the service, you should be measuring availability by whether the guest OS is running (e.g. via ICMP ping). If you do not provide the guest OS as part of the IaaS service, then you do not need to worry about maintaining compliance in the guest OS, and you are also measuring availability by whether the VM is powered on. |
Service SLA
IaaS is built on commodity hardware and provided as a utility. Having said that, there are many ways to differentiate your service vs your competitors. Use class of service to distinguish premium service classes. The following table lists some examples.
| Provisioning Time | In environment where the churn is high, the time taken to provision become important. You need to clearly define what “provisioned” means, as it can range from bare Windows or Linux to completely set up and configured with applications & database loaded. |
|---|---|
| Provisioning Success | Provisioning a complex set of multi-tier business applications with many VMs and many external integrations or endpoints may fail from time to time. If this is relevant to your environment, then add it as part of the SLA so you can focus on the higher class of service. |
| Support | Gold Tier customers will be alerted over email and messaging network within 10 minutes. |
The two popular examples are response time and path to escalation. Do not promise resolution time unless it’s completely within your control. Gold Tier provides faster response time and longer coverage hours (e.g. 24 x 7 x 365). Your ticket is also directly answered by Level 3, bypassing the front liners. | |
| Gold Tier comes with regular business reviews, attended by your management. | |
| TAM | Gold Tier comes with a Technical Account Manager, acting as single point of contact for customers. The TAM is also the internal champion, representing customer interests within the vendor internal world. |
| Monitoring | Gold Tier VMs will be proactively monitored, not just relying on alerts. |
| Gold Tier provides deeper visibility into the underlying physical infrastructure where customers VM are running. Customers are entitled to see lower-level internal metrics such as vMotion stun time and VMkernel latency. | |
| Gold tier provides self-service monitoring. Customers are given their own login to a portal where they can monitor their own VMs. They can initiate scheduled downtime |
There are other metrics you can add to differentiate one class from another. However, be careful of adding metrics that do not actually serve your business. For example, it can be tempting to put the accessible time of your self-service portal, to protect you from scheduled downtime. You need to work on the basis that your “office” is open 24 x 7 x 365 days.
The Metrics of SLAs
Do you set it per week, per month or per year? Let’s find out!
The Time Window
SLA is a monthly metric, not daily or yearly. You use an entire month of data to calculate it, averaging 8640 datapoints of 5-minute averages.
In the following table, notice 99.999% in a year is more time than 99.95% in a week. Your customers would not accept a yearly metric as they can be exposed to a long downtime. You would not accept a daily metric as there is no room for error. The monthly metric provides a balance between service quality and cost to deliver the service. It also makes reporting easier as you simply follow the calendar month.
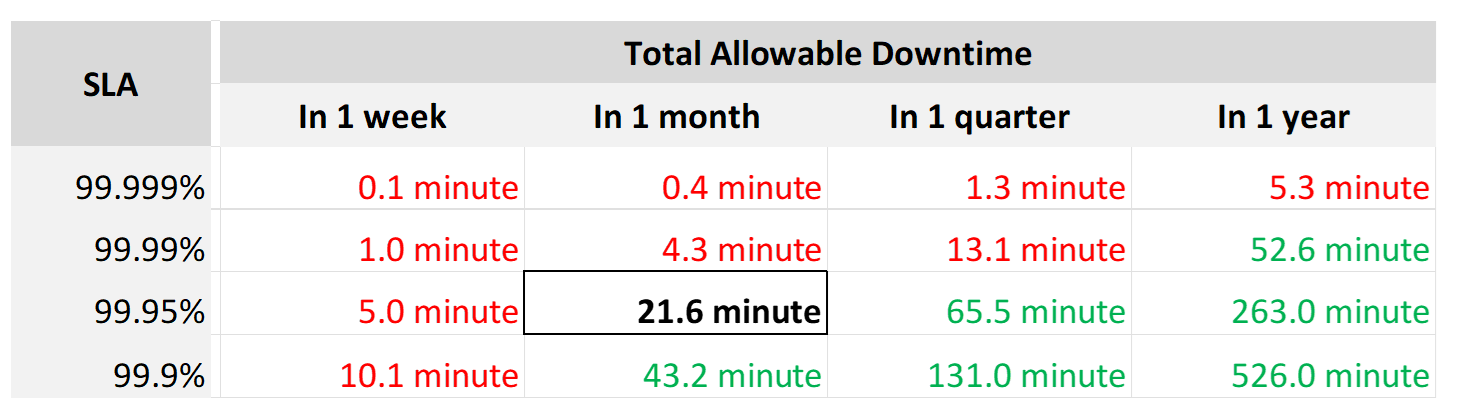
Each additional “9” shrinks your SLA window by 10x. That’s why each decimal can cost a lot more money, as a different architecture may be required.
Even if you measure the SLA once a month, it can still be very difficult to meet. Take a look at the following table:
If you promise 99.99%, you only have 4 – 4.5 minutes of downtime per calendar month. That means your architecture must be able to detect the issue and then complete remediation in just a few minutes. That’s a tight space to manoeuvre.
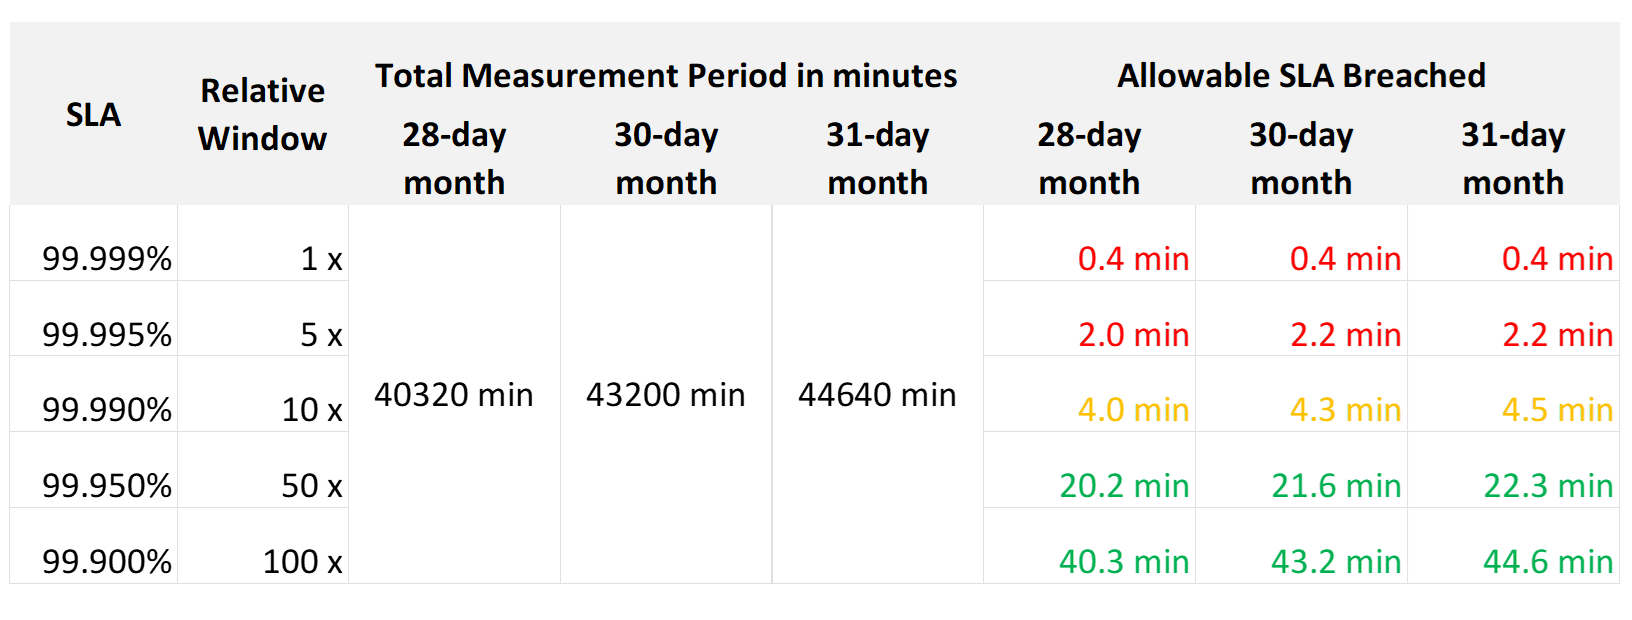
Let’s analyze the size of the failure window we have per month. The table below gives you a better gauge into what SLA you want to set for each class of service.
| 30-day SLA | Failure Window | Failure Chance per SLA |
|-----------:|---------------:|-----------------------:|
| 99.99% | 4.3 minutes | < 1 time |
| 99.98% | 8.6 minutes | < 2 times |
| 99.97% | 13.0 minutes | < 3 times |
| 99.96% | 17.3 minutes | < 4 times |
| 99.95% | 21.6 minutes | < 5 times |
| 99.90% | 43.2 minutes | < 9 times |
| 99.80% | 86.4 minutes | < 18 times |
The 2 Sides of an SLA
This is one of those things in life where it’s so obvious that we overlook it.
There are 2 sides of an SLA.
| Promise | What you promise to your customers. Obviously, the higher the price, the better the service, the higher the SLA. So, there can be multiple numbers, matching the number of class of services. |
|---|---|
| Reality | What is actually delivered. Calculated at the end of the month. There is only one number, regardless of the class of service. A Gold VM can fail its SLA even though it’s getting a higher number than a Bronze VM. |
SLA Calculation
Since an SLA is a monthly counter, it needs to be derived from thousands of 5-minute counters.
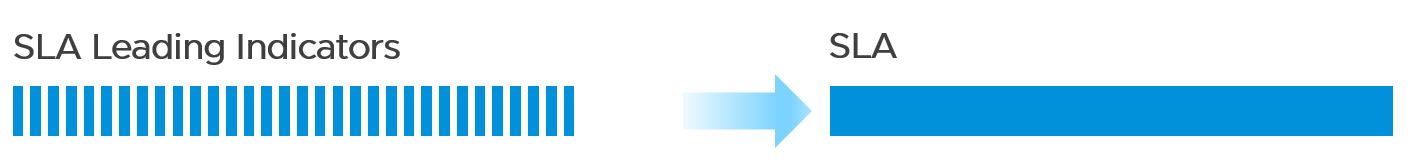
The four elements of IaaS (CPU, Memory, Disk, Network) are evaluated every 5 minutes. As this results in a metric, we need to give it a name. I call this SLA Leading Indicator, as it’s telling you in advance if you’re going to fail the SLA or not.
We need one metric for each service. In IaaS, the formula is:
If VM CPU Ready > 2.5% then 100% else 0%
If VM Memory Contention > 1.0% then 100% else 0%
If VM Disk Latency > 10 ms then 100% else 0%
If VM Network TX Dropped > 0 % then 100% else 0%
VM SLA Leading Indicator (%) = Average of Above 4 metrics.
So, every 5 minutes, a VM gets a score of 100% or 75% or 50% or 25% or 0%.
The VM Performance SLA (%) value is simply the average of the 5-minute datapoints over the last calendar month.
Whether that’s good or bad, it depends on what is being promised. The higher the class of service, the higher the price, and hence the higher the SLA.
Performance Quantification
| CPU | CPU Ready time of 2.5% in a 5-minute collection period translates into 7.5 seconds of ready state. This 7.5 second freeze does not have to be a contiguous block. Likely it is sub-seconds, spread well over 300,000 milliseconds. |
|---|---|
The number is not measured against CPU Utilization. 2 VMs can have identical Ready time while having very different utilization. VM 01: CPU Ready 10%. CPU Run 90% VM 02: CPU Ready 10%. CPU Run 10% To VM 1, the situation is not that bad as it still got to run most of the time. To VM 2, the performance is bad as it cannot run half the time. | |
| Memory | Memory Contention is relative to the amount of memory being used. Unlike CPU, it is not measured across time. Reason is memory does not “run”. |
| Disk Latency | This is the average latency across 300 seconds. As disk IO is measured per second, a VM doing 1000 IOPS is doing a total of 300,000 IO commands over the entire 300 seconds. |
| It’s also an average of reads and writes. As each virtual disk can have its own latency, this number is normalized at VM level. |
Class of Service
Now that you have the 4 SLAs, you compare them with the associated Classes of Service. The reason to offer multiple Classes of Service is that if you only have one Class of Service offering and you promise good service, everyone will expect the same first-class experience.
Kim Ramirez advises that from a pricing psychology standpoint it might make sense to offer Gold, with the expectation that nobody will buy it, and it only serves to make Silver look like a good deal. In life, one way we know something is good or bad is via comparison. Relative value can complement absolute value in educating customers.
Having a comparison also addresses potential confusion where customers wonder where Gold is, if they only see Silver and Bronze offers.
If you do not wish to make a certain class available, provide the reason to your customers and/or management.
Price/Performance
The price-performance ratio is widely accepted as it is simple to understand and it’s built on fairness. You’ve probably heard of this: “I offer 3 variants of service: Cheap, good, and fast. Pick any two. You want it cheap and good; it won’t be fast. You want it cheap and fast; it won’t be good. You want it good and fast; it won’t be cheap!”.
In IaaS, how do you apply the above principle?
-
For Availability, this is measurable. If you reduce the downtime window by 2x, logically you should pay 2x.
-
For Performance, how do you quantify this since it depends on utilization? Since utilization does not exist yet, you use overcommit ratios. If there are 2x vCPUs in the cluster, then each of them pays half price. This is fair as the cost must be distributed to all.
-
For Compliance, this is a little different. Unlike with availability and performance, it is in your interest as a service provider to provide a perfect and consistent level of compliance across all classes of service.
The class of service impacts many parts of operations, so it needs to be central to your plan. The following diagram shows how the quality of the service and overcommit ratio serve as input to operations management.
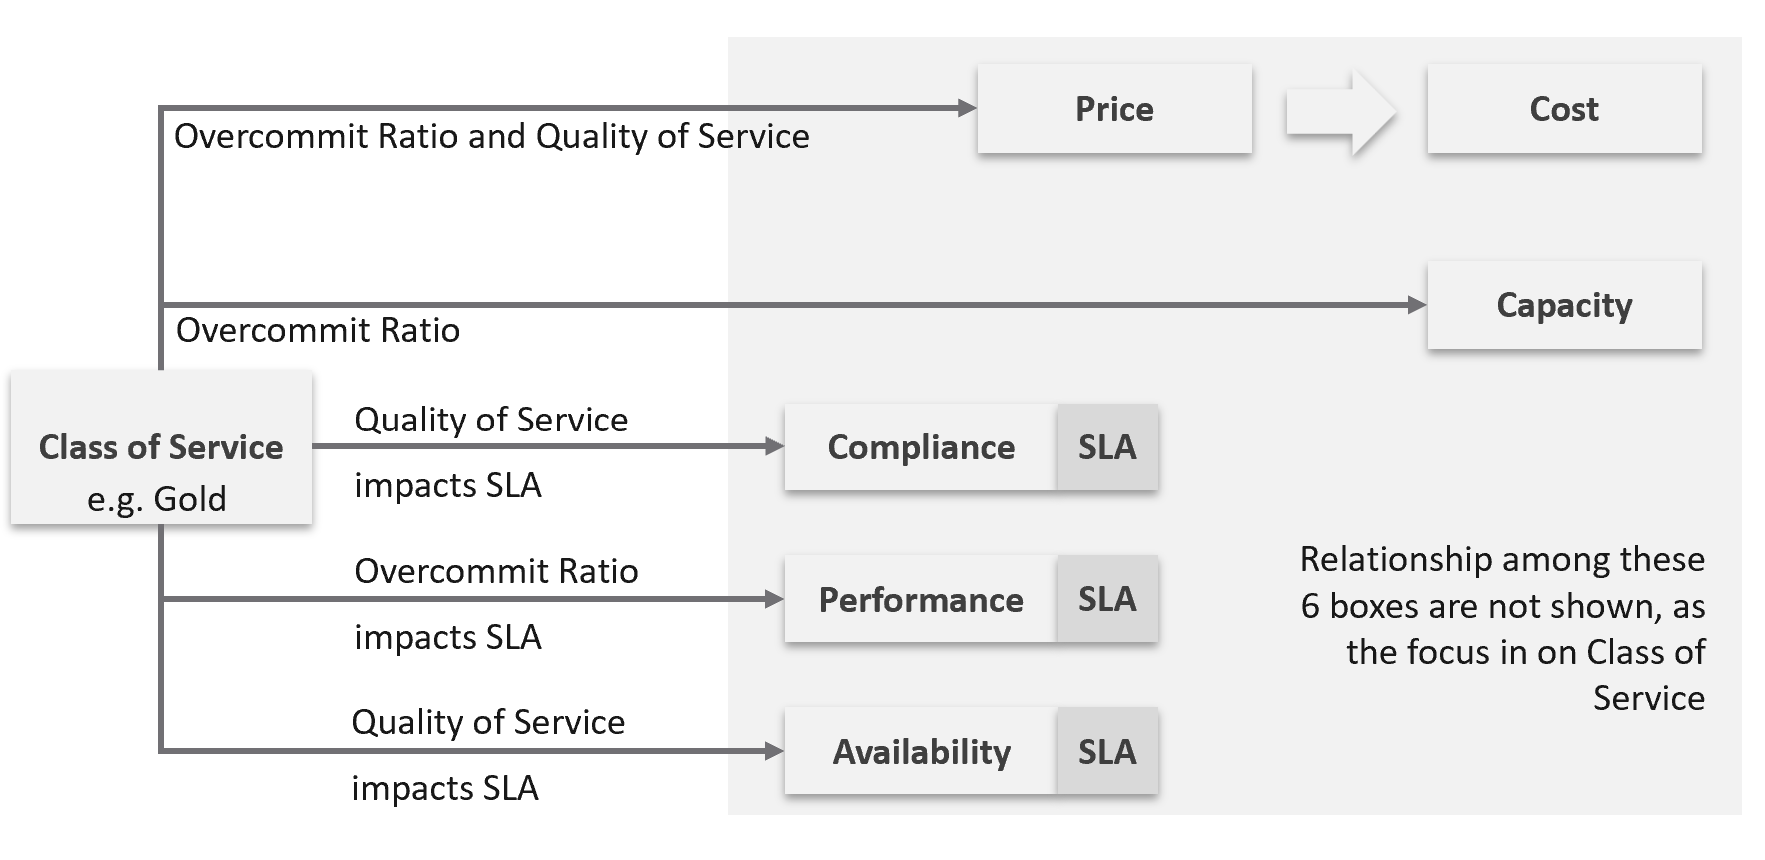
The following table shows a basic and generic guideline to a class of service. The actual model that you will implement will differ, taking into account actual hardware model and business demand.
| Tier | Price | Overcommit | “Performance” | Positioning |
|---|---|---|---|---|
| 1 (Gold) | 1.00 X | 1:1 | Perfect | Performance “Guarantee”. Suitable for latency-sensitive mission critical applications. |
| 2 (Silver) | 0.50 X | 1:2 | Great | 50% discount for a mere 5% penalty. Great value compared with Gold Tier. Suitable for most Production workload. |
| 3 (Bronze) | 0.25 X | 1:4 | Good | 75% discount for a mere 10% penalty. Notice the price is half and the performance drop is doubled. This makes it fair and consistent. Suitable for Test & Dev workload. |
| 4 (Free) | 0.00 X | Max | Average | Suitable for temporary projects. No Availability SLA, no Performance SLA |
I put “guarantee” in quote because for CPU this is not possible as the VM CPU Ready counter does not register 0.00% when there is no contention.
Performance
The word is shown in quote as it’s a broad definition. It includes all the types of SLA.
The performance column in the table above is backed by clearly defined SLA, because you need to quantify what the penalty exactly translates into.
-
Let’s take Bronze as example. I put 10% penalty to position the business value. In reality, the performance metric is not simply ≥ 90% for Bronze.
-
Using CPU as example, it is not that the CPU Ready will be ≤ 10% at all times.
-
10% is too high a number. A VM experiencing 9.9% CPU Ready constantly for entire month will pass the SLA. This is obviously unacceptable. A fairer number is 2.5% since it is an average of 5-minute.
-
“At all times” translates into 100% SLA. It’s cost prohibitive. On the other hand, average is far too loose. SLA is expressed in “nines”, such as 99.93 or 3 nines. It is never expressed in lower number such as 95% as that translates into 1 in 20 failure rates.
-
2.5% will serve all classes. You just need to adjust the “nines”.
Free Tier
The Free Tier is useful to convey the value of the SLA. Human nature tends to appreciate something when after it’s taken away from us.
Business wise, the free tier must be funded by paid tiers. Since it is free, you are excused from providing SLA. It’s acceptable for them to have unpredictable downtime and slow time. Commercial cloud providers provide free tier that are intentionally designed to be slower and less reliable, because they want you to upgrade and pay.
The Benchmark to Rule Them All
Gold class has higher SLA than Silver class. For that to happen, that means they are measured against the same threshold or benchmark.
-
For availability, you measure all classes against the ideal, which is no downtime.
-
For performance, you measure them against the same threshold, which is the “slow time”.
-
For compliance, you measure them against the ideal, which is perfect compliance.
-
For service, you measure them against the ideal, which is the best possible service.
A VM in silver environment will expect that it does not get what it demands as often as a VM in Gold. If the VM Owner wants to have more consistent service in performance, then simply pay more and upgrade to the gold cluster.
This approach is easier than setting up a different performance threshold for each tier. Say you set the following:
-
Gold: VM Memory Contention: 0.5%
-
Silver: VM Memory Contention: 1.5%
You notice the problem already?
It is hard to explain the delta or gaps between the class of services. Why is Silver 3x the value if it is only half the price? Shouldn’t it be proportionate?
There is a 2nd problem. If you set different standards, it is possible that Silver will perform better than Gold, because it has lower standard. This can create confusion.
This means the performance in production is expected to have a higher score than the development environment. Development environments will obviously perform worse than Production environments.
How much worse, exactly?
Let’s find out by applying all the above into actual numbers. You have 9 numbers, 3 SLA x 3 Class of Service.
Recommended SLA
Let’s put all the above SLA in an example. The following is what I’d recommend:
| Tier | Availability SLA | Performance SLA | Compliance SLA |
|---|---|---|---|
| 1 (Gold) | 99.975% | 99.9% | 99.95% |
| 2 (Silver) | 99.950% | 99.8% | |
| 3 (Bronze) | 99.900% | 99.6% |
Why they are all different numbers? Isn’t easier to have 1 number for each class?
Well, they measure different things:
| Availability | It can afford to have the highest SLA because scheduled downtime and downtime caused by customer is not included. I put 99.975% as Windows or Linux may need to run filesystem integrity check. If you have many IT services or Security services that must be started before application services are started, adjust the SLA accordingly. Notice the downtime windows is 1x, 2x, and 4x. It helps in justifying the price when the gaps are clear and consistent. |
|---|---|
| Performance | Lower SLA due to stringent standard. It’s stringent so it can cover the mission critical environment. As a result, the Bronze environment will have a harder time meeting it. If you think that’s too strict, reduce the SLA not the threshold. To see how bad the reality, use KPI. Notice the number for performance is 1x, 2x and 4x. Silver failure window is 2x bigger because its price is 2x cheaper. Remember the Price/Performance principle? The basic concept is you pay double you get something 2x better. Why not 100% for Gold since there is no overcommit? Because that’s just the compute portion. You do not control the network and storage portion. |
| Compliance | It has identical SLA for all classes as it’s in your interest to secure everyone. You don’t want to have a security loophole, which can be used as jump box to attack the rest. I did not put 99.99% as that’s not even 1 chance of mistake. As the value for compliance is the last value of collection, that could be as short as 1 second. Consider how fast it takes for you to effect a change. If you rely on manual change, then adjust the number accordingly. |
Penalty Quantification
Let’s drill down to see what the SLA numbers
In the following sample of 1 hour window, there are 12 measurements of the CPU Performance SLA for VM 007.
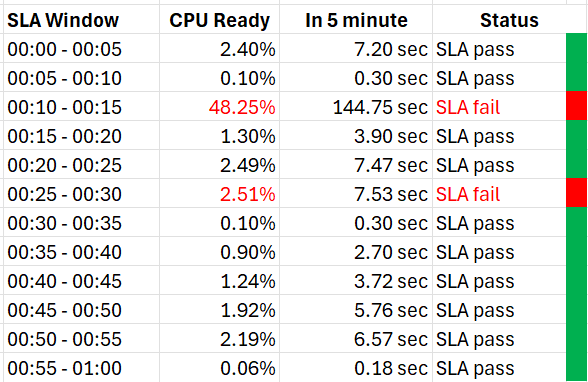
The VM 007 suffers 2 SLA failures.
-
The 1st failure is bad. The number is very high. Since SLA is binary, this is simply counted as failure. There is no severe failure in the book of SLA.
-
The 2nd failure is barely a failure. Again, since SLA is binary, this is also counted as a complete failure. There is no partial failure.
So why did I recommend 99.9% and not 99.95% for Gold?
-
The 0.05% matters operationally.
-
99.9% means the VM may not get the promised SLA for up to 0.1% of a given month. Using a 28-day month as it’s the shortest, this translates into 40.3 minutes.
-
Since SLA is computed every 5 minutes, the provider only has up to 8+ chances of SLA failure in the month of February.
-
This means CPU Ready > 2.5% for 8 times in the February months.
Sample Offering
Putting the above together, what does a sample class of service actually look like?
Price & SLA
SLA is the hard product, the main thing that you get when you pay for the service. Using the airline business as an analogy, the hard product is the seat. Other things such as in-flight entertainment and meals are soft products.
In IaaS, since you do not typically care about the hardware specification (e.g. the type of SSD for storage, the memory brand and technology), you focus on the SLA.
| Gold | Silver | Description | |
|---|---|---|---|
| Price | 2x | 1x | Gold is priced 2x Silver. |
| Over-commit | CPU 2:1 RAM 1:1 | CPU 4:1 RAM 2:1 | The reason why Silver is half price is because there are twice as many consumers. |
| Availability SLA | 99.975% | 99.950% | Gold has 2x less downtime |
| Performance SLA | 99.9% | 99.80% | Gold has 2x less “slow time” |
| Compliance SLA | 100% | 100% | You should maintain perfect compliance with your compliance requirements for all classes of service. |
| Service SLA | Gold | Silver | See the Service section for details. |
If you mix environments, it becomes operationally challenging. Your only tool is to apply reservations and shares. For example, give Gold 2x the value over Silver to justify the 2x price.
The preceding table is a generic guideline. As part of your planning with IT Management, you help them define and decide on each Class of Service. This planning session requires vendors input as you want to optimize cost. Use vendors discounting and licensing model to complement the plan, not dictate the plan.
Yes, it’s a balancing between ideal solution and what actually gives the best bang for the buck.
At the end of the planning session, you may end up with something like this.
| Tier | Price | Compute | Storage |
|---|---|---|---|
| Gold | Highest | CPU 1:1 RAM 1:1 | All Flash |
| Silver | Good (67% of Gold) | CPU 1:2 RAM 1:1.5 | All Flash |
| Bronze | Low (33% of Gold) | CPU 1:6 RAM 1:2 | All Flash |
| Free | Free | N/A | Magnetic |
For Silver and Bronze, to maximize consumption of hardware, you base on average ratio of 1 vCPU to 4 GB RAM. This is a common ratio. If you want to tailor this to your own environment, use VCF Operations to give you the actual ratio.
For Silver, you decide on 3:1 CPU overcommit and no RAM overcommit. Based on 1 vCPU 4 GB RAM, you need to buy 12 GB RAM for each physical core. Buying 64 cores maximizes your vSphere license. That means you need 64 x 12 = 768 GB of RAM. If you run vSAN and NSX, you need to account for the overhead accordingly.
The 3:1 overcommit enables you to lower the price by 3x for CPU portion. If you do 50/50 split between CPU and RAM, the overall price is 67% of Gold, yielding a 33% discount.
For 33% discount, what’s a reasonable performance penalty? What’s acceptable to both your CIO and application team?
CIO also decided that free tier is not offered as that’s not the business you want to be in.
As you can see, the hardware spec is driven by the business model. Decide on the overcommit & price first.
If you want your customers to right size in advance, then a 64 vCPU VM needs to be more than 64x the price of 1 vCPU VM. If the pricing model is a simple straight line, there is no incentive to go small and no penalty to over provisioning. You will end up forcing rightsizing in production, which is a costly and time-consuming process.
Size Limit
Because you overcommit, you run the risk of contention. One way to minimise this risk is to control the maximum size of VMs. You want to avoid monster VMs dominating your overcommitted ESXi hosts. The following table provides an example of the size limit you associate with each class of service.
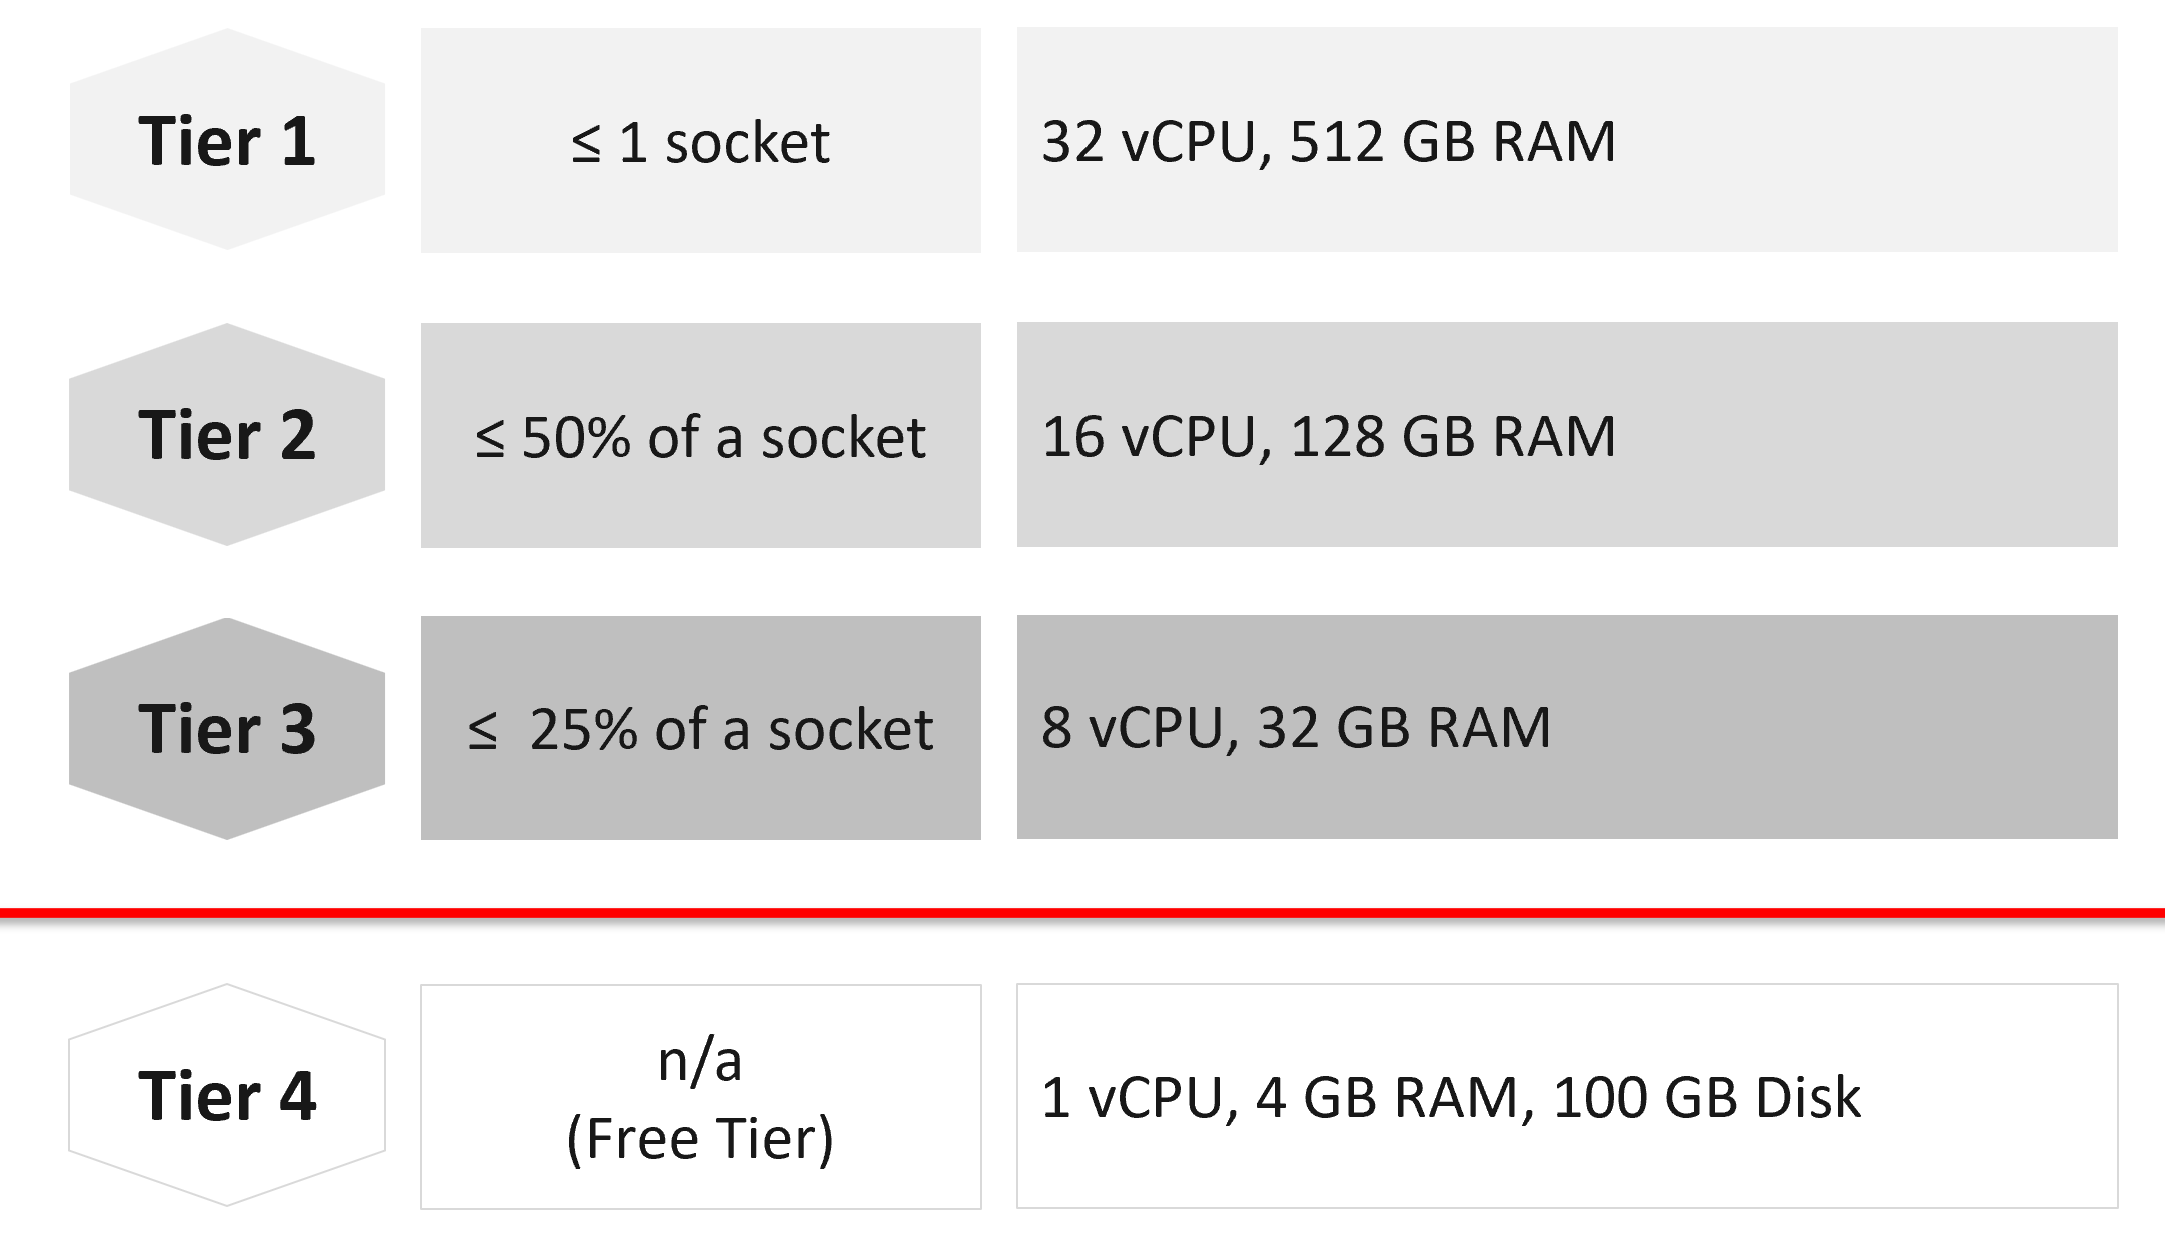
Capping the size at each tier is a good way to prevent monster VMs from causing performance problems in environment with higher overcommit ratio.
If you allow a single VM to be the same size as the ESXi host, you practically can’t do overcommit if you want good performance.
The Free Tier may also be limited further by capping the number of free VMs per customer, else you’d go bankrupt.
For comparison, AWS’s free tier for EC2 is only 1-2 vCPU & 1 GB RAM as it’s based on t2.micro and t3.micro.
Service
Beside the hard product, soft products play an important role in further differentiating Gold from Silver. Support, both reactive and proactive, is one major area where different classes of service can show the value of higher tiers.
| | Gold | Silver | Description |
|----|:--:|:--:|----|
| Response Time | 2 hours | 4 hours | Gold has 2x faster response time |
| Support Hours | 24 x 7 | 12 x 7 | Gold has 2x support hours |
| Support Process | Level 2 | Level 1 | Gold bypasses the first level help desk. |
| Root Cause Analyzis | Provided | Additional Charge | The RCA includes setting alerts to ensure the same incident is identified immediately. |
| Proactive Support | Daily | None | Gold VMs gets daily health check (KPI and alerts). |
| NOC Screen | Yes | No | Silver VMs are not displayed in a live screen of Network Operations Center room. Reason is the business need to focus on the Gold VMs. |
| Report | Weekly | Monthly | Gold has more frequent report. |
| Business Review | Monthly | None | Face to Face discussion where we review the SLA and support issues. |
| Critical Patch | Higher priority | Lower priority | We patch all Gold VMs first before protecting the lower tier VM. |
| Optimization | Yes | No | Performance and capacity optimization (via proactive right-sizing, for example). |
Availability
This is another soft product in IaaS. Ensure that Gold has much better offering here so the 2x price is clearly justified.
| Gold | Silver | Description | |
|---|---|---|---|
| Snapshot | 1 week | 1 day | For Gold, we will also remind you just in case you forget. For Silver, it’s auto-delete. |
| Size of snapshot | No limit | 100 GB | |
| No of snapshots | 2 | 1 | Gold can have 2x as many snapshots at any given time. |
| Back up | Higher priority | Lower priority | We back up all Gold VMs before backing up Silver VMs. |
| Full back up | Weekly | Fortnightly | Gold has 2x full back up frequency. |
| Back up level | Application | OS | We will install & manage back up agent. |
| Back up report | Yes | No | We provide report for back up status. |
| Disaster Recovery | Separate add-on service | Both services do not have DR as default. | |
Compute & Storage
A VM runs in a cluster but is stored in a datastore. How do you architect both the compute and storage subsystems to support the class of service?
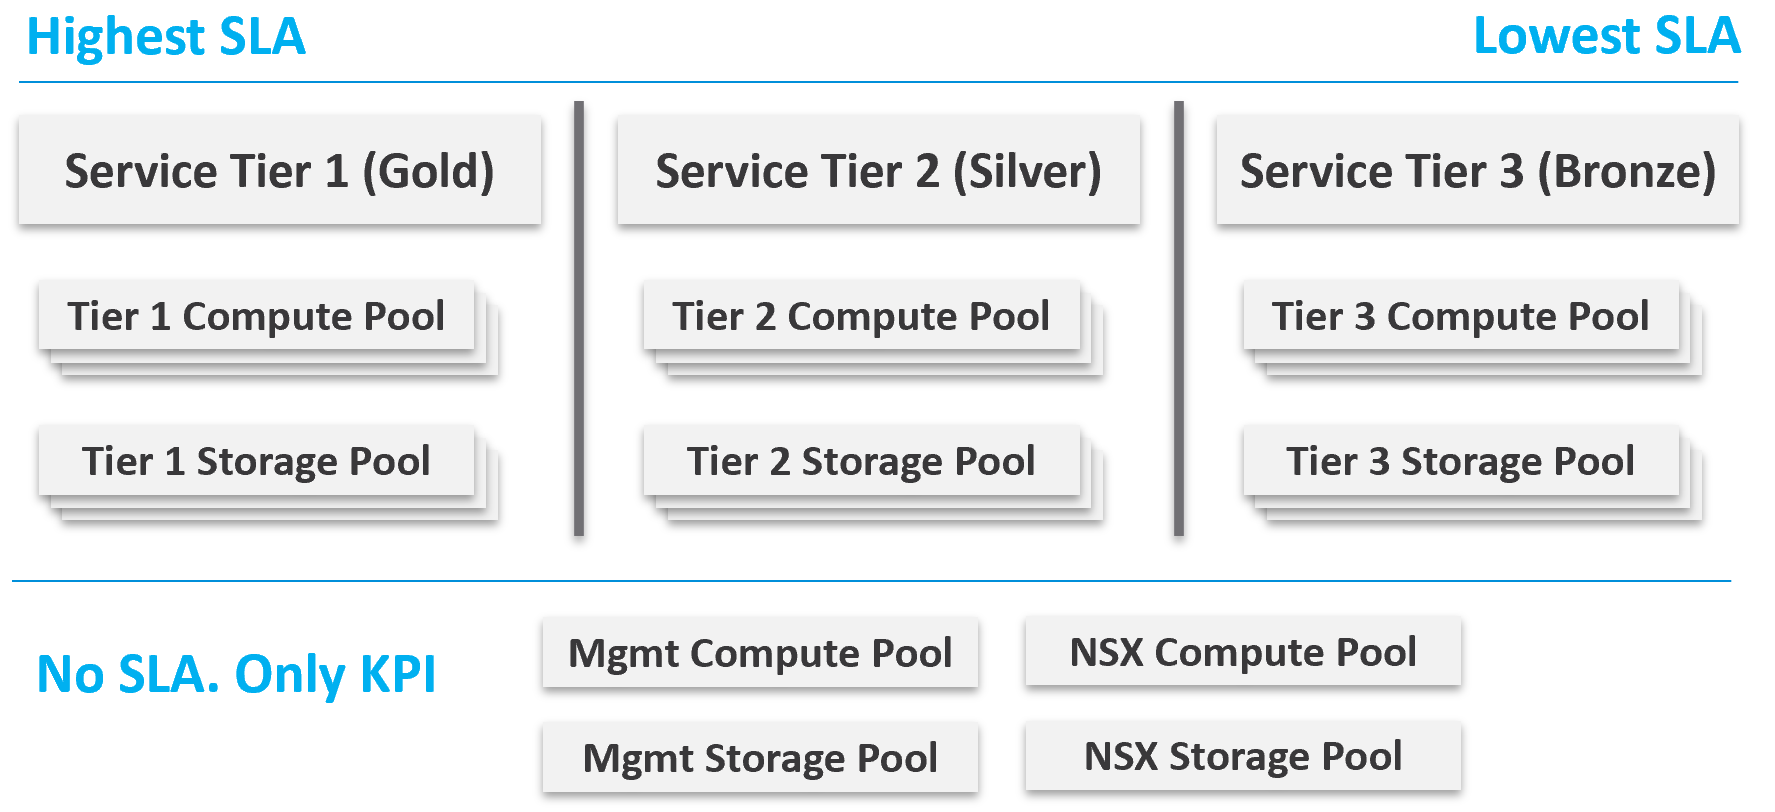
From a performance management point of view, vSphere clusters with vSAN form the smallest logical building block of the resources. While resource pools and VM-Host affinity rules can provide smaller subdivisions, they are operationally complex, and they cannot deliver the promised quality of IaaS service. Resource pools cannot provide a differentiated class of service. For example: your SLA states that Gold is two times faster than silver because it is charged at 200% more. A resource pool can give Gold two times more shares, but whether those extra shares translate into half the CPU readiness cannot be determined upfront.
Same with storage. A VMFS datastore is not able to provide differentiated service levels. Even if they can, it’s not based on latency, which is what your customers care about. The same limitation applies in vSAN. Let’s take an example.
-
You promise Gold VMs will get 10 ms latency at worst. For Silver VMs, you promise up to 20 ms latency. The justification for 2x the latency is they pay half as much. So far so good.
-
You set your storage policy and IO Control, favouring Gold while trying to ensure Silver gets something.
-
Since storage IO control configuration is not based on latency, you may end up with 9 ms for Gold and 21 ms for Silver, where you could have gotten 10 ms and 20 ms.
Mix and Match
Should we provide flexibility, where customers can choose Gold Compute but Bronze Storage?
In the following example IaaS, mixing is partially allowed. Tier 1 cannot mix with Tier 3, as seen by the missing lines.
The result is 7 combinations instead of 9, as shown by the 3 green lines and 4 red lines.
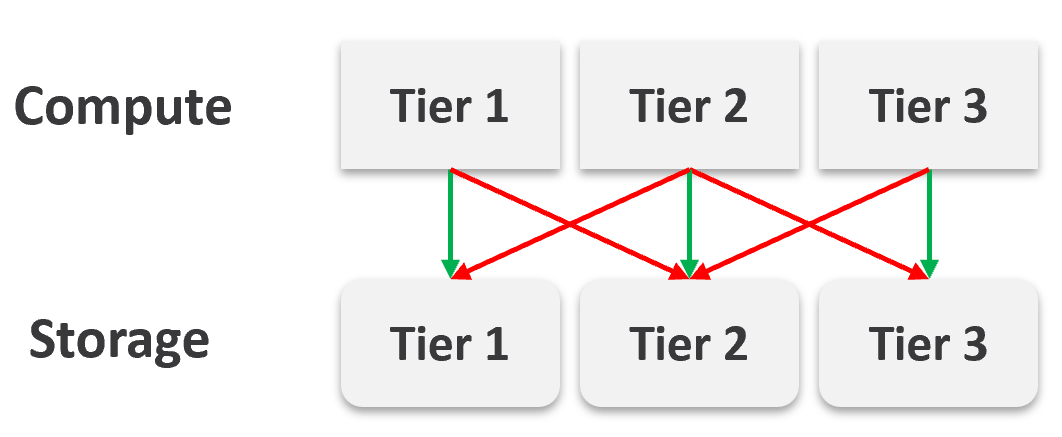
It looks operationally visible.
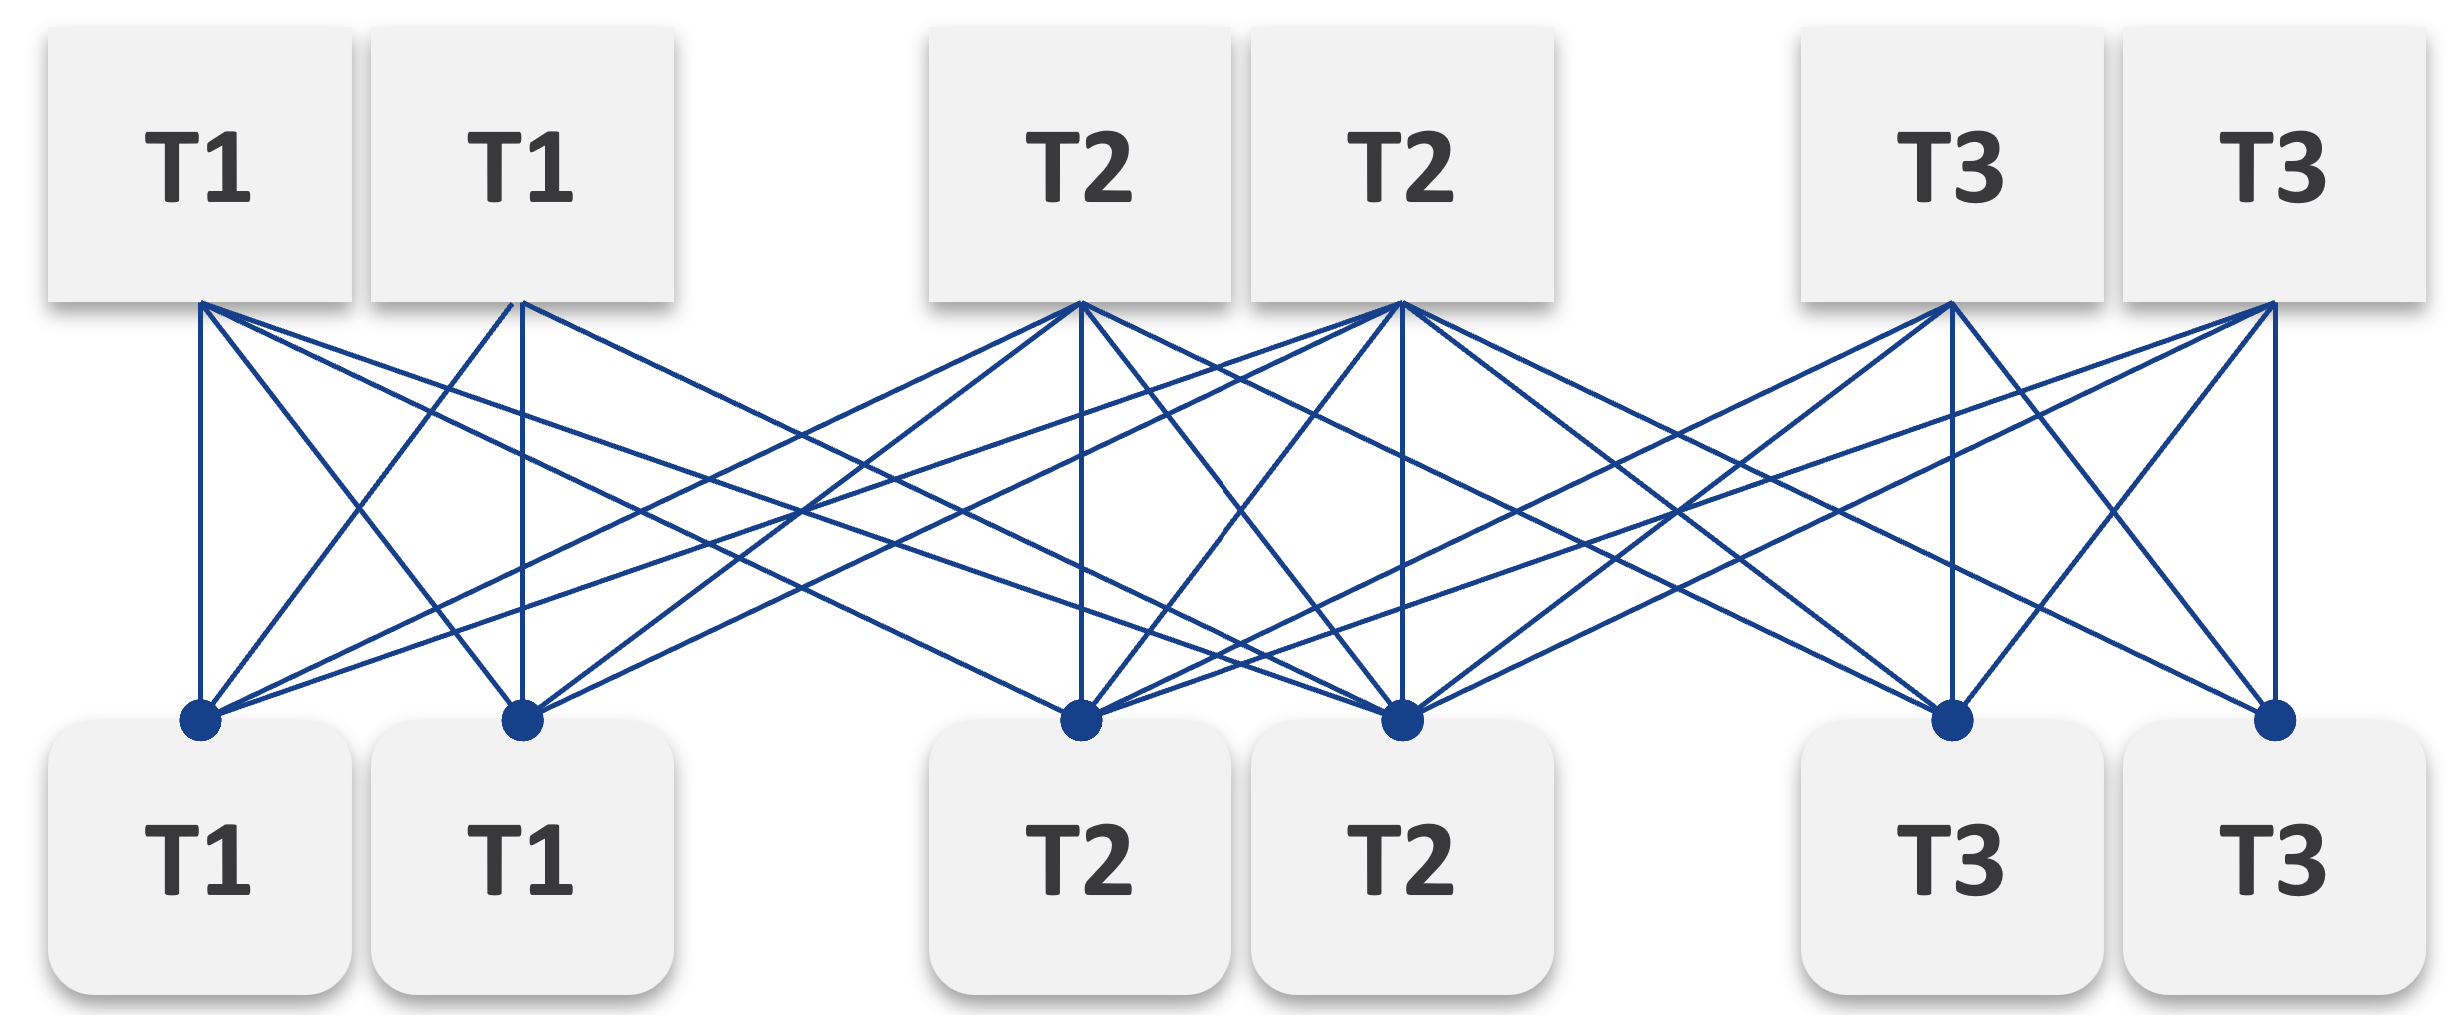
Now let’s see if the above idea scales….
We will just add one extra cluster for each tier. Only 6 clusters in total.
|  |
|
|----|
Simply adding 1 cluster for each tier dramatically increases the permutation. What if you have 10 clusters each?
This is a classic case of flexibility becoming complexity. Flexibility has its price, so you need to make the business call. In smaller environment, you can afford to be more flexible.
There are further complications. As examples:
-
You need to have two tags: one for compute and one for storage. What do you call a VM with Gold compute and Silver storage?
-
Separating storage from compute also means 2x the tagging. You now need to tag both the clusters and datastores.
-
We can create a logic where the virtual disks inherit the class of service from the datastore. But what if we have RDMs? Yes, that’s still a rather popular choice.
-
If you further allow different storage classes for different VMDKs, then you need to tag each virtual disk. This makes reporting difficult as now you need to list each disk attached to each VM.
-
Performance troubleshooting also becomes difficult. Say you allow a VM to buy Bronze Compute but Gold Storage, because the load is storage sensitive, but the application team does not care about CPU. What if the VM disk latency is caused by CPU contention?