Purpose-Driven Architecture
When you architect IaaS or Desktop as a Service (DaaS), what goals do you have in mind? I don’t mean the design considerations, such as availability and performance best practices. I mean the business results that your architecture has to deliver, viewed from the people who paid for the system, and by the people who will pay for the service. Set aside your opinion on the goal, as you neither pay for it nor use it.
Logically, the answer depends on what is being sold. You can either sell application or infrastructure, broadly speaking. Some popular examples are:
| Service | What you sell | Examples |
|---|---|---|
| SaaS | The software is provided as a service. Customers need not install it on-site. Common among ISVs who want to avoid on-prem installation, avoid outdated installations, or mine their customers’ data. | Salesforce, VMware Skyline, Microsoft Office 365. |
| DBaaS | Database as a Service. There are 2 variants: Instance: A customer shares the binary with others. Patching the software means all instances using the instance get patched. They all need to have common maintenance window. Dedicated binary: Customers can have different versions, patch levels, and downtime schedules. | Examples such as Mongo DB as a Service or MS SQL as a Service are common among enterprise. The DBA provides this as service to the application team, who are not as deep on databases knowledge. |
| PaaS | Platform as a Service. A set of services used by business applications. AWS provides many such PaaS services and is the main reason why customers choose them. | Central IT provides a set of common services (e.g., login, payment) to all business units websites. |
| DaaS | Desktop as a Service. Typically, Windows 10 + End-User applications. Application teams must be involved, as a simple 10% CPU increase of your browser can impact performance SLAs as the ESXi host becomes heavily over committed. The goal is to ensure End Users are getting a quality desktop experience while keeping the price per user low. | Many enterprises’ IT provides this for better security and PC-manageability. They may deploy this with thin client. VMware Horizon Cloud, Microsoft Windows Cloud are cloud examples. |
| K8aaS | Kubernetes as a Service. There are 2 variants: Dedicated cluster. Shared cluster. | Amazon EKS |
| IaaS | There are 3 variants here. As this is the topic of the book, let’s explore in depth. | |
Begin with The End in Mind
It’s important to reflect the business in both the IaaS platform and your operations. It makes the infrastructure team aware of the context and impact to the business. In their day-to-day operations, they need to be Business Application centric. This calls for a paradigm shift.
Your CIO wants live information projected for his peers to see on how IT is serving the business. This requires you to have awareness of the business units and their critical applications.
In your service offering, you include the ability for customers to check their own VM health, and how their VMs are served by the underlying platform. This means your architecture needs to know how to associate tenants with their VMs. At the very least, create a structure so they can browse or find their applications and VMs.
Business Application
Is the problem with your business application caused by your infrastructure? The problem is typically performance, although it could be availability or security.
You can create a universal model for all business applications since the infrastructure metrics are the same.
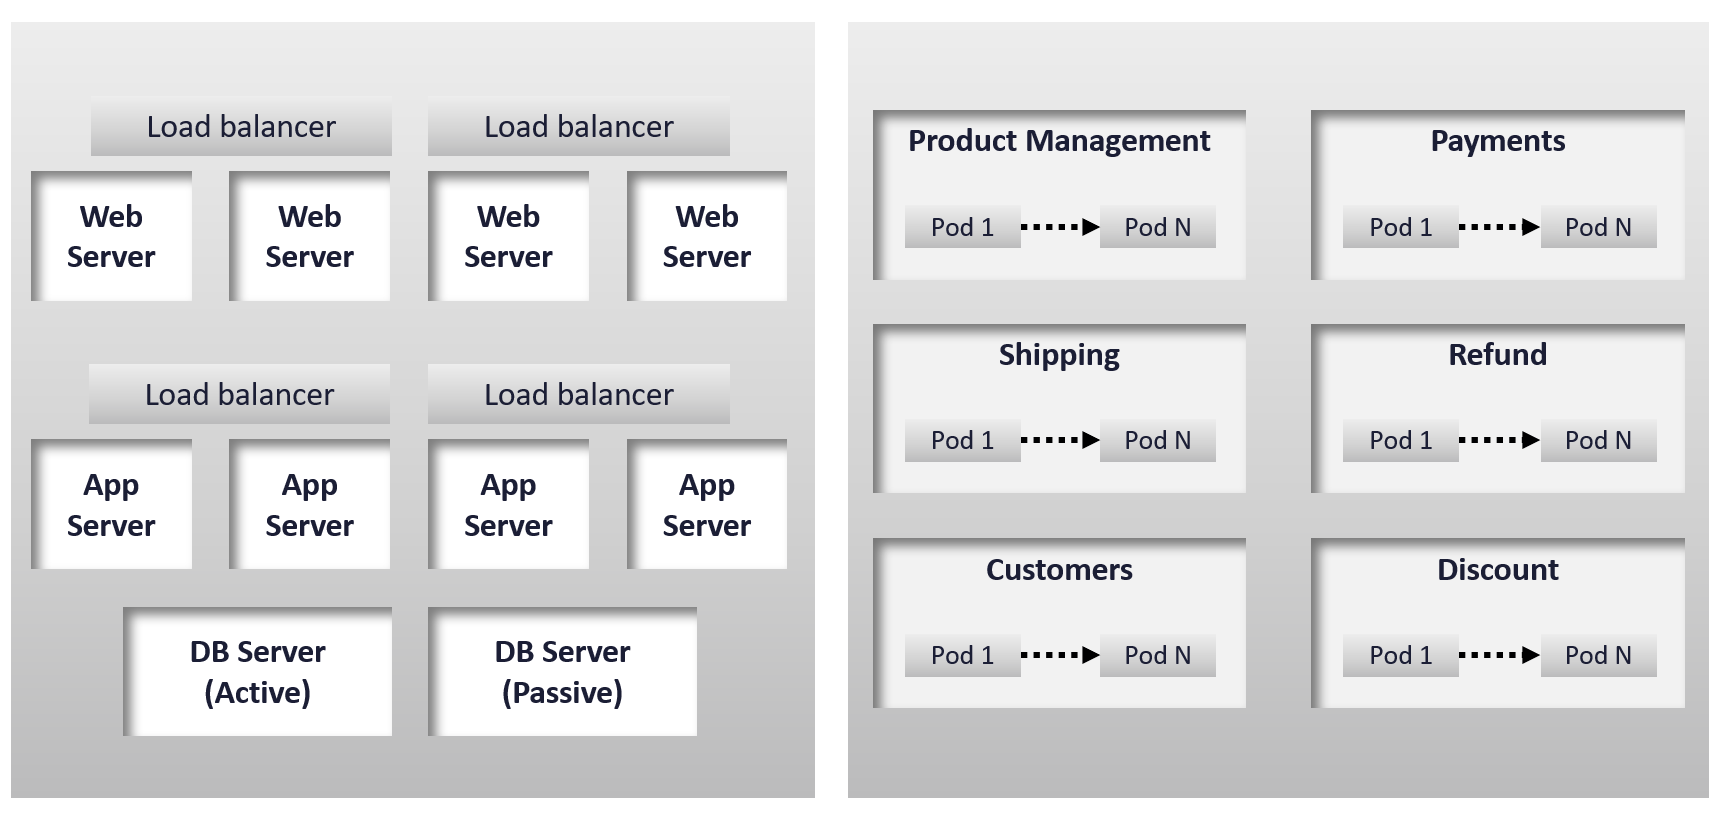
The health of a tier is the average health of its members. This is because a tier scales out across distributed instances. We are not taking the minimum value because processing within a tier does not happen in sequence. This is not a convoy. A good Load Balancer will balance both performance and availability.
“Hold on!”, you might say. Since it is scale-out architecture, the Application Team has catered for this. If they only need 3 web servers, they will deploy 4 or even 5. So, both performance and availability are not affected if one web server goes down. The measurement of a tier has to take into account this extra capacity, and not simply do an average of all members.
This logic sounds reasonable. But is it correct?
It is correct for availability. It is not correct for performance. Performance needs to include all nodes as it reflects reality.
Day 1 | Day 2
Architecture is Day 1, and Operations is Day 2. Day 1 happens before Day 2.
By Architecture, I mean the detailed technical work, including building and commissioning the system. While the business plan and high level marketecture1 is defined during Day 0 (Planning), the real architecture work is done on Day 1.
However, if we think deeper, Day 2 impacts Day 0, which is Planning. The reason is the End State drives your Plan. Your Plan drives your Architecture. So, it’s 2 🡪 0 🡪 1, not 0 🡪 1 🡪 2.
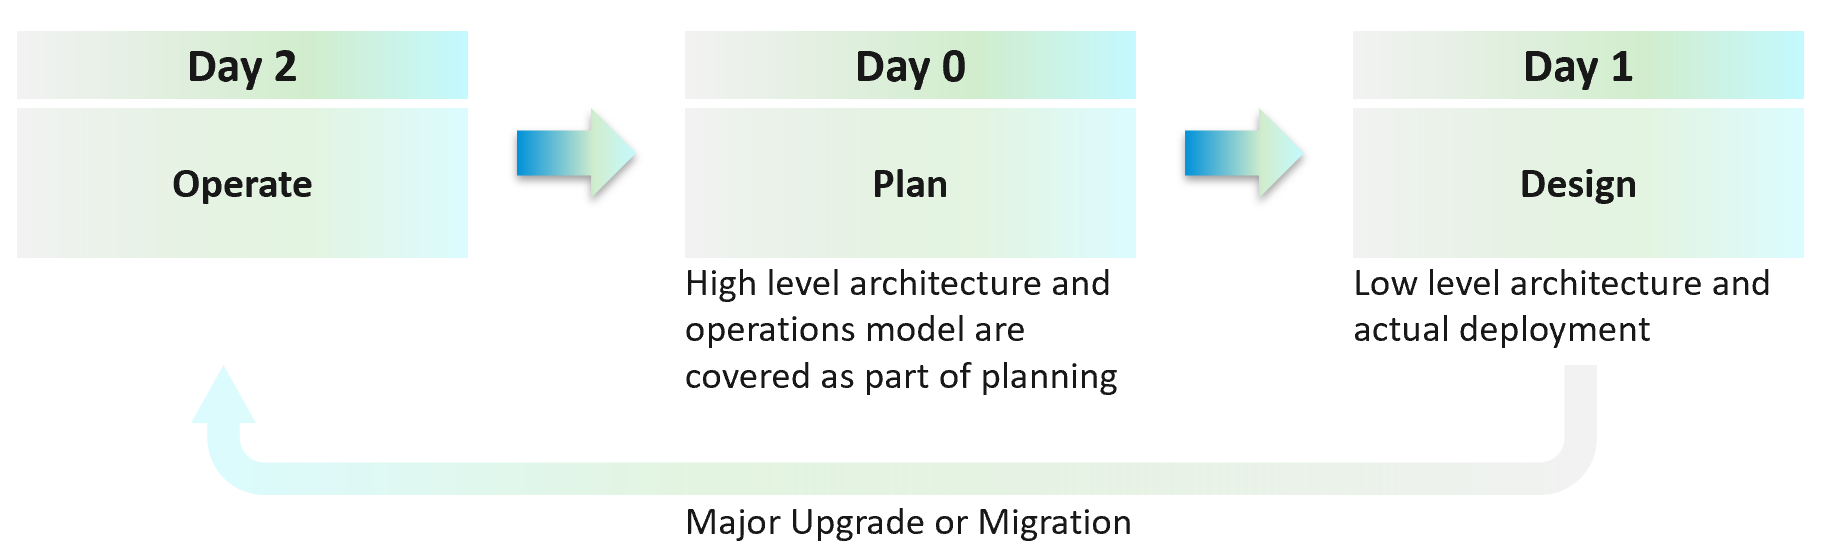
Day 2 is not simply the first few days after you go live. It’s the day you set sail2.
Let’s use an example to illustrate how Day 2 impacts Day 0, which in turn impacts Day 1.
Say you are an internal cloud provider, and you plan to charge per VM. You plan to have 2 classes of offerings:
-
Gold: suitable for production workloads. Performance optimized.
-
Silver: suitable for non-production workloads. Cost optimized.
For Gold, you plan to not overcommit CPU and RAM. If 1 CPU typically uses 4 GB RAM, then a 64-core ESXi host will only need 256 GB. If you buy a host with 1 TB RAM, then you may end up in a position where you are not able to sell the remaining 768 GB as you have no more vCPUs to sell. This means your hardware specification is impacted. That’s an example of how Day 2 impacts Day 0.
For Silver, you plan to overcommit 4:1 for CPU and 2:1 for memory.
-
You assume that 1 vCPU typically uses 4 GB RAM. Your customers are allowed to buy more or less memory, so this 4:1 ratio between CPU and RAM is just a guideline for overall planning.
-
You plan to run vSAN with dedupe + NSX + vSphere Replication. You also expect heavy IO VMs, which requires kernel processing. For all these supporting, non-business workloads, you allocate 8 cores and 64 GB RAM.
-
If you buy a 64-core ESXi, you have 56 cores left and you will be able to sell 224 vCPU.
-
These 224 vCPU will need 896 GB RAM. Since you overcommit 2:1, you need 448 GB for VM. Total RAM you need is 448 + 64 = 512 GB.
-
That means the hardware spec you need is 64 core and 512 GB RAM. If you buy more RAM than this, you may not be able to sell this extra RAM as you may not have vCPU to accompany them.
The above 2 examples show how your hardware spec can’t be decided without considering the average VM profile and the overcommit ratio you plan. Yes, Day 2 does dictate requirements and constraints to Day 0.
You also promise the concept of Availability Zones for Gold class, as they host mission critical business services. Your company policy for Business Continuity dictates that in the event of an entire cluster failure, you plan to cap the number of VMs affected. If you limit to say 300 production VMs, then your cluster size should not be too big as you won’t be able to fully utilize the resource. I’ve seen multiple customers having 32-node production clusters running 1K – 2K VMs.
Promise vs Reality
In a large environment, you may have the luxury of designing different infrastructure for different workload types. Common examples are GPU Intensive workload, Disk Intensive, etc. If the infrastructure is superior to your standard offering, you need to be careful in setting the right expectation.
Let’s take an example: you promise you can handle CPU Intensive workload as you’ve chosen the best CPU.
Notice the issues here?
There are at least 2 of them.
-
You probably heard of Winston Churchill quotation “Sometimes doing your best is not good enough.” What you think is the best CPU may not be good enough for the workload, either in terms of GHz, number of threads, or power efficiency. For example, if your ESXi sports a 3.8 GHz speed but the application wants 5 GHz, giving it extra vCPU does not exactly meet the requirement.
-
Assuming you pass the first issue above, how do you prove that this so-called “best CPU” is actually able to handle the workload? What metrics do you use? Remember it’s just a CPU. All you have as metrics are just GHz and vCPU. If you rely on the application team metric, you need to be prepared to spend time doing testing with them. You should also apply 100% reservation to eliminate infrastructure-level contention. The problem with reservations is that you cannot overcommit. It means you defeat the purpose of virtualization to begin with.
So, what can you do?
-
Set the right expectation. For example, you state that your infrastructure uses dynamic power management. In most cases, this is good for the application as they get Turbo Boost when they are running hard. In situation of light use, the application may run at lower speed.
-
Do not promise something you can’t measure. In this case, the main metric you want to measure is “Is the CPU available when the VM asks for it”. Metrics such as Ready, Co-stop, Overlap, and Other Wait track these moments of contention. You provide great observability by showing these metrics.
-
Measure what is relevant to your business. If what you offer (read: the SLA) does not guarantee that the whole core is available to the VM, then do not measure the time the VM vCPU runs on a shared core.
VCDX | VCMX
Why do we draw a distinction between promise and reality?
My take is because IT Architects typically do not include Day 2 in the architecture. This is specific to VMware; hence I’m proposing VCDX should be accompanied by VCMX (Management). Designing the architecture and transforming the operations are 2 different skills3.
As a service provider, while your technical knowledge is important, your customer measures you on your service level. While they care about your systems architecture and its technological marvel, they measure you on service quality.
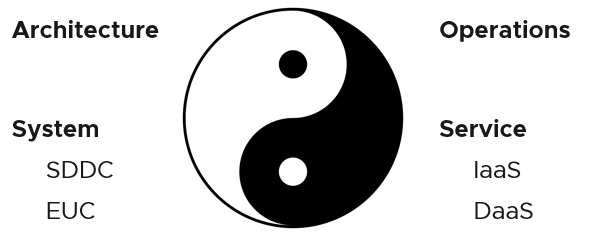
Architecture and Operations are two equally large realms. While we certainly consider Operations when designing a system, it is not a part of Architecture. This book is an example of Operations. Notice it goes deep into metrics as troubleshooting is at the heart of operations.
Architecture and Operations also differ in other industries. The person who designs the space shuttle is not the person operating it. You need to be an astronaut to be qualified to operate a space shuttle. The person who designs an F1 race car is not the person driving it. Different expertise is required. They complete each other and are inter-dependent, like Yin and Yang.
Since Infrastructure is becoming a service, you need to know how to architect a service (e.g., IaaS, Database as a Service, Desktop as a Service).
-
What are the services the IaaS is providing? How do you define a service?
-
What metrics do you use to quantify its quality?
-
How many services? How do you distinguish between a higher-class service and normal one?
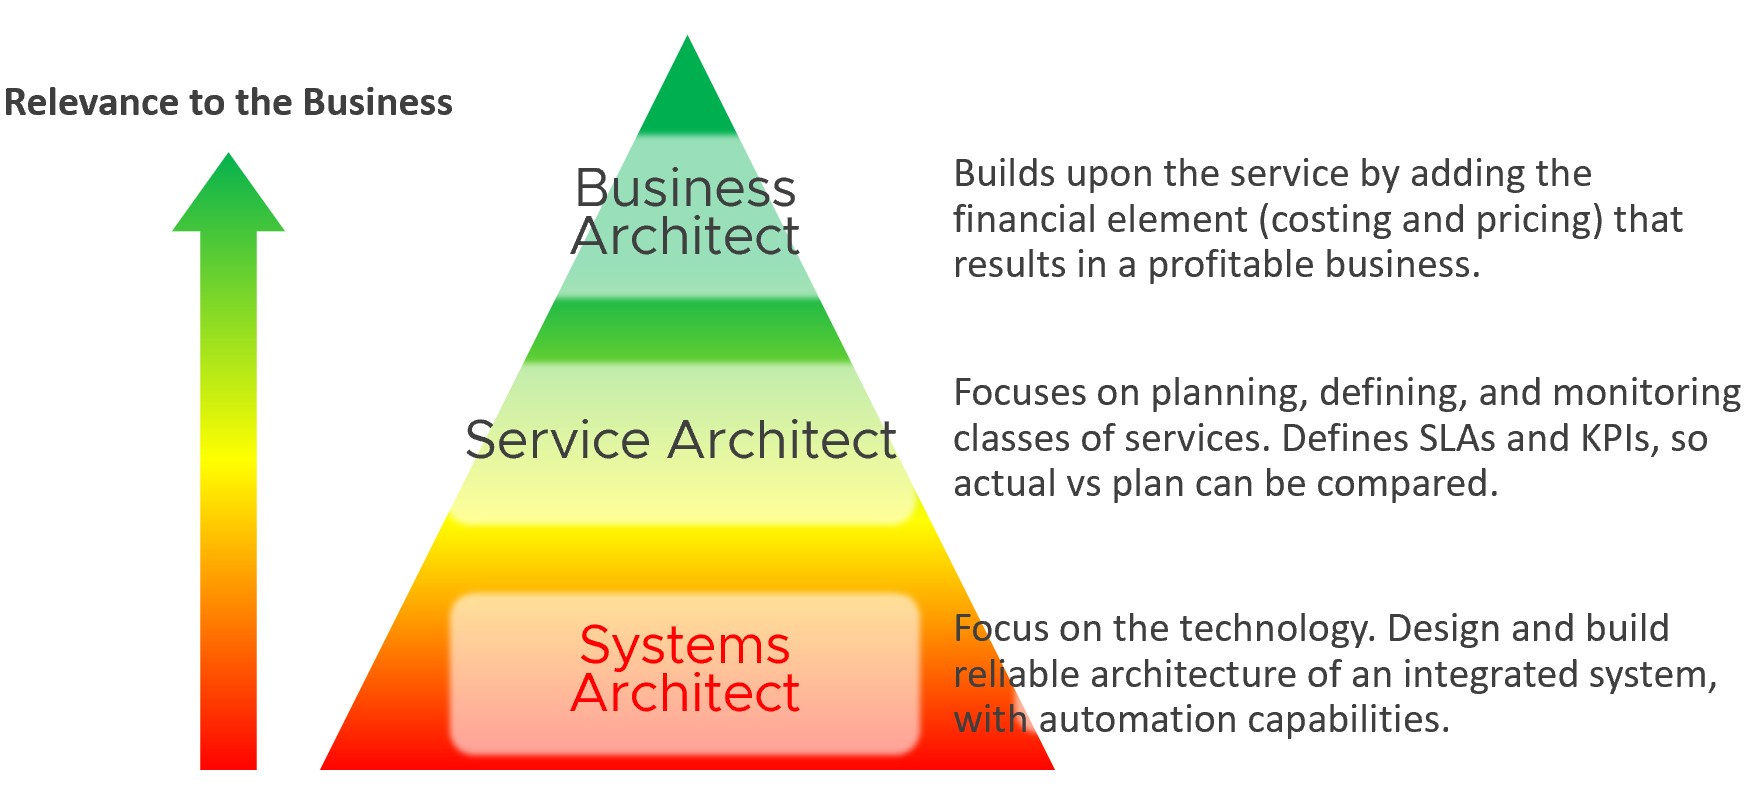
You also need to know what type of services are on demand. Service Architects go out, meet customers and understand their requirements. What classes of services are on demand now and in the future? From there, you can architect the corresponding services to anticipate the demand.
As a Business Architect, you not only know the cost of running the service, but you also know how & when to break even. You are not responsible for profit and loss, as you are not the CIO or Cloud Service Provider CEO, but you do play a strategic advisor role to them. You know what to price, how to price, and most importantly you know your price is competitive (or, at least you can provide a business justification for reasons other than price).
From my interactions with customers, I notice that Infrastructure Architects are not leading the Day 0 phase. They provide input to the Planning stage but are not the lead architects driving it. The Infrastructure Architect tends to focus on technical bits, something that CFOs and CIOs value less (hence they spend less time on it). They also do not architect the operations. I see many seasoned VMware Architects not extending their influence beyond architecture. I think that’s a lost opportunity because Day 1 and Day 2 is actually part of the same side. Think of it as a Mobius strip.
Service Architect and Business Architect are the next steps for Infrastructure Architect. I shared story “The Chef and his cooking” back in 2014 during one of the VMUG session.
By the way, how do you know who is the real architect of a system? Let’s say you have mega VDI system, with integrated components such as VMware, Omnissa, thin clients, office networks and many other things. Who is the true architect of this?
My answer:
The owner of the hands on the keyboard figuring out the root cause when there is a massive problem that no one knows why. That’s your real architect. The team who drew the architecture diagrams are not.
Automate | Operate
You need to account for situations where things go wrong, intentional or unintentional. Real problems happen in Day 2 as that’s when you have business workloads doing revenue generating transactions. Do not architect something you are not willing to troubleshoot. Think of the roles and skills required to operate your architecture. Provide the necessary visibility into each component and define what constitutes health.
I hope the above examples show that Day 2 is where you want to start. As said in a famous quote: “Begin with the end in mind”.
Did you notice something missing in the discussion above?
Yes, I did not cover Automation.
Why is that?
For me, that’s part of architecture. You should not automate what you cannot even operate. So, automation is not part of operations. Automation is a feature of your Architecture, meaning you design the system with automation in mind. Using an analogy, it’s like a plane with many automation features. Fly-by-wire. That’s a feature of the plane. How you use the plane to ensure passengers arrive at the destination safely, comfortably, timely and fresh: that’s operations.
In terms of transformation journey, automation should be placed last. Do not automate what you cannot operate. You’re speeding up the problem if your operations is not well governed.
Observability
Observability is not a superset of monitoring. They are two different things.
| Observability | Monitoring |
|----|----|
| It is a property of the system to be managed | It is an action done by an actor |
| Observability and Debuggability are peers. Just because a system emits metrics and logs regularly, does not mean it has ways to be stepped through and debugged. | Monitoring & Troubleshooting are peers. Just because an admin has the skills to monitor a system, does not mean he can fix it. |
For details, see the terminology chapter at the end of the book.
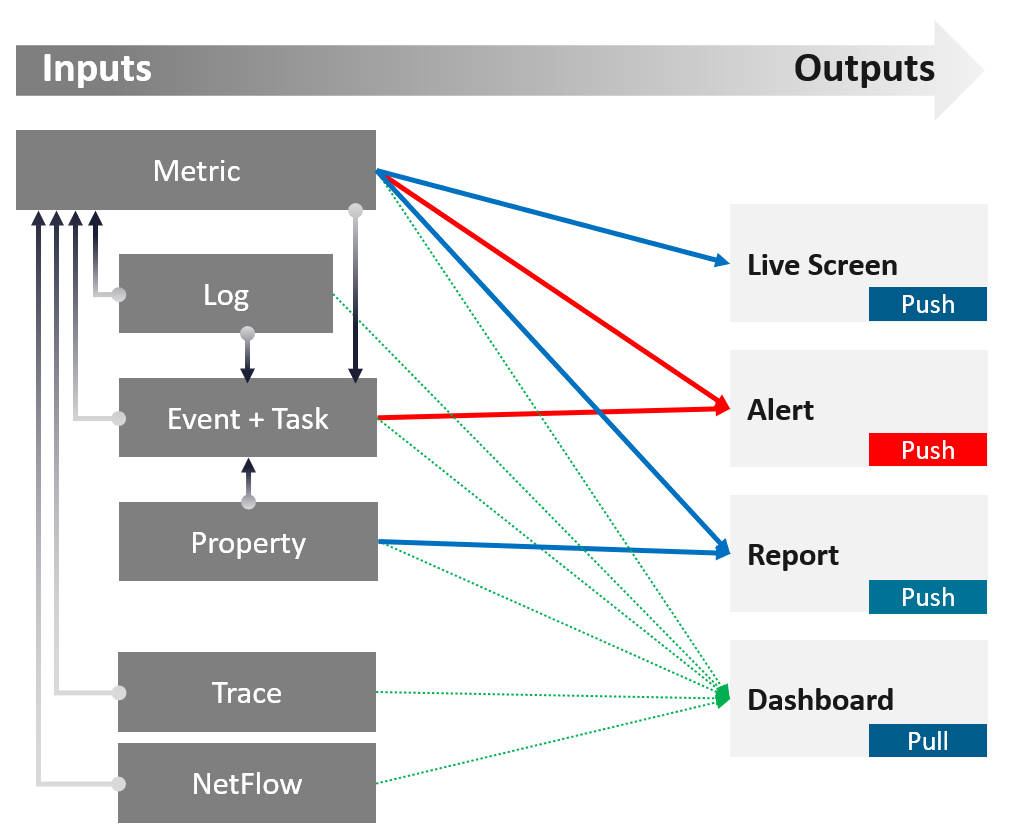
Input | Output
There are 64 types of inputs which work together to give you your alerts, dashboards, and reports. Each of those input types has their own purpose and format. They also tend to overlap. So typically, different observability tools excel on each.
Output is documented in PART 2 of the book.
An alert may feel like an input, as you start from it. It is not an input as it’s a trigger you create based on the values of the data types. For example, you create an alert when certain log events occur, certain property changes and certain metrics threshold being crossed.
Review this diagram. What do you notice?
| Metric | The definition is it is produced at regular intervals, even if the value is constant. That’s why state is a metric, not a property. Unlike property, a metric is not editable by user. Its valued is not entered by users. It’s generated by system. A metric always originates as a number. It may be translated into a string for ease of understanding. The number could be a code, whose description is a string. For example, “-1” means no limit. By the way, I prefer infinity to indicate no limit as that seems more natural. It can be a raw metric or computed metric. A computed metric is derived from existing metrics and properties. An example of a computed metric is a super metric in VCF Operations. There are 3 types of metrics (contention, consumption and context). They are explained further in the vSphere Metric book. If it crosses a certain threshold, it can trigger an event or generate a log message. From events, we can create a metric, such as a count of vMotion in the cluster. If the number does not match expectation, we can trigger an alert. A daily proactive dashboard showing the trend across hundreds of clusters may give a clue if a problem will happen today. In this case, the proactive work avoids the alert to begin with. | ||||||
|---|---|---|---|---|---|---|---|
| Property | This is the opposite of metric, as it does not happen in predictable interval. There are 3 types of properties:
Property change is a type of event, which can trigger an alert. Since not all properties are important, the significant of the event is also impacted. For examples:
Number of ESXi hosts in a cluster is a property as the cluster is configured with that. Number of running ESXi hosts is however a metric. | ||||||
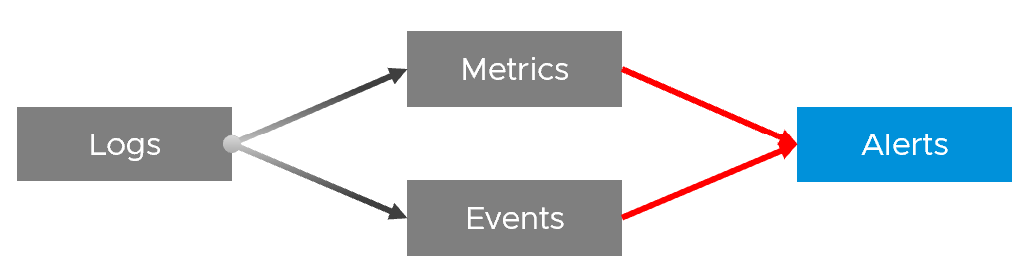
| Log | A log is a raw message, typically produced by developers directly.
Numbers can be extracted to form metrics, while text can describe an event. Metrics and Events can then trigger alerts. >99.9% of the logs are not useful. How do you minimize the cost while maximizing the benefit? | ||||||
| Event | An event is a record of something that happened. It could be bad, neutral, or good. It could be planned or unplanned. The bad ones may warrant an alert. Unlike a metric, it does not happen on regular interval. An event has a start time. It might also have an end time. For example, threshold bridged is an event. If the value drops below the threshold, the event ended. | ||||||
It can be a setting change, a state change, or a label change. A label is “external”, meaning it is not an inherent property of the object. Events also trap the activities performed on those objects. For example:
|
In addition to the 4 basic inputs above, you need the following in certain situation:
| Traces | A trace is a record of code in-motion. Some can produce numbers, which are metrics. This is needed is low level, function-level troubleshooting. By the way, function tracing can be traced back (pun intended) to Solaris 10 Dtrace, back to 2005! |
|---|---|
| NetFlow | A NetFlow captures path taken, typically flows of network packets. It shows networked relationship and can produce metrics. |
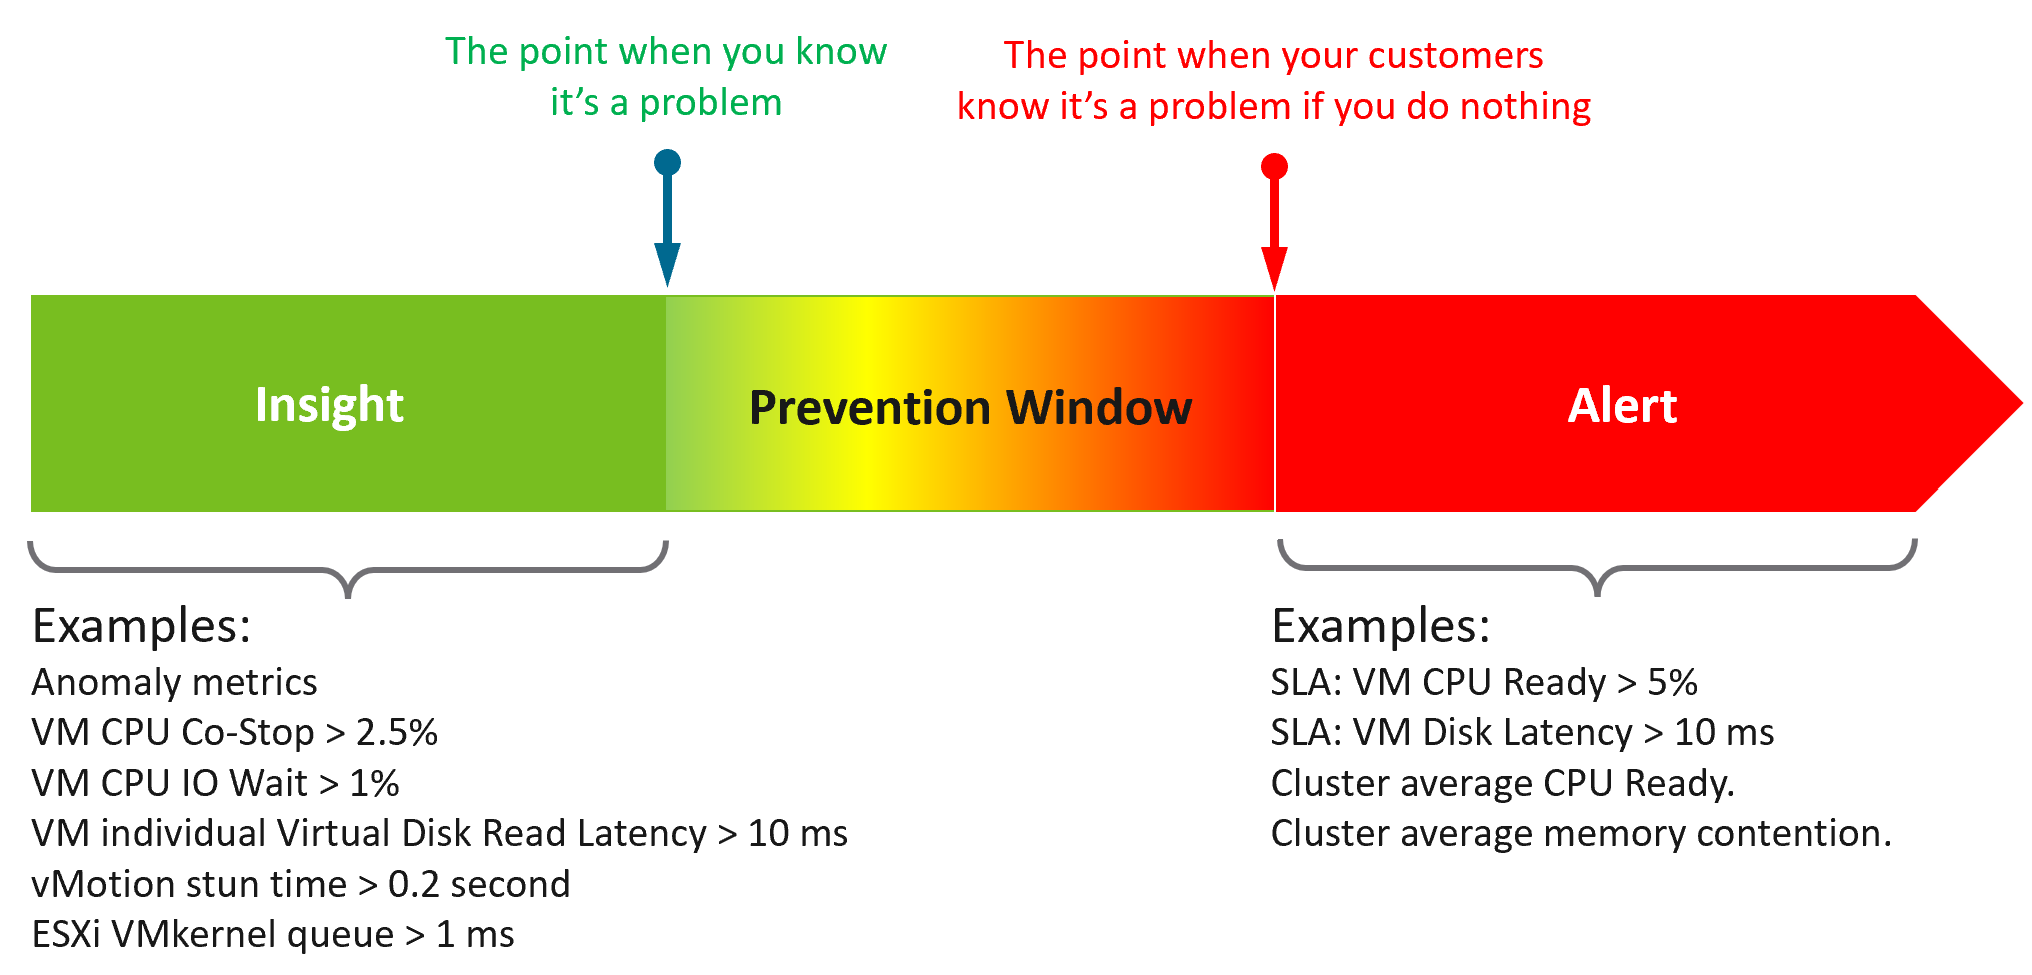
Symptom | Alert | Insight
The reason you have alert storm is you treat alert as To-Do List. You want to be reminded of everything so you do not miss anything.
Analogy: Think of Alerts as your Accident/Emergency Department. You can have dozens of departments dealing with all sorts of illness, but only 1 central location for urgent matters. So where are your “dozens of departments” in your private cloud? Some focus on security, some on storage, some on capacity, some of performance. If you monitor your blood pressure, weight, regularly, why not have daily health check for VCF?
Alert hopefully starts with symptom, a minor and non-urgent issue. This gives you a window to catch during your proactive daily health check.
Mild symptoms that do not go away over time becomes an alert, as it has become urgent.
While symptom and alerts are closely related, insight is something else altogether.
-
The former is bottom up, the latter is top down. You typically gain an insight from a collection of alerts and symptoms, plus additional context. Insight uses many more metrics, especially the supporting metrics.
-
Insight is much harder to realize as it requires both technology expertise and environment experience. It deals with “hint” instead of issue. You need to know the overall architecture and what’s happening operationally, so you can derive an insight from the alerts and symptoms.
-
Insights complement alerts, not replace them. Insights do not have the concept of “auto close” as they do not involve help desk tickets
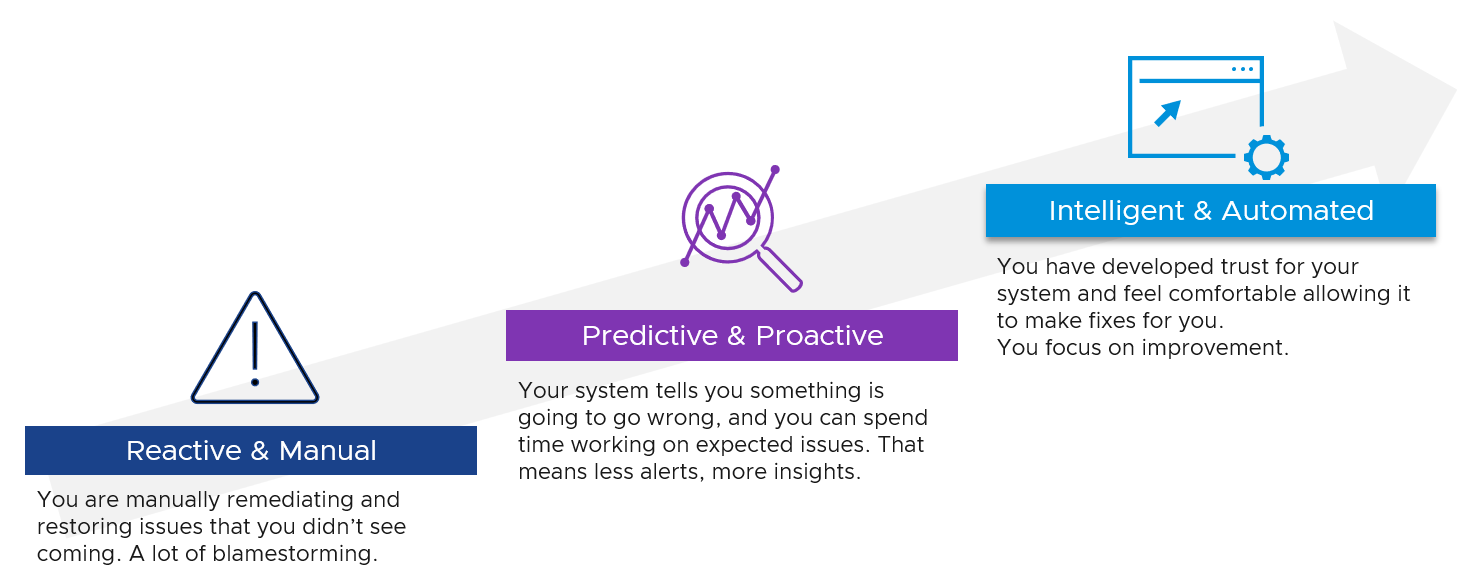
Proactive Alert is an oxymoron.
Proactive means you’re acting before something happened which forces you to react. The moment you react, you’re reactive. Just because the business is not impacted does not make it proactive.
For example:
-
vSAN shows high disk latency on Sunday midnight. You’re called to investigate, before business become impacted on Monday morning. You fixed it on the weekend and save the business.
-
Does that “weekend warrior” make it a proactive alert?
-
What if the same alert happens during business hours and business impacted? Does that make it reactive?
Alerts rely on threshold, be it dynamic or static. A Threshold has an inherent limitation. It misses the big picture, as it can only see what has crossed the threshold.
 For one object that reached this threshold, there could be many just beneath the level. Think of an iceberg. The small portion above sea level, the tip of the iceberg, is an alert. It does not provide the total picture. In fact, the chunk beneath the surface is far larger.
Insights answer much harder questions, which are typically fuzzy hence they can’t be defined as alerts. Examples of questions are:
-
Are we being attacked? Are they events and activities that happens in parts of our environment where they are not supposed to happen?
-
Is performance degrading? Is there any common pattern and cause?
-
Is the environment behaving differently to what we expect?
Insights focus on the underlying problem. They also help buy you time so you can address the problem before the users complain. In the following example, the alerts use the SLA metrics and threshold. Insights require more granular metrics and supporting metrics
 What do you think of the preceding example? Would it result in less alerts and less reactive troubleshooting?
The main limitation of proactivity is false positives. It also requires daily operational discipline.
An Insight is useless to those who are not familiar with the environment. The numbers shown by an Insight should match reality, and only a person intimately involved with the actual operations can sense if the numbers are not correct.
Let’s take an example: the insight shows your total IOPS throughput is low. If you don’t know what to expect on that day, that number is meaningless. But if on that day you expect high throughput because your company is in the retail industry and it’s the day before Christmas, then you know the sales are not happening as per expectation. Proactively check before your CEO complains why business is not doing well.
| Alert | Insight | |
|---|---|---|
| Goal | To fix. You’re ill. | To prevent. You’re not sick. |
| What it is | A formal event with ticket recorded in the system. May have an incident associated. | Not a formal event. No incident. |
| Situation | Business or operations may be impacted. | No impact. |
| Known problem. You may not know the root cause though. | No known problem. | |
| Urgent. You must look at it today. | Not urgent. Can do on the next business day, or even next week. | |
| Hopefully not important issue | Important issue | |
| Nature | Reactive and unpredictable. | Proactive and regular. Daily, weekly, monthly. |
| The system tells you. Response is mandatory. | Response is not applicable as you initiate. | |
| Person | Low expertise. Follow steps or SOP. | Deep expertise. No steps to follow. |
| Does not need to know the overall environment and workload well. | Must know both the environment and recent operations. | |
| Metric | Focus on primary metrics (the What). | Focus on both primary metrics and secondary metrics (which explains why primary metrics are bad) |
| User Interface | Start with Email or notification on your mobile phone. | Start with a big dashboard on desktop. |
| A specific alert. You work bottom up. | The big picture of the overall environment. You work top down. |
Lagging Indicator | Leading Indicator
| Lagging Indicator | Leading Indicator | |
|---|---|---|
| Used in | Alerts. Reason is alert is your fallback, if you forget to proactively address. | Insights. |
| Focus | “Dining-area” metrics. Metrics that impact customers. | “Kitchen” metrics. Underlying metrics that impact the primary metrics. |
| Technicality | Simple to understand the meaning (not necessarily the underlying formula). | Tend to be low level metrics that require deep technical knowledge. |
| Persona | Level 1 and Help Desk. | Subject Matter Expert. Familiarity with the environment is required. |
The 2 Sides of VCF
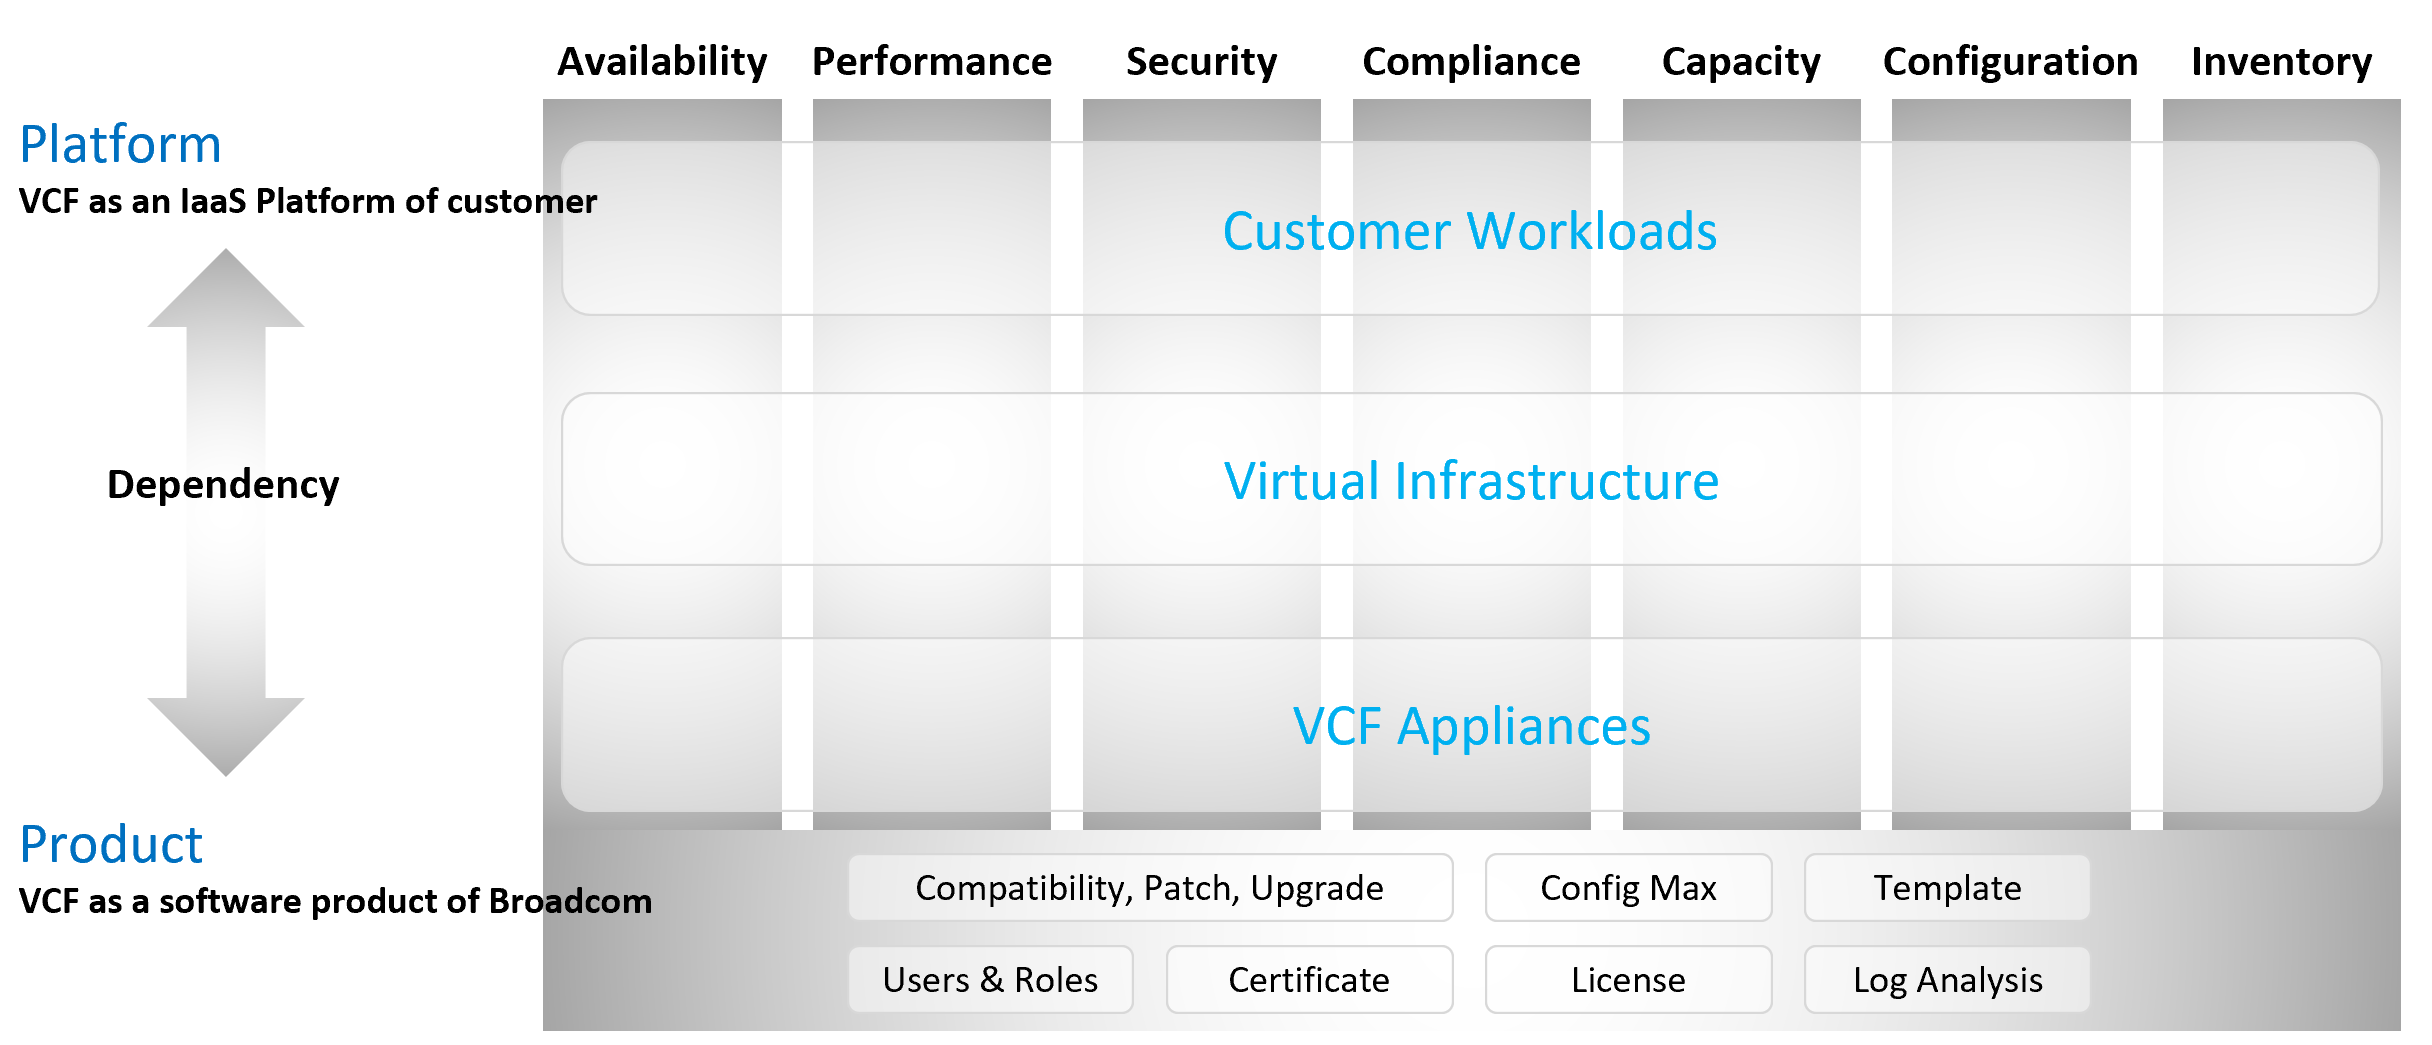
Think of it as “no workload” vs “with workload”. Workload means the customers VM, not your infrastructure software.
Infrastructure software are virtual appliance or K8 pods that you need to have as part of your private cloud platform.
VCF belongs to a category of software called SDDC. You use the software on commodity hardware and create a private cloud on your premises. This is not so obvious as it’s the only product in this category.
Because of its nature as a data center defined as a software, there are 2 sides of VCF:
-
As an IaaS platform of customer.\
This is what the application team care.
-
As a software product of Broadcom.\
This is what the infrastructure team care.\
The software takes the shape of one of these 2 forms:
-
Virtual appliance. Examples are vCenter Server and NSX Edge
-
OS kernel software. Examples are ESXi VMkernel, vSAN and NSX kernel modules.
-
The 2 sides can impact one another, requiring you to see them as one. You need to manage all aspects of operations such as availability, security, and inventory.
-
There are 2 layers: consumer and provider.
-
The consumer layer is where VM and containers run.\
This layer consists of 3 sublayers (application, Guest OS, and virtual machine).\
VCF scope ends at VM (BIOS & motherboard) and Tools, as the Guest OS is largely outside the influence of VCF the product.
-
The provider layer is the virtualized platform (compute, storage, network).
Footnotes
-
Marketing architecture. A jovial reference to beautiful PowerPoint based diagram that hides implementation complexity. Amazon jungle looks green and beautiful from 10 thousand feet, but on the ground it’s a different matter. ↩
-
Day 2 will eventually hit technology refresh, which could be major overhaul in architecture. This will take you back to Day 0 as you need to plan for the new world. ↩
-
For consistency with other VCDX certifications, we should call it VCDX Operations Management. I use VCMX to drive a point. Certification wise, it can start at VCP level, such as VCP Operations Management. ↩
-
I don’t use MELT as Property is more fundamental than Trace. It also misses NetFlow. ↩