SP5 Framework
VCF as the core of your private cloud require a new IT operations management framework. I call it The SP5 Framework. It’s the IT Business Strategy supported by its 5 components (Policy, Pillars, Process, People, Platform).
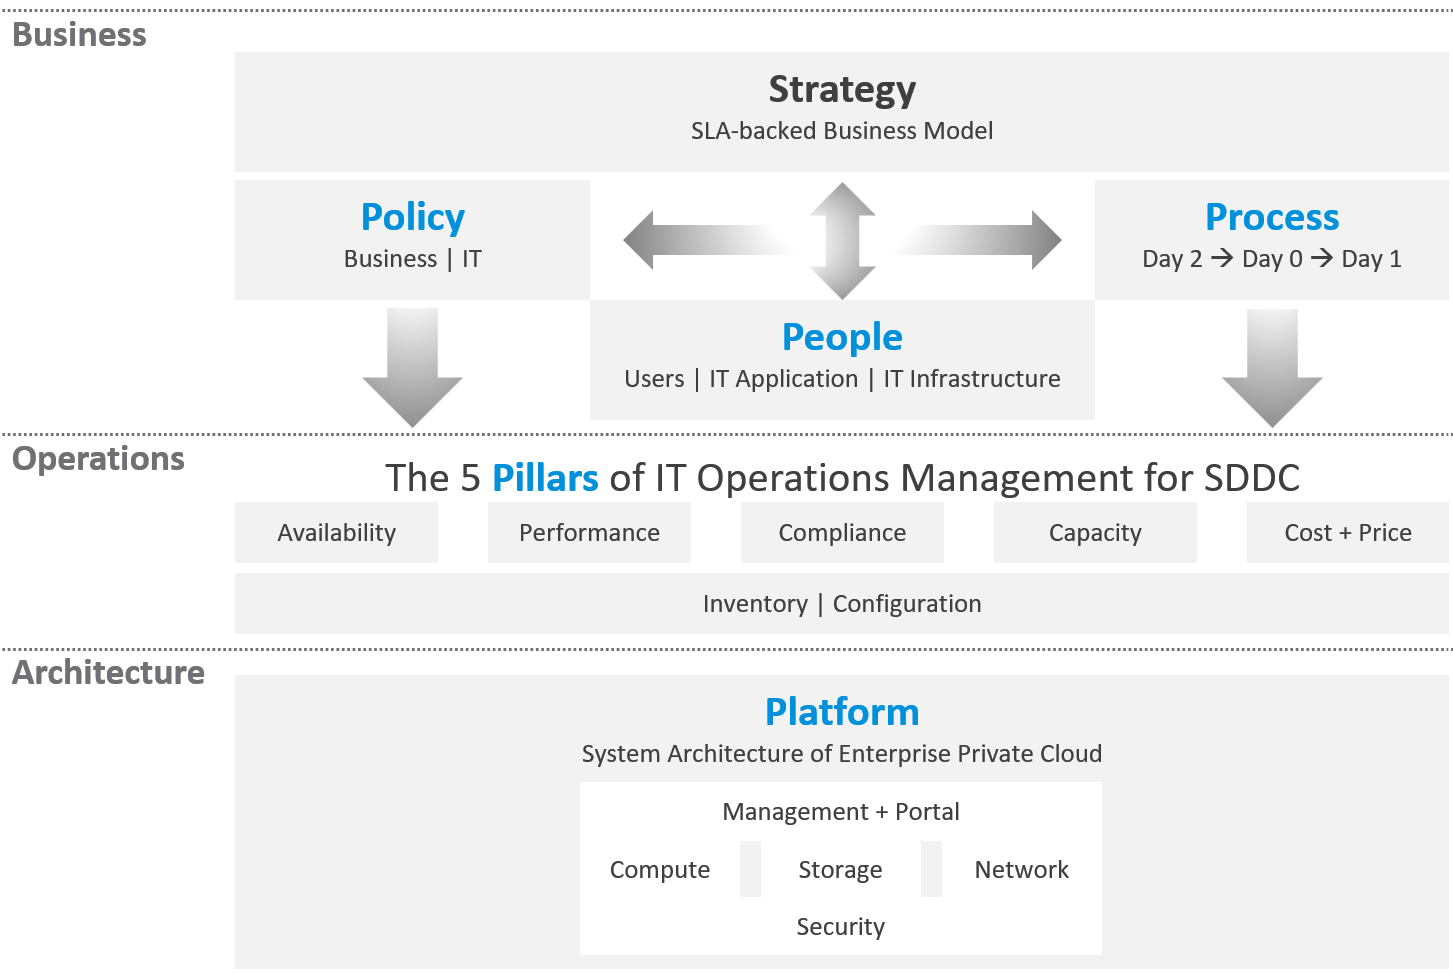
There are 5 pillars of operations management. They are the management disciplines a CIO directly cares about, which is why you need to ensure they are “good”. To achieve that, the people (IT professionals) is organised accordingly. Processes and policies are then put in place to balance between governance and agility. A complete set of policies and SOPs answers “who does what when where and how”. Finally, you implement all these using technology product, such as VMware Cloud Foundation.
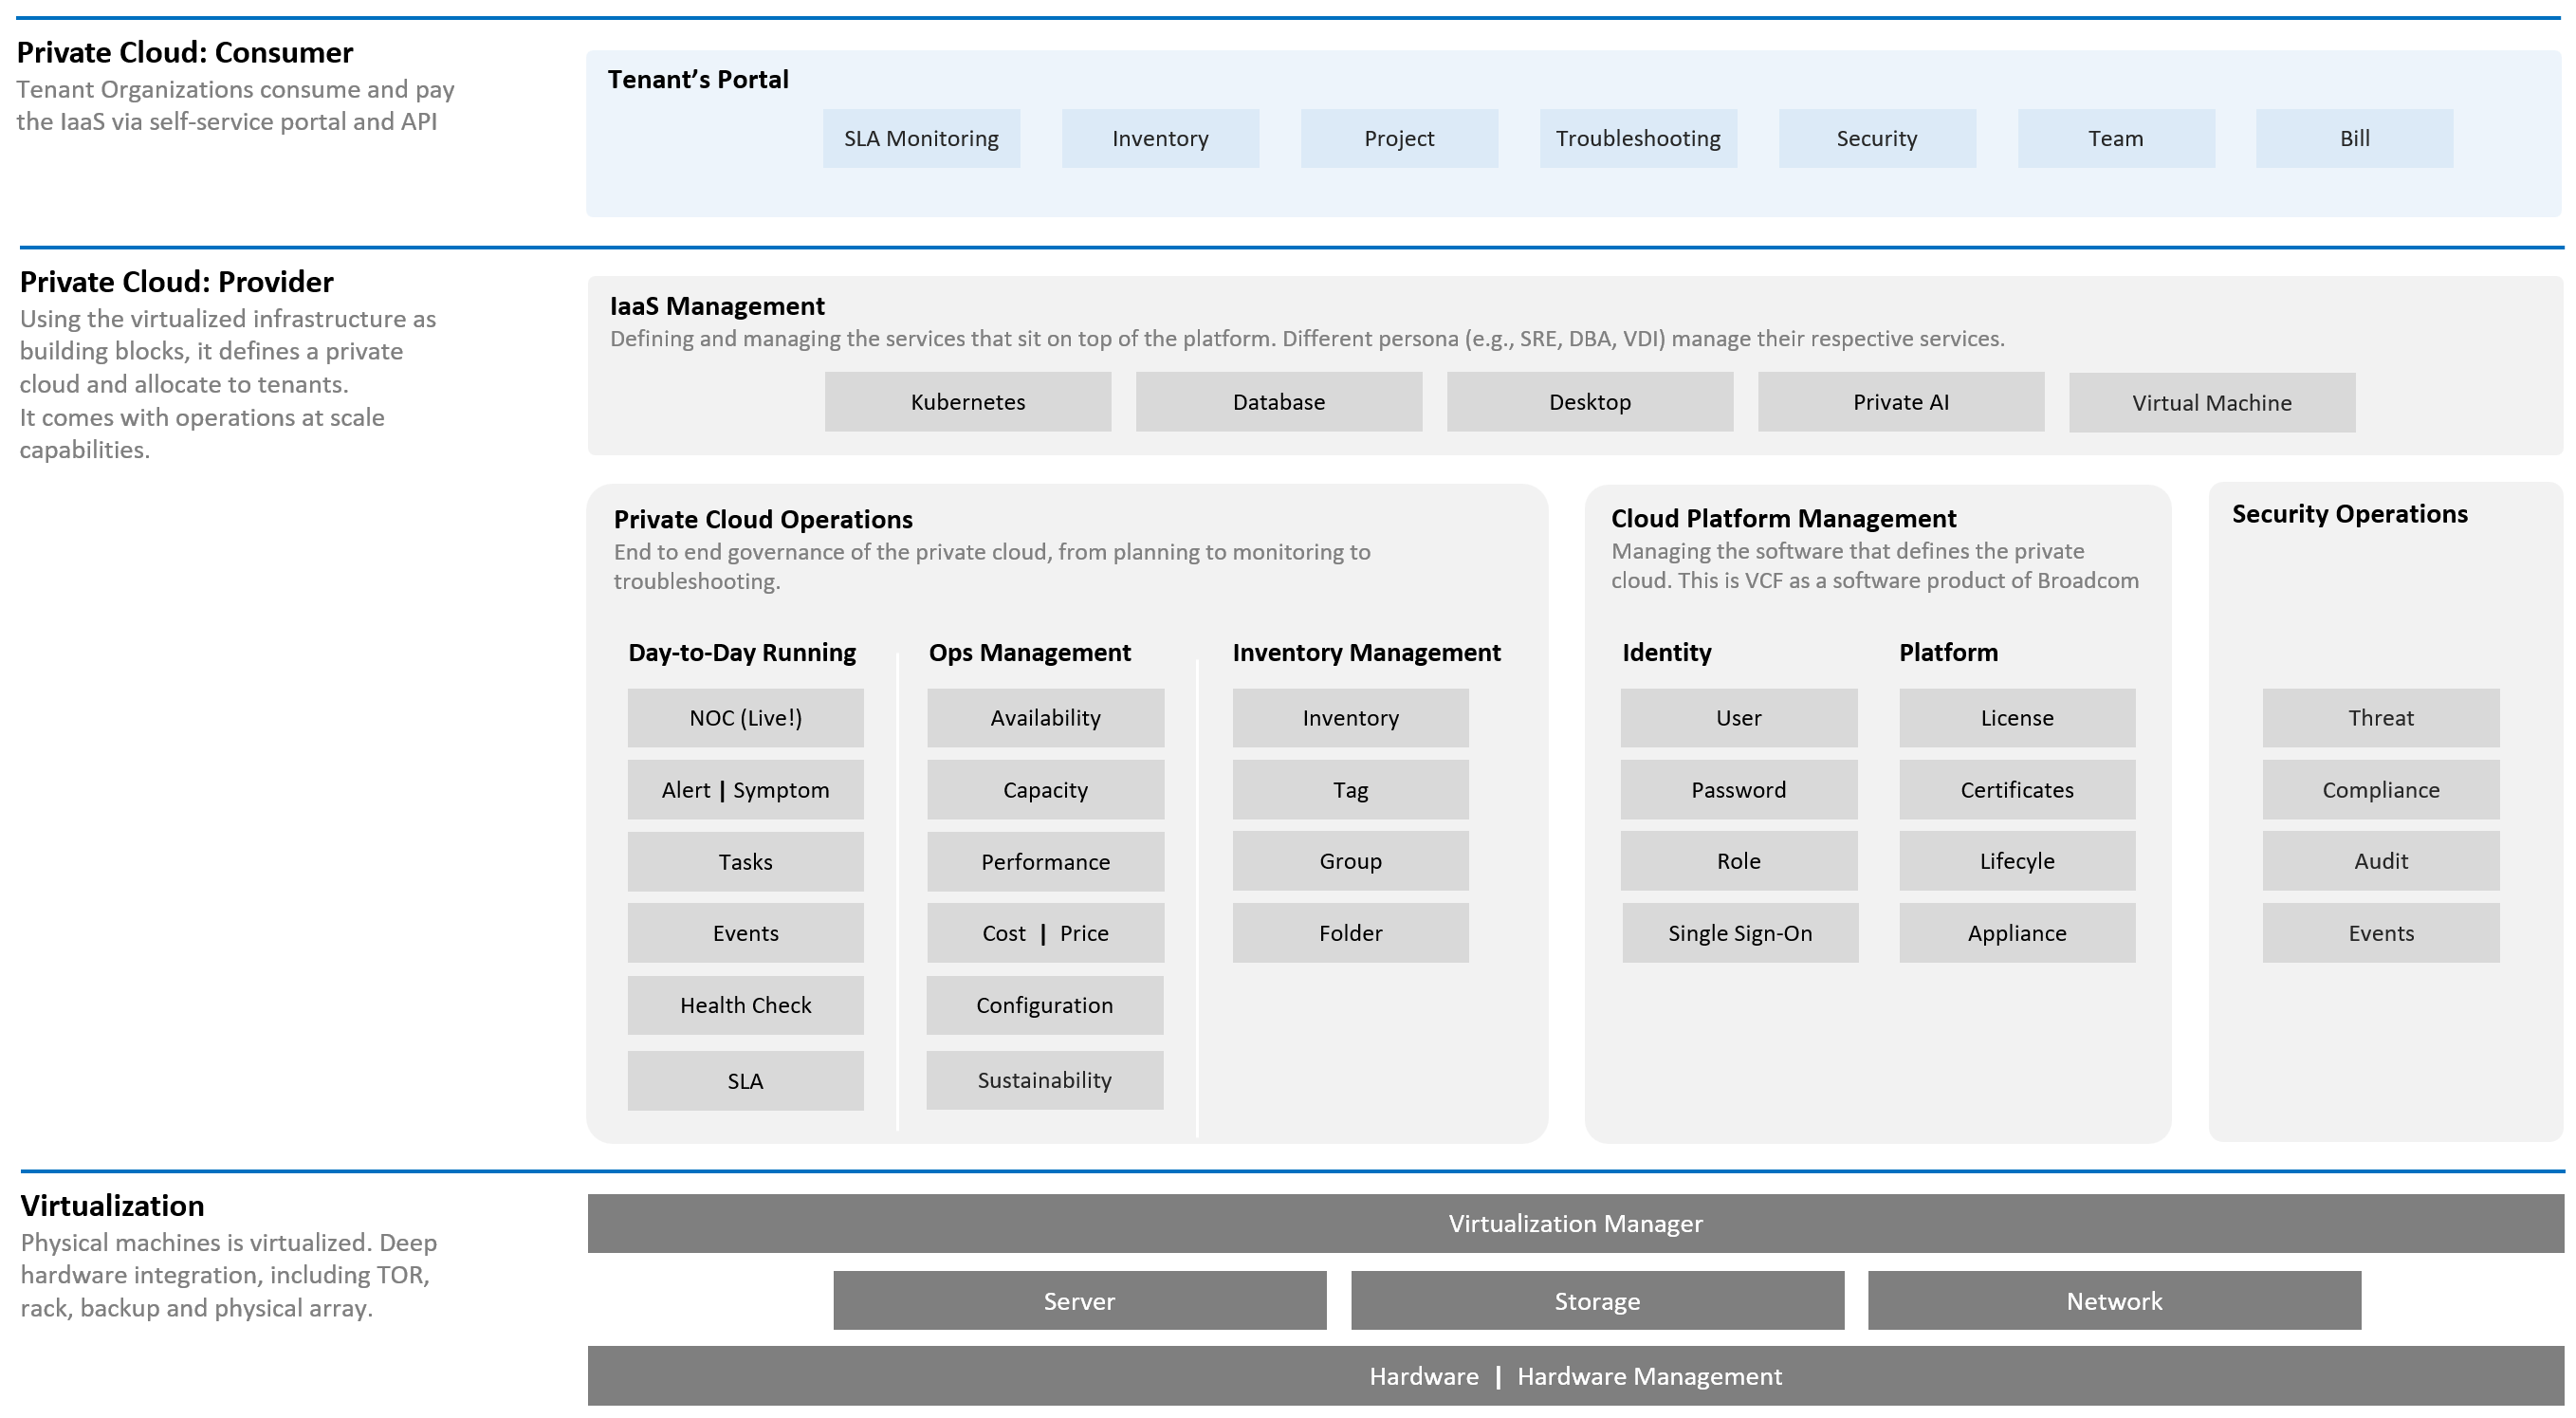
What are the capabilities of a private-cloud-ware? How would you explain to your CIO and CTO?
Using a vendor-neutral diagram, we can say that virtualization is the foundation technology that enables the creation of flexible pool of resources.
What do you manage, actually? What do your customers want you to manage? How do you manage what you need to manage?
The most basic thing is you need to have visibility into the environment. There are thousands of objects (e.g. VMs, applications, firewalls) with complex relationships and interdependence. Inventory gives you this. That’s why it’s the first box in the diagram below.
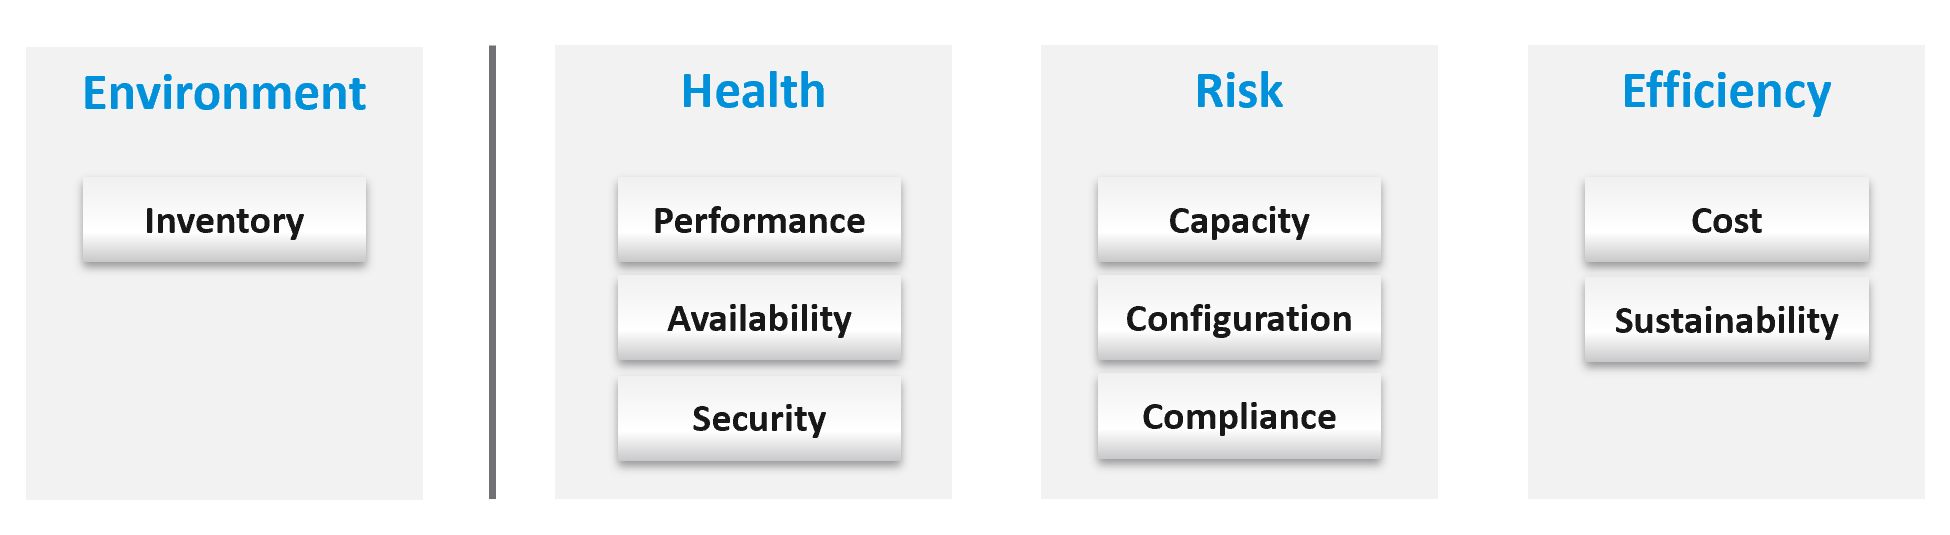
Once you know what you manage, you can then move on towards making sure those things are healthy. If there is no real problem, then you move to address potential problems. If there is no risk, then you look for optimization.
How do you know you’ve mastered operations management? What’s the acid test?
When you can go on long vacation in peace, without the worry of urgent escalation calls asking for information or decisions that only you can make or provide.
See Part 4 of the book on details of Health.
Why a New Framework?
Before I came up with the pillars of operations, I studied other IT frameworks as it’s easier to use existing as adoption will be faster. There are many frameworks in running the business of IT. ITSM, IT4IT, ITIL, COBIT, Microsoft Operations Framework, and many others where you can learn about overall IT Management1. In this book, I’m focusing on areas that are related to VMware Cloud Foundation, and only on Day 2.
The philosophy of ticket and incident-based operations are reflected in these frameworks. I’m not against the principle of using tickets as a unit of work, but most implementations have been disappointing to users. That’s odd as the very purpose of the help desk is to help the users. When you call your telco, bank, airline, etc. for support and you get a ticket, how has the experience been to you?
It’s terrible.
So why impose that bad experience to your customers?
The SP5 Framework differs fundamentally as it aims to do away, not just minimize tickets and incidents. The proactive, insight-based operations require a small number of seasoned IT professionals with deep technical expertise and knowledge of the business. It does not work on a very large number of teams spanning many departments, each following rigid and siloed policies.
I found many frameworks to be heavy. This means they are complex and costly to operationalize. ITIL 4 has 34 management practices for the entire IT Business. I find 34 are simply too many to manage. You end up managing the management. This defeats the purpose to begin with.
| Service Management (17) | Technical Management (3) |
|---|---|
Business Analysis Service Catalogue Management Service Design Service Level Management Availability Management Capacity & Performance Management Service Continuity Management Information Security Management Service Request Management Service Desk Incident Management Problem Management Change Enablement Service Validation & Testing Service Configuration Management Release Management IT Asset Management | Deployment Management Infrastructure & Platform Management Software Development & Management |
In addition to managing 20 types of services and technologies, you also need to manage 14 general management:
-
Strategy Management
-
Portfolio Management
-
Architecture Management
-
Service Financial Management
-
Workforce & Talent Management
-
Continual Improvement
-
Measurement & Reporting
-
Risk Management
-
Information Management
-
Knowledge Management
-
Organizational Change Management
-
Project Management
-
Relationship Management
-
Supplier Management
Even with 34 management practices, ITIL 5 merges Capacity and Performance as 1. I see them as distinct disciplines, done by a different persona and are having different processes. This book covers both disciplines in-depth, while ITIL 5 does not.
Duplication
Frameworks have lots of big words that are subject to interpretation in the real world as you try to implement them. Some of them also overlap, or even mix up concepts altogether. For examples:
| Monitoring and Alerting | They are not peers. When you monitor a system, you will arrive at one of these 3 conclusions:
Alerting is one of the 3 ways for your monitoring system to communicate to you. You interface to the tools via alerts, dashboards, and reports. |
|---|---|
| Changing vs Optimizing | They are not peers. Optimizing is part of changing. You can’t optimize without making any change at all. You change something because it is broken or it needs improvement. |
| Operating vs Supporting | Support is part of day-to-day operations. It mostly revolves around inquiries and incidents. If you’re doing operations right, it also involves insights and proactive changes. |
| Automation and Orchestration | Automation is the “big item”. Orchestration is just one of the techniques for automation. It typically strings together a number of different scripts, which could be in different programing languages. |
| Measurement and Reporting | I’d rather call this Monitoring, as Measurement is a noun. Reporting, as covered in Part 2 Chapter 1, is just one way for computer systems to talk to humans. The other two are alerts and dashboards. |
| Monitoring and Event Management | Monitoring is a process, an activity. It is not something you manage. The diagram in the next section shows how Process and Pillar are related. Unlike alerts, events could be neutral or even positive. An event is an accounting of something happened, and related to tasks or activities. Just like a metric is an accounting of utilization or contention. A log is a record of something that happened. You don’t manage metrics, event, logs as you don’t have full control over them. So events are just inputs to your operations. It’s one of the 5 data types to monitoring. The other 4 are metrics, properties, logs, and netflows. These 5 measure the observability of an architecture, and they feed into your monitoring tool. Their values or meaning are defined by the context of the pillar. |
| Operations and Governance | They are the same. You manage operations by having governance. Operations management covers risk (availability risk, capacity risk, security risk) and applies control (compliance to approved configuration, clear accountability for each role, manage cost so they don’t overrun) . |
Complexity
There are many IT management areas that are not pillars of operations. They are either unnecessary or just providing support to Operations Management. For examples:
| Service Level Management | An SLA is not something you manage; it is a by-product. You manage availability, performance, compliance, and if you do that well you will pass your promised SLA. |
|---|---|
| Service Continuity Management | This is part of your architecture, not something you manage. A good architecture is a living system, as it’s designed to handle updates and upgrades without compromising the SLA. |
| Demand Management | This is part of Capacity, as the art of capacity management is about making sure there is just enough supply to meet demand. Both insufficient and too much capacity are problems. |
| Continuity Management | This is part of Availability, which cover snapshots, HA, DR, replication, active/active, back up, etc. |
| Incident management | To me, incident (e.g. your website goes down) and problem (e.g. your core router hit a rare bug) are not something you manage. You manage the impact, such as availability and performance. As part of availability, performance and compliance management, you are bound to have incidents, which were caused by problems (e.g. incompatible configuration, bug). You should focus on why you have so many availability, performance, compliance, configuration, or capacity problems. By reducing them, you will reduce your incidents. Aim to minimize incidents and problems, instead of accepting their prevalent existence as acceptable and invest on their management. |
| Service request management | |
| Problem management | |
| Service Desk | This is a technique, a solution you design as part of your monitoring strategy. While the team needs to be managed, it can span thousands of people; it is not a pillar of operations. |
| Continual Improvement | To me, this is more culture, realized as a set of processes, policies and structures. See Kaizen as an example. While it’s important, it’s not a pillar of operations |
The Pillars
What do your CIO actually care? Because that is what you will manage.
Well, the first thing your big boss care is availability. You have neither performance nor security issue if the system is down. Hacker cannot even login to an vCenter that is not even available.
Next, just because something is up, does not mean it’s fast. Your boss can argue that your system is so slow it is basically not available to users. So you need to manage performance**.**
Next, just because the system is up does not mean it’s secured. Security and compliance matter.
There are 5 pillars of operations. Each pillar is an individual unit of management. They represent individual disciplines and are compatible with one another.
-
Availability management
-
Performance management
-
Security and Compliance management
-
Capacity management
-
Cost and Price management
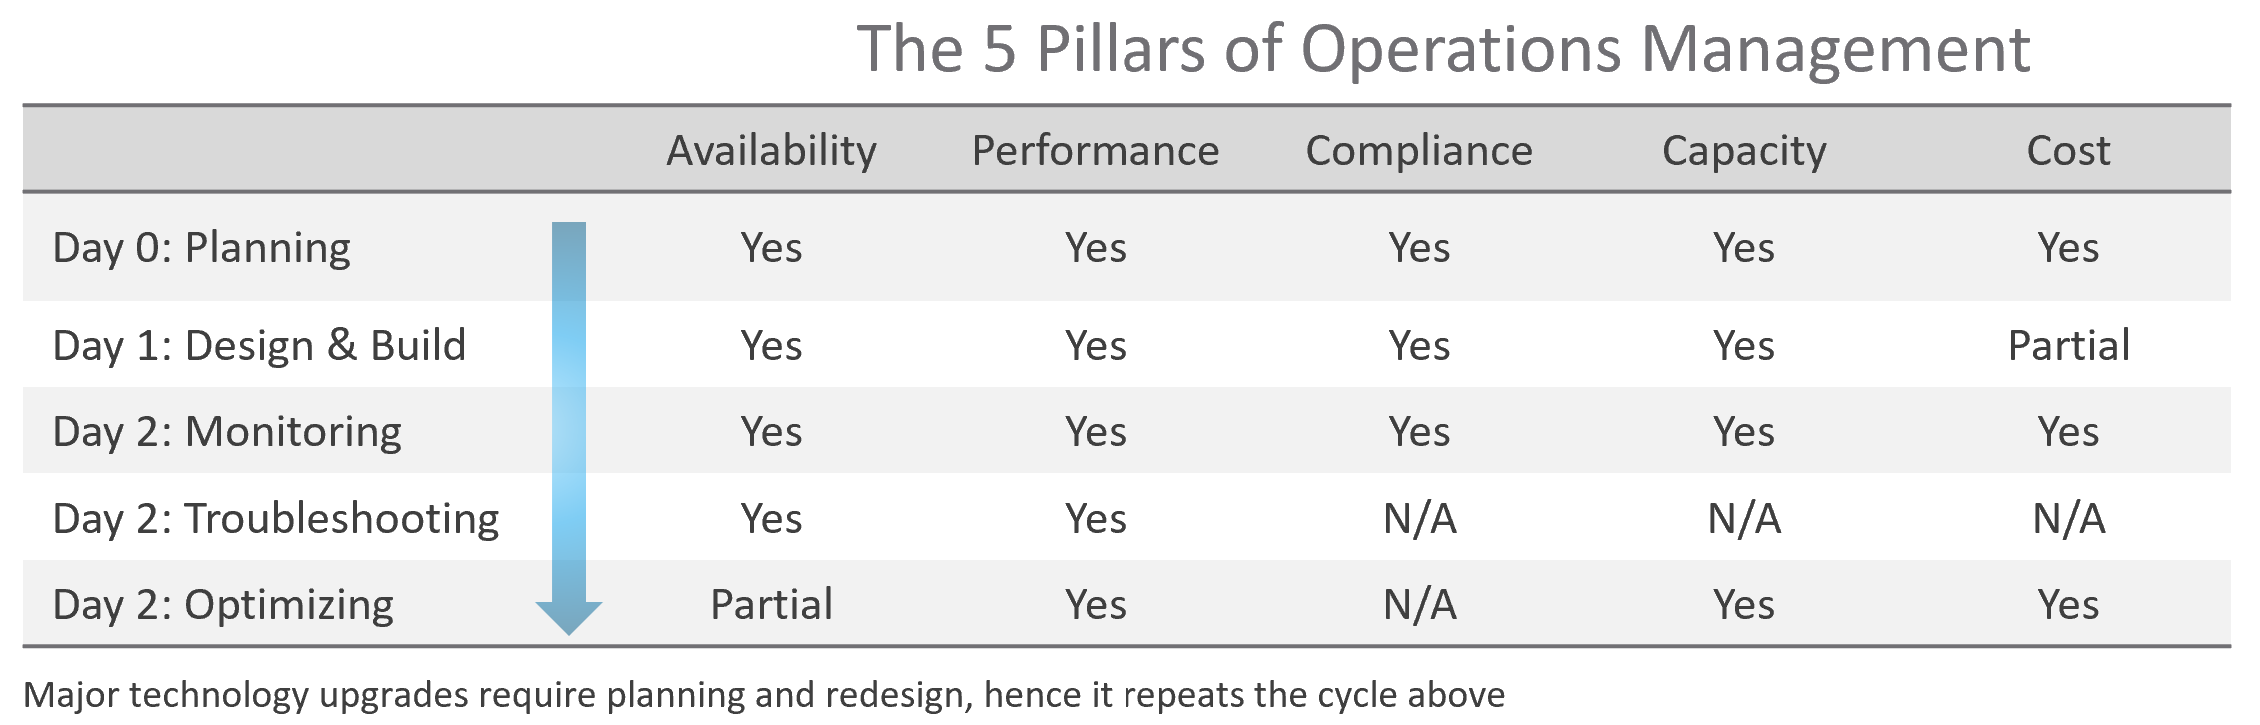
How do manage them? What are the key processes required to run multi-cloud operations?
The following diagram maps the process and the pillars.
The complexity of each pillar depends on the technology: for example, vSAN capacity is more dynamic than a traditional SAN. In vSAN, changing the storage policy could create a sudden spike in consumption.
The 5 pillars of Operations Management are interdependent. Knowing the relationship is as important as knowing the individual component. Relationship matters as the symptom and the root cause are often two different things. A performance problem could be caused by a configuration problem, such as an outdated configuration or incompatible versions.
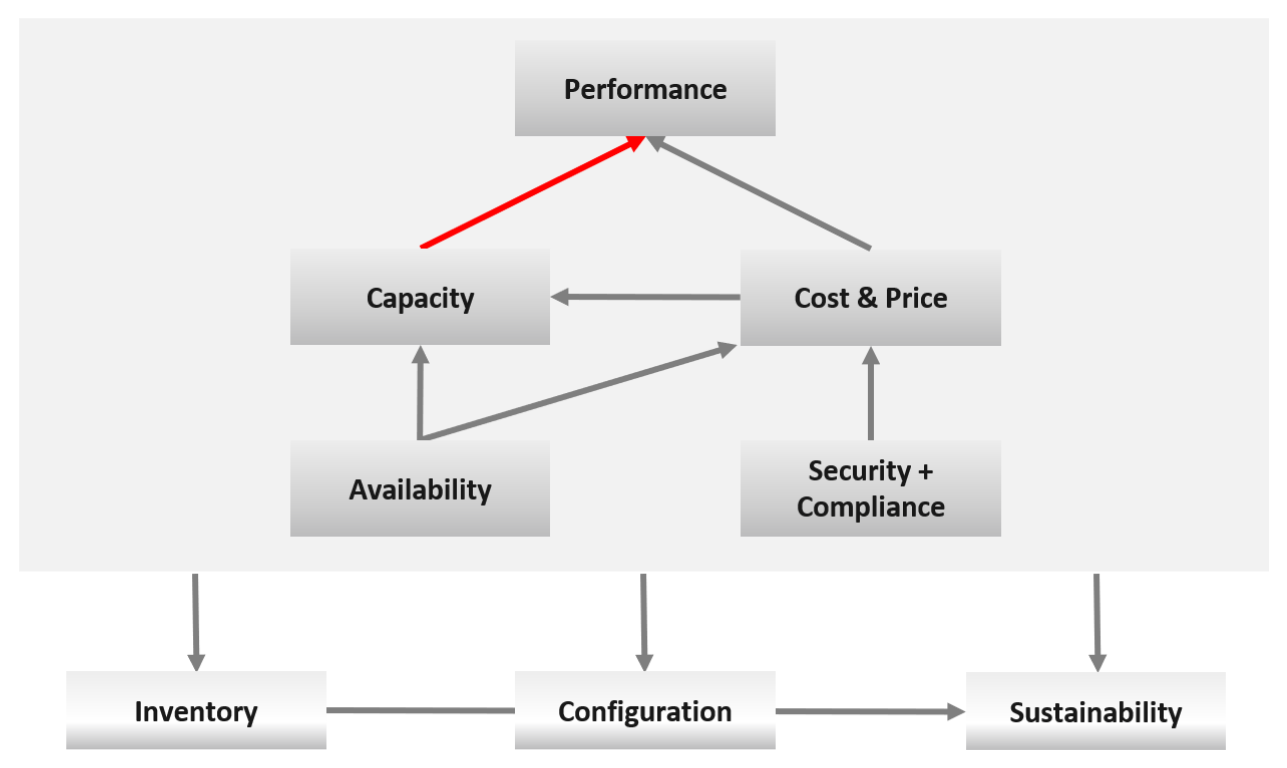
I chose a red line as it’s a complex relationship. As Capacity goes down, Performance remains steady. As Capacity drops below 0%, performance suddenly takes a hit.
I put Security and Compliance together outside as it’s typically managed by a different department. Their scope extends beyond the Data Center to areas like physical building security and employee work-from-home solutions.
Lines with arrowheads means there is impact:
-
Availability increases your cost, as you’re adding extra resources for no capacity benefit.
-
Compliance typically increases your cost. The more compliance requirements you must maintain, the larger the operational overhead involved in managing and measuring it.
Lines without arrowheads means there is relationship but not impact:
-
Availability and Capacity should not overlap. You calculate capacity after taking out availability.
-
Inventory and Configuration do not impact each other.
The following diagram provides more details.
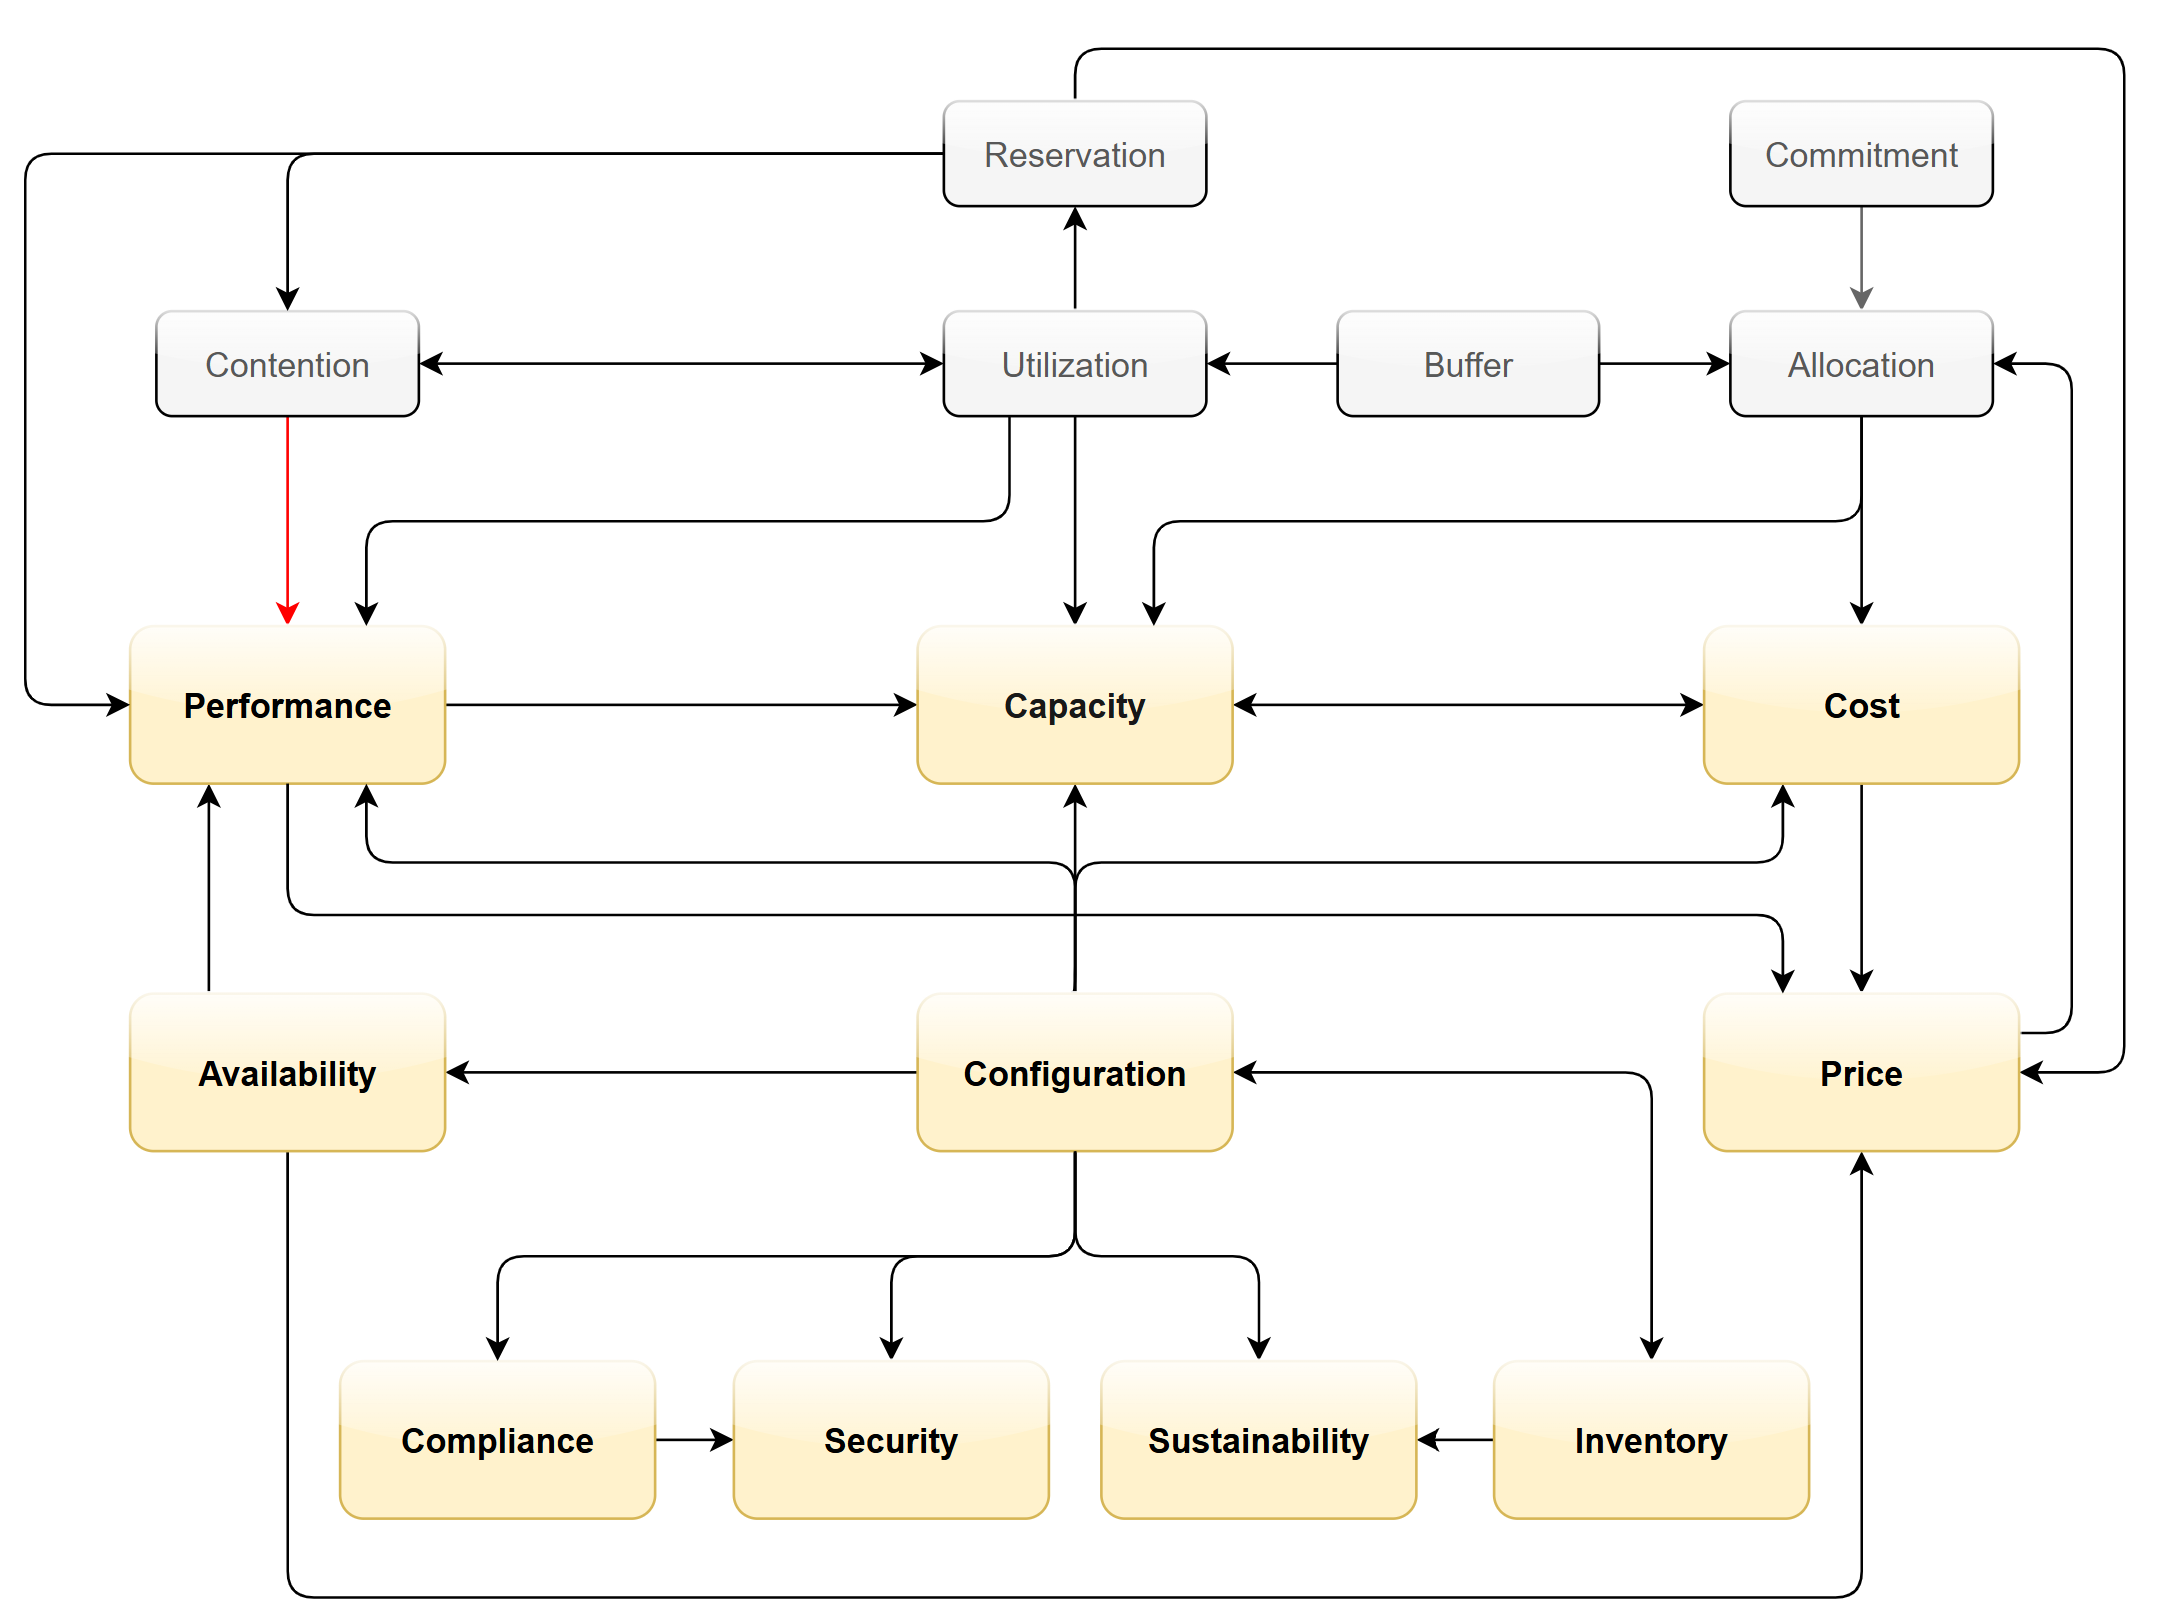
Let’s elaborate on each pillar.
Availability
There is a spectrum of availability solutions, including snapshots, back up, redundancy, fault tolerant, clustering, and SRM. Each can have impact on cost. Most of them require additional resources so they must be part of capacity planning, so they do not impact performance. For example, load balancers and replication needs to be accounted for.
You also need to include the potential workload caused by DR events in your capacity planning.
There are two metrics for availability:
-
Actual Availability (%)
-
Operational Availability (%)
The first one simply measures the fact as it is. It does not consider the HA (high availability) configuration and scheduled down time.
Operational Availability complements it by considering the above. So its value will be higher, as it reflects the operational impact. This is also the number used in the SLA.
The higher the Availability SLA, the higher the cost of the service. There is a big increase for each additional 9 of availability. Five 9s of availability costs 10x more than four 9s as the margin of error is reduced by 10x.
Why isn’t there a line to Performance?
Availability events like a host outage, when accounted for in the design, should not impact performance, as it does not lead to a drop of usable capacity.
Performance
Ever heard of “the system is so slow it is as good as down”? Just because something is up, does not mean it’s fast. On the other hand, if you have catered for HA, you can have part of the system down with no impact on performance and capacity.
From day-to-day operations, performance is the most important pillar of operations. This is why the next chapter is Performance Management.
Performance is often confused with capacity as “more work done means good performance”. This “more work” requires higher utilization. This simple thinking has drawback as it associates idle with low performance.
The primary metric for performance is contention. You don’t have performance issues if there is no contention. One common cause for contention is utilization over capacity or limit.
Capacity
There are 2 types of capacity:
| Short Term | Long Term | |
|---|---|---|
| Performed by | Day to day Operations | Capacity Planner |
| Availability Management | Highly relevant | Not so much |
| Performance Management | Highly relevant | Not so much |
| Cost Management | Not so much | Highly relevant |
| Timeline | Present. This means now or today. It cares less about tomorrow. | Future. Depending on the lead time to add capacity. If procurement is required, this can be months. |
| Projection is not applicable. | Projection is mandatory | |
| Scope | Resources that can be provisioned within an hour or so | Resources that are not yet purchased |
| Focus | Hardware | Software (as they are more expensive) |
Short term capacity is related to performance. They are interdependent; hence one is often mistaken for the other.
Capacity is affected by Performance as it needs to consider contention metrics not just utilization. If you can’t satisfy existing demands, then you won’t provision new workload, hence capacity is practically full. The utilization metrics may not be high yet, but that’s a secondary consideration as you stop adding new workloads until you figure out why.
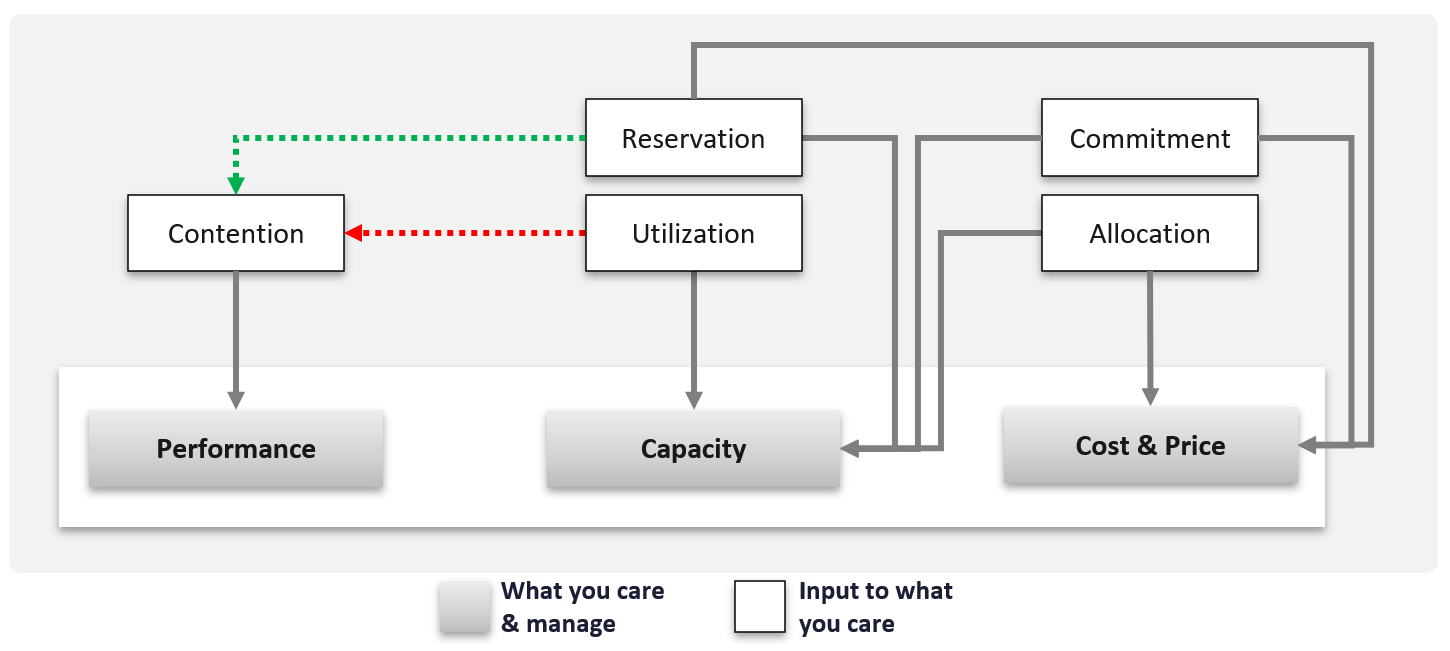
Capacity also considers demands that do not manifest yet. This is why you need to consider reservations and allocation. They also minimize the consumption to go too high and cause contention.
Price can help address capacity. The best way to address oversized VMs is having a pricing plan that encourages smaller sized VMs. If the price is free then use a business justification to right-size instead.
Using highway transportation as example: You do not add lanes because of congestion that lasts a short time or rarely happens.
But what if the workload is revenue generating? For example, during annual sales you expect a much higher demand that happens only 1 day in 365 days. Do you build permanent capacity for the rest of the 364 days? Are you able to provide a burstable capacity, either in the cloud or on-premises?
Applying the above into vSphere on-premises, perhaps on that special day you need to limit other workloads, power them off, take hardware from other clusters, or move workloads to other clusters.
It focuses on the consumer, while the long-term capacity view focuses on the provider. The short-term view answers questions that care about today. Examples:
-
“Can you deploy additional workloads?”\
The now part of the question is important, as the deployment is typically done by automation. You want to prevent the deployment if it will cause problem. This means you need to check both the present situation and the future situation.
-
“Can we take out resource providers temporarily?”\
Examples are putting ESXi hosts into maintenance mode, or doing a cluster upgrade.
Reclamation
Infrastructure team should not force their internal customers to reduce their own consumption. This is a hard political battle, as there are more developers than administrators in a typical large enterprise. A better way is to show the CFO the total cost of wastage, money that can otherwise be saved. CFO will simply hold the budget for new hardware, and force the respective line of business to optimize their current consumption2.
Compliance and Security
Just because a system is up and fast, does not mean it’s secure.
Security is related to but not the same as Compliance. Security covers issues such as attacks (be it by internal employee or by external threat). Compliance deals with configuration settings or values that may expose security loopholes or are required to conform to specific sets of standards. Compliance is closely related to configuration as you comply by controlling the values of specified configuration items.
Compliance is measured against both internal and/or industry standards. It’s also measured continuously.
In Security you worry about being attacked. This means you track malicious activities, such as inappropriate usage of administrator accounts, or denial of service attacks.
Compliance is binary: you are either compliant with your defined compliance requirements, baselines, or benchmarks, or you aren’t. Compliance is also unaffected by complex and qualitative affairs like resource contention and performance. For this reason, as a service provider, you should guarantee to your customers that you will be perfectly (100%) compliant with your own compliance benchmarks for all classes of service.
However, you only provide a compliance guarantee on what you manage. If you don’t provide the VM’s guest OS as part of the service, then you don’t manage compliance for it, and you don’t provide an SLA against it. If you do provide the guest OS, then you must also manage its configuration via something like Microsoft AD Group Policy.
Cost and Price
Last but not least: money.
Cost and Price are necessary in the transformation towards becoming a real service provider.
| Price | With hardware becoming commodity and infrastructure becoming invisible, price has naturally become a common denominator among all IaaS providers. The general expectation is the price per VM is similar across cloud providers. One way to provide differentiated pricing is SLAs. While Price should be higher than Cost, it can be set independently of cost. Use discounts and progressive pricing to set the correct price for the right terms and conditions. Progressive pricing will also discourage oversized VMs from being provisioned in the first place. It’s easier to handle then, rather than once VMs are already in production. At an individual VM level, the better the Performance SLA, the higher the price customer is willing to pay, hence the term Price/Performance. |
|---|---|
| Cost | At the platform level, cost also goes hand in hand with capacity. The higher the utilization of the IaaS, the lower the cost per VM. Cost is separate from capacity as it can be optimized without reducing capacity. Cost and capacity can also go independently of each other. You can increase capacity without increasing cost via technology refresh. You can reduce cost without reducing capacity by lowering non-capacity costs such as the rate you pay for services. |
Non-Pillars
What’s missing in the 5 pillars?
-
Inventory.\
Inventory is simply what you have. Your responsibility is a lot more than accounting of what you have where and how they change over time.\
Inventory is just a by-product. You plan for capacity, with certain configurations. As you manage your cost & capacity, the inventory will adjust accordingly.
-
Configuration.\
Configuration is just a means to an end. You care about configuration only because it impacts security, capacity, performance, and availability. So it is often both the problem and solution to all the above pillars.
-
Sustainability.\
It’s covered by both capacity and cost. The only thing unique is the source of power. It’s simply looking at the same things, albeit from a different angle. It does not replace any of the existing pillars of operations management.
-
Reliability.\
This is just a characteristic of the system. Obviously, you want performance & available to be consistent, hence reliable and as you gain confidence, it becomes predictable. For example, if your website performance is not reliable or its uptime is not stable, you will troubleshoot from a performance or availability angle. There is no need to elevate the nature of something into an entity by itself. It complicates operations as you end up with overlap.
-
Recoverability.\
This is just a property of availability. Just like debuggability is a function of performance & availability.
-
*Manageability.*
This is just a property of configuration.
Inventory is related, but not identical to configuration. They tend to be confused easily. For example, “configuration maximum” actually means inventory maximum.
| Inventory | Configuration |
|---|---|
| An account of what you have where. So, the location, the movement, and the count matter. | Properties of your inventory. The location is just another property of the object |
| Inventory uses a small subset of configuration as the focus is on counting the number of objects. The majority of properties managed by configuration are not relevant to inventory. | The full set of settings, that you either intentionally set or have to accept. |
| Configuration drift is not relevant. | Configuration drift is important. |
| Inventory movement is important. | Inventory movement is not relevant. |
| Inventory has stock stake concept. This can involve physical or virtual items. | Configuration does not. |
Deals with distribution. You want to keep them “balanced”. e.g. number of VMs across all your vSphere clusters. | Deals with variance. You want to keep them minimal. e.g. version of VM hardware versions. |
Examples:
-
Number of VMs in a cluster is a part of inventory, not configuration.
-
Number of ESXi hosts in a cluster is a part of inventory. But it’s also part of configuration as that’s the design of that cluster. The cluster is configured with 8 ESXi hosts for a reason, and deviation may need to be explained in design documentation.
Inventory also deals with the change of inventory. A high number of churns is an inventory problem, not configuration problem. For example, as part of inventory management, you may want to check how many VMs were added, were deleted, were changed in your environment in the last 1 month.
There is a subtle difference between volume of change and the rate of change. Volume typically covers a longer period (e.g. 5 minutes, 1 hour, 1 day), while rate covers shorter period (e.g. per second, per minute).
To make inventory management easier, you typically group items by function. For example, in IaaS, you may have:
| Consumer Layers | Business Application (typically it spans multiple pods or VMs). Software (e.g. Microsoft SQL Server). Container or pod. VM (which could be in cloud). |
|---|---|
| Provider Layers | Cloud services (AWS something). Kubernetes. vSphere + vSAN + NSX. Physical (network, arrays, servers, UPS, racks). |
Proactive Operations
The following diagram shows how Level 1 Team (the frontliner) and supporting team (Level 2, Application Teams, etc.) work together to avoid alert in the first place.
The roles conducting the tasks are:
| Level 1 Team | Watch the Live Screens on the NOC wall |
|---|---|
| Manage alerts and perform the SOP associated with the alerts | |
| Level 2 Team | Conduct the daily health check with the goal of preventing alerts of the day |
| Analyse the logs to catch issue early | |
| App Team | Watch their own critical applications. Frequency depends on the business cycles of the application. |
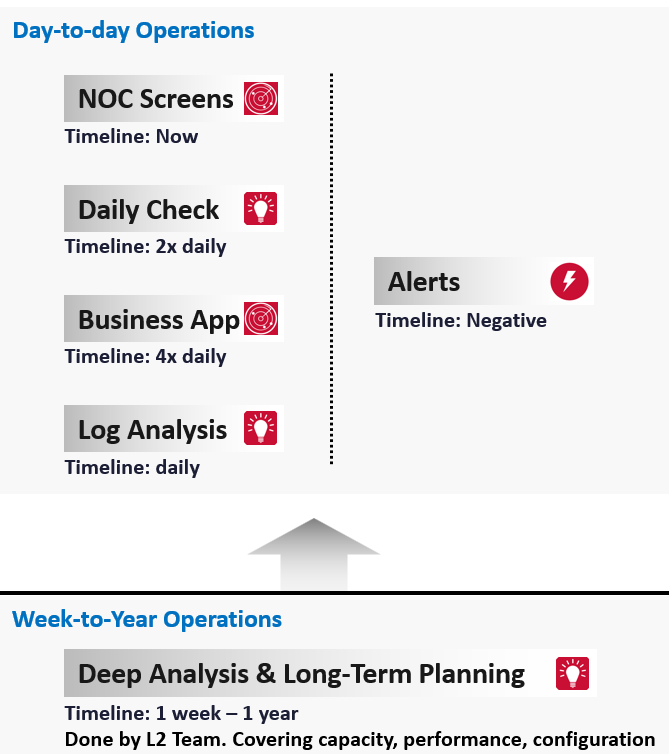
Since humans operate on a timeline (we are a 3D being living in a 4D world), let’s plot the above from a daily life perspective.
The following shows the timeline of actions taken during a 24-hour period.
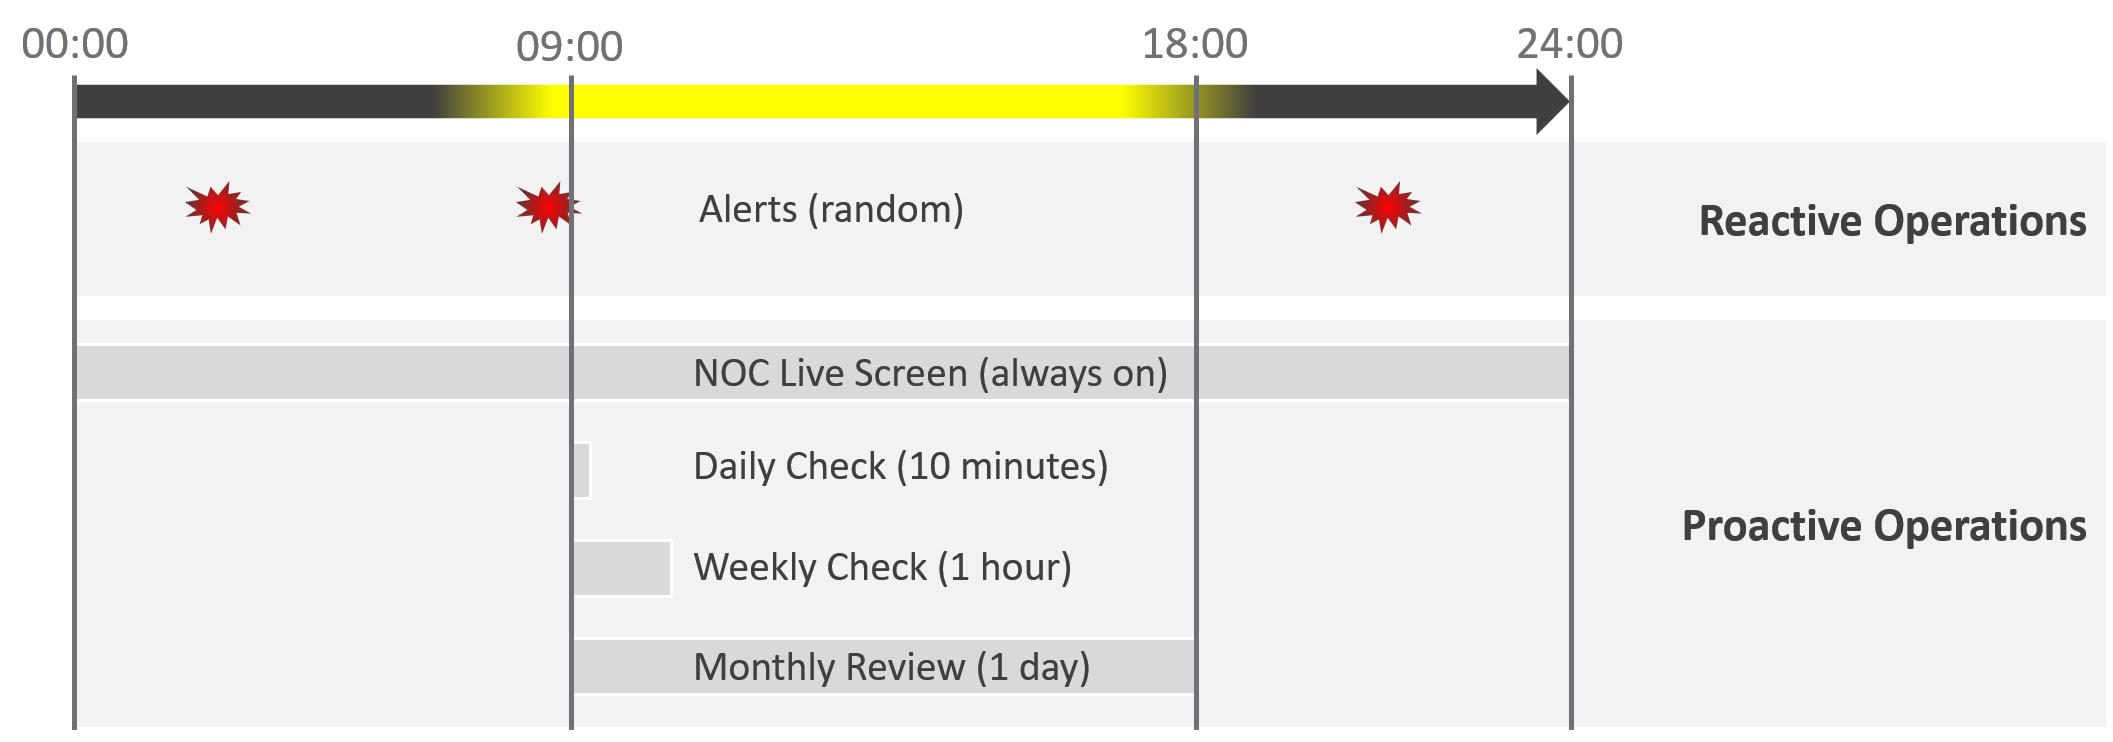
Live NOC screen and dashboard work together to realize proactive operations. You need both.
| Live Screen | They provide live, real-time, information. They are conveniently projected on the big screens for NOC Team to glance quicky. It is always available, and auto-refresh. |
|---|---|
| The NOC Room screens enable the L1 Team understands the situation better. Coupled with clear SOPs, it should result in less quantity and higher quality escalation | |
| They complement daily check well. Since you only check the dashboard in the morning, what happens to the rest of the day? | |
| Daily Check | They focus on insight, not alert. We covered both in-depth in Part 1 of the book. |
| Insight and alerts are complimentary. Open both pages side by side. |
They complement alert well. The main limitation of alert is bottom-up. It can’t show the complete picture. Alert is the tip of the iceberg.
Why do we add critical business applications in the methodology?
As covered in chapter 1, we need to begin with the end in mind. Since the purpose of IaaS is to run the applications, we need both the application team and the infrastructure team to track the critical applications. I put 2x daily as the minimum.
Proactive operations should result in less alerts, both in frequency and intensity. Volume wise, the bulk of alerts are the yellow alerts, due to their lower threshold. They can be replaced with insight, which is discovered as part of a daily proactive health check dashboard.
| Alerts | A better name for alert is guard rail. This way, the purpose is clear. It is to catch when human forgets, or system fails without warning. It is not the starting point of operations, where operators passively waiting for alerts to happen then do something. |
|---|---|
| A well-run operations have a low number of alerts. | |
The nature of alert means its use case is narrow. You do not want to run your operations based on alerts. Too many and you’re overwhelmed. Too few and you lack the early warning. This is why insight is the main driver, with alert playing secondary role. |
What’s the limitation of the above?
They focus on day-to-day operations. Both have short timeline. Maximum 1 day. If you have quarterly workload, you will not see them.
You also need a deeper and longer analysis, to implement major improvement. You do this via a set of interactive and powerful dashboards, such as the performance baseline profiling dashboard. Because you do it monthly or longer, you can afford a longer time to execute it. Use it to solve larger, more complex, and political problems.
Is there another benefit of this “out of band” operations management?
Yes. Use it to improve your daily operations itself. Both the Daily Check and the NOC Screens should help in preventing the alerts in the first place. However, you may have alerts that fall through the crack. On a weekly basis, review these alerts and improve the dashboards accordingly. Once this is repeated over a long period of time, you’re bound to catch many of the alerts and get better in preventing them.
Roles and Timelines
Human and AI agents are 3D being. We operate on a timeline. Human operators also complies to the nature of days and nights.
Different roles have different time pace. The following diagram shows only some of the roles.
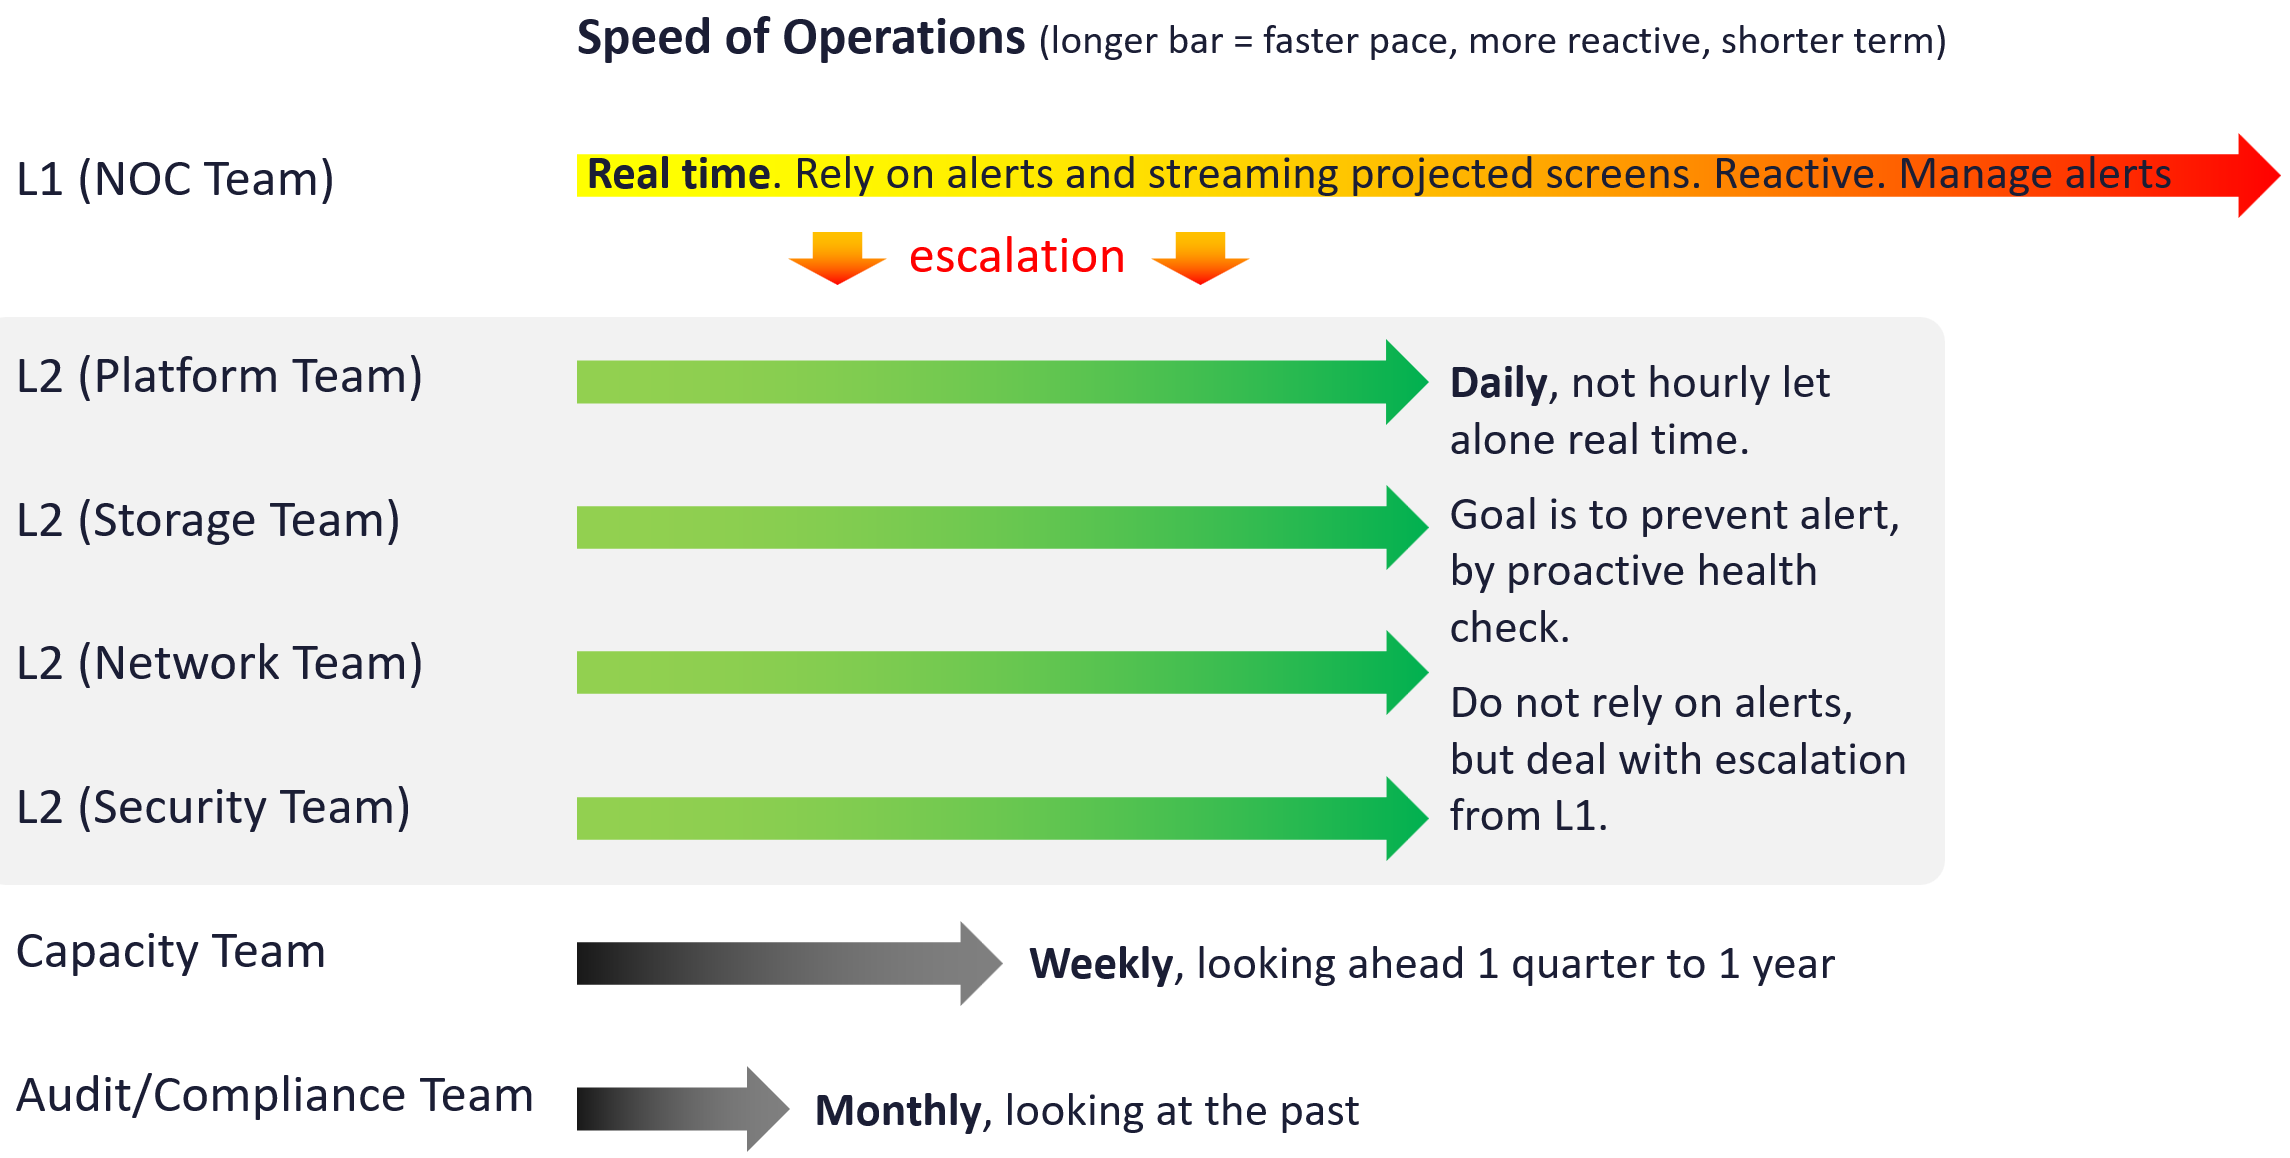
The NOC room team runs at the most pressing speed as they deal with real time situations. They are the only role watching the operations live as it unfolds. As a result, they are typically equipped with multiple large screens on the wall.
Their focus is to keep the environment healthy. Typically, they do not have the skills nor time to improve the environment. This is where the Level 2 team comes in. Unlike the generalists in Level 1, the various groups that make up Level 2 team are specialist on their own area.
These Level 2 team perform proactive check, at the start of each day. The goal is to prevent alerts firing during the day, as that would make their life easier that day.
I added Capacity team and Audit team to show examples of team that do not get involved in day-to-day operations.
Let’s now see the diagram differently. This time, we focus on the timeline as human operates along a timeline. We adhere to the natural cycles of nights and days.
As part of proactive operations, there are at least 2 cadences:
-
Daily
-
Weekly
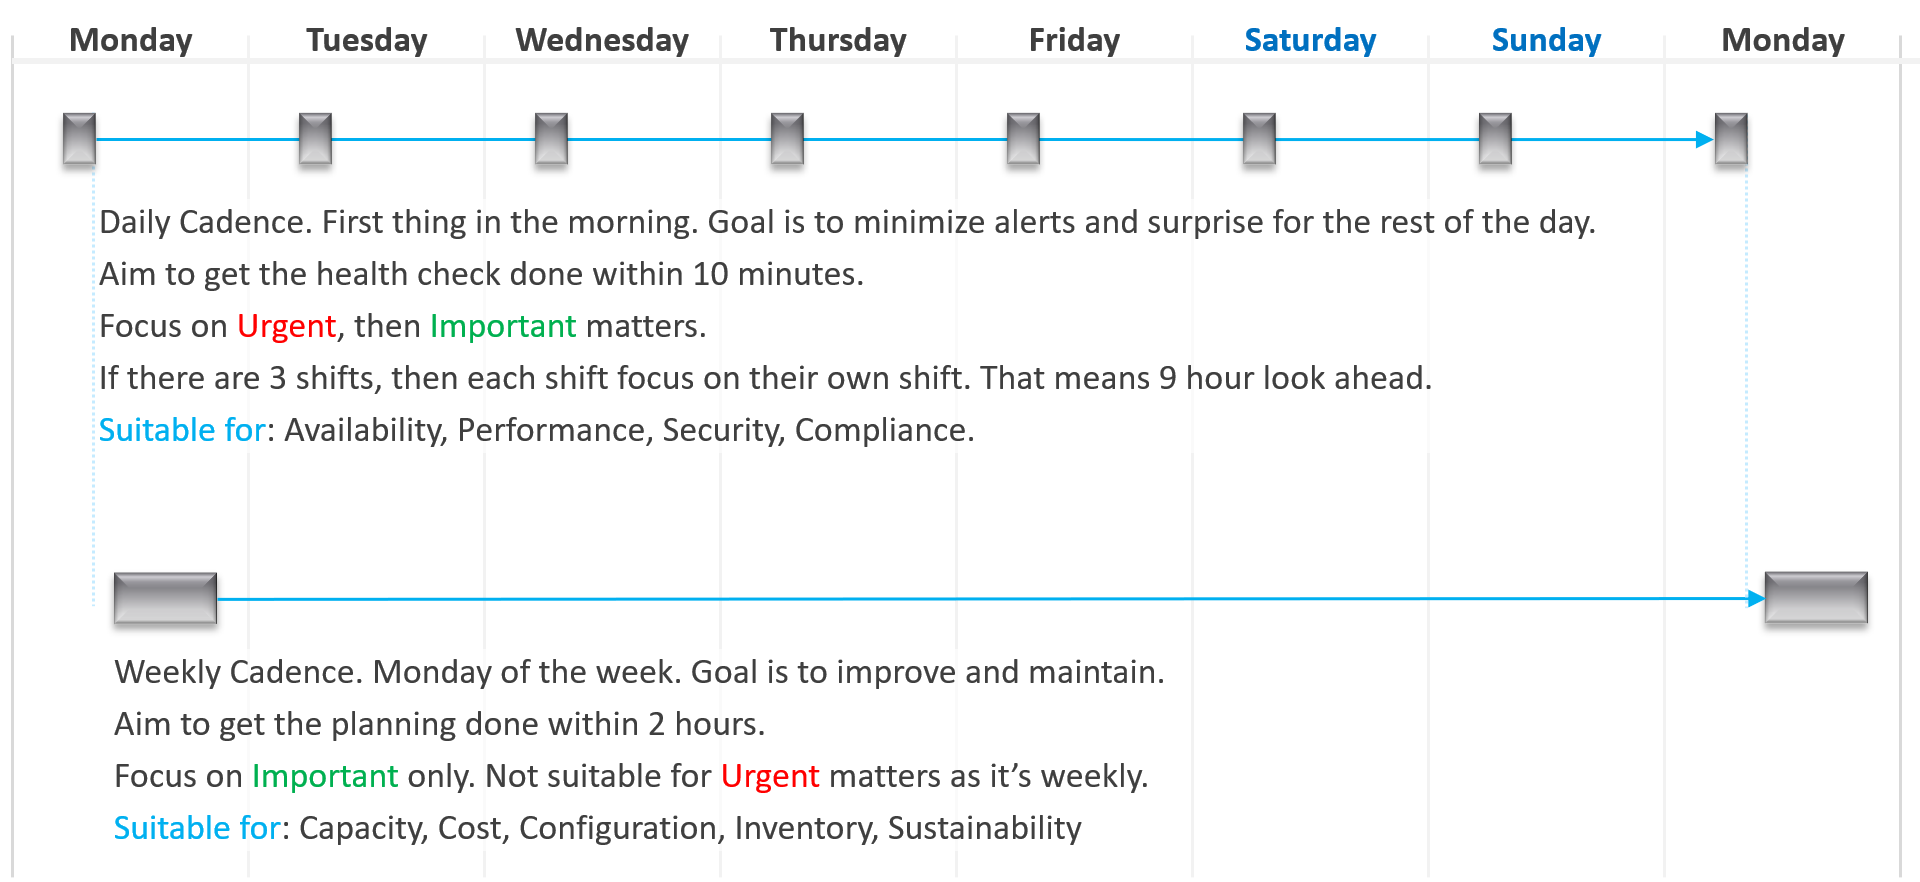
Let’s highlight the differences:
| Daily | Weekly | |
|---|---|---|
| When | First thing in the morning. Do it before you jump into the first problem. You are planning your day here. | On Mondays. After you settle with your daily cadence. Does not have to be first thing. However, you need to block longer time |
| Duration | Minutes. Aim for 5 minutes. This will allow you to do it a few times a day. | ~ 1 hour. 1 hour is probably what most administrators can practically afford. |
| Other Tools | Use the dashboard together with the Alerts home page and NOC screens. So yes, ideally you have multiple large monitors. |
Footnotes
-
There are other frameworks, such as eTOM and BIAN. Since they are domain specific, they are not suitable for VCF. ↩
-
Thanks Tyson Then for this idea. ↩