Operations Management
Operations management refers to the processes and procedures which form operational capabilities required to run the IT infrastructure and provide service to the business.
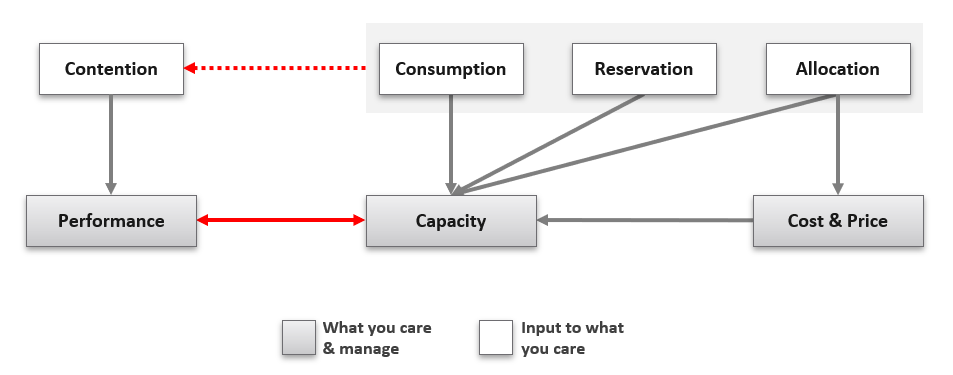
Figure 7: Key metrics impacting the core pillars of operations.
While operations management spans multiple areas, the core is based upon three fundamental pillars: performance management, capacity management, and cost management.
These pillars of performance, capacity, and cost are interrelated. As you develop and mature your operational capability in one area, it will provide benefits and solve problems in the others. These pillars are also intrinsically linked and mutually supporting: more performance requires more resources, and more resources costs more money and consumes available capacity.
We have talked in earlier sections about availability, but availability is not something you manage directly. Availability (or lack thereof) is an outcome of configuration and capacity which you manage, as well as architectural decisions, and factors you don’t control such as hardware failures.
Self-service is a key part of providing a cloud-like service to your customers, and in this context these three pillars are even more important. When we talk to Broadcom customers who are hesitant about providing self-service to their own customers, a lot of the resistance comes down to the traditional mentality that IT are the gatekeepers of the IT infrastructure and play an irreplaceable role in ensuring that end-customers don’t consume at a pace which outstrips IT’s ability to manage capacity. We agree that governance around self-service is crucial, but effective cost management solves a big part of this capacity management challenge because your internal customers will have a new barrier to overprovisioning resources: their wallets.
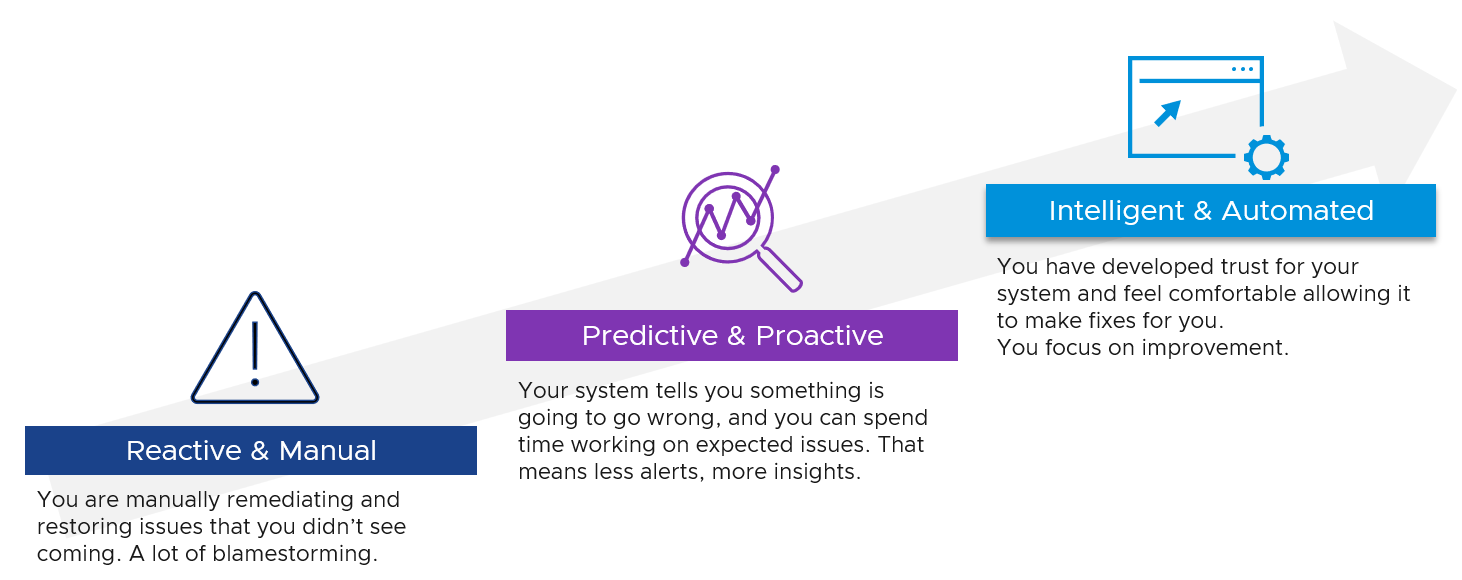 As part of building operational maturity, you’re not just developing new capabilities but also refining existing ones and moving them from reactive and manual to proactive and automated. This maturation is important to provide the benefits around efficiency of both infrastructure and people that you need to run an efficient Private Cloud.
Figure 8: Cloud operations maturity phases
Performance Management
Overview
When a customer complains that their application or workload is slow, what do they mean?
Without an objective definition of “good” performance, discussions about slowness are mired in subjective language and relative expectations. We often try to solve the problem by providing more resources and hoping the problem goes away.
Put simply, performance is about providing workloads with the necessary compute resources. In the physical world, this is ensuring a workload has enough CPU, memory, storage, and network available to satisfy workload requirements. In the virtual world, where physical resources are abstracted and shared between multiple workloads, we also need to consider contention for physical resources between multiple virtual workloads: i.e., can the workload use the resources it has been given, or are the physical resources already consumed by other workloads running on the platform?
Performance troubleshooting is a complex topic when you consider that application performance is really a combination of the performance of several layers: the application itself, the virtual machine’s OS, the virtualization layer, and the physical layer (compute, storage, networking). This does not consider multi-tier applications with Kubernetes, or issues on the end user’s side, which increase the complexity further.
These layers can be broadly grouped into two buckets: application and infrastructure.
We assume that the application owner in your business is an expert on their application (which we know isn’t always the case), and you are responsible for the infrastructure including the physical components of compute, storage, and networking, and the virtualization components of the hypervisor and VMs. We also assume the OS is not managed by the application owner/customer (as it might be in a true service provider environment) but is managed by IT as part of the service being provided.
VCF Operations contains numerous metrics, dashboards, and troubleshooting tools to help identify and troubleshoot performance problems. However, of the three operational pillars, this section on performance goes the furthest from VCF Operation’s experience because performance is the most complex and subjective pillar to manage.
We want to help you develop an objective definition of “good” performance in your environment, so you can have conversations about performance issues with your customers without having to delve into emotive and subjective territory. We also want you to be able to identify indicators of poor performance and take steps to address the problem before it becomes “a problem”.
A way to think about performance management is that good performance management results in symptoms of slowness being proactively addressed before they become an issue for the application. A proactive daily health check asks the question “is it going to rain today?” and attempts to prevent the problems in the first place.
Performance Profiling
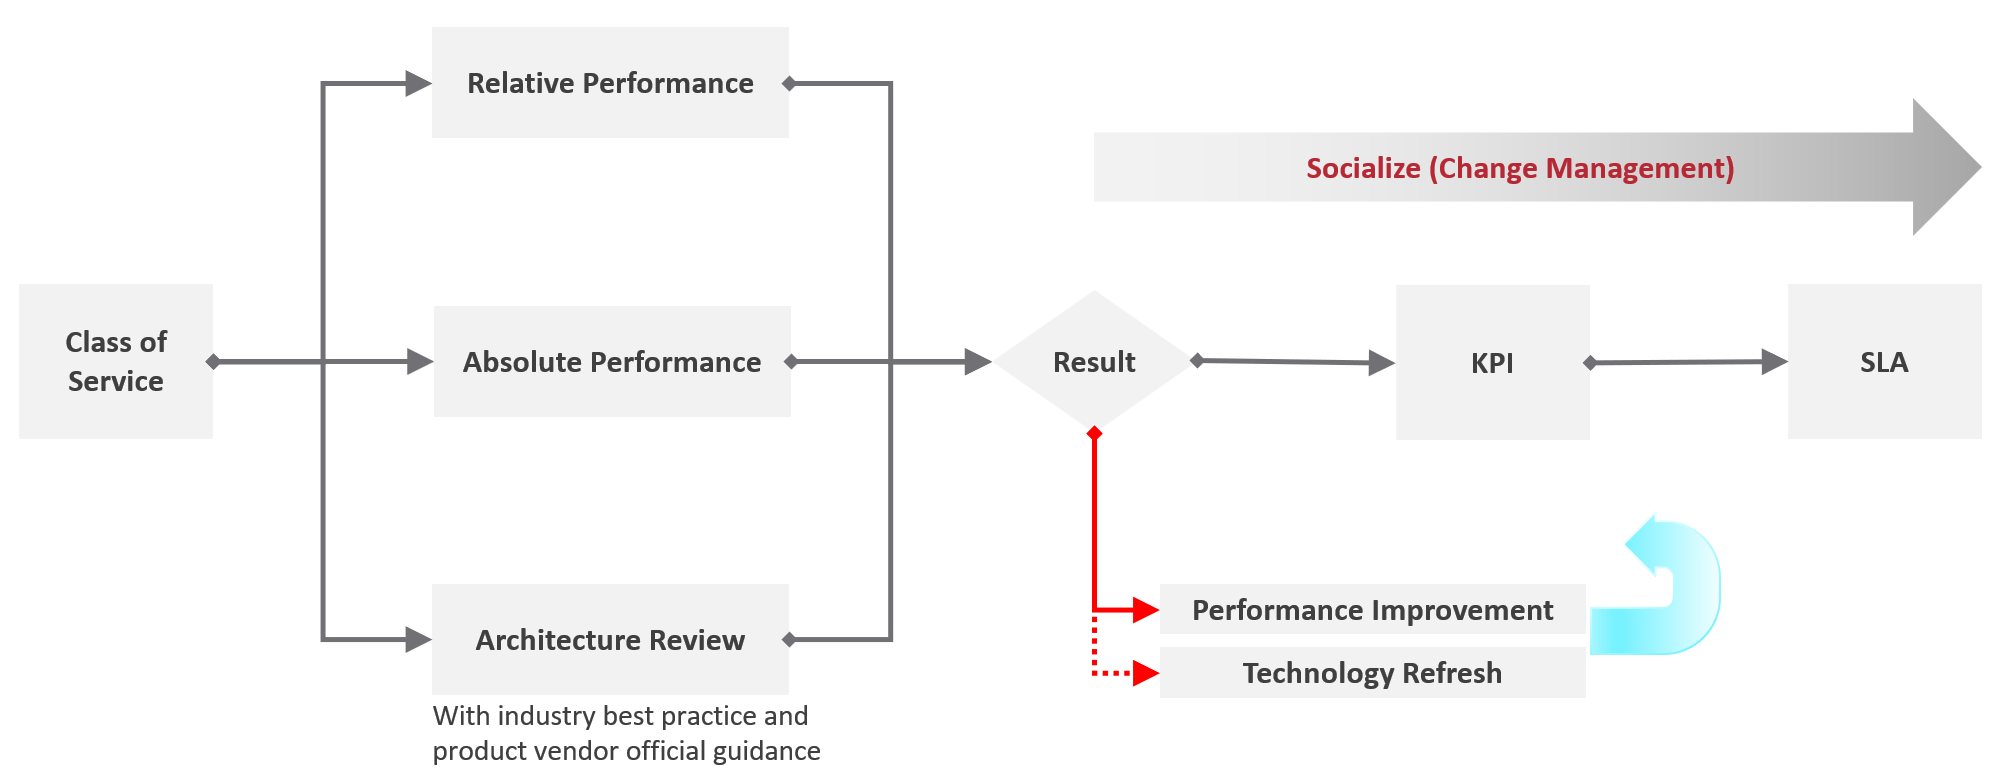
Figure 9: Performance Profiling methodology
If you want to start developing an objective definition of “good” performance in your environment, where do you start?
The obvious answer might be to interview every application owner and asking them what performance their application needs. This “obvious” approach has a few problems:
-
Firstly, the effort involved scales with the number of applications you have, and it won’t take long for the effort involved to become prohibitive.
-
Secondly, there’s no guarantee that the application owner a) knows the answer, and b) can put it into terms that are relevant to performance in a virtualization environment where overcommitment may be a factor. This just creates another problem.
Another approach is to profile the performance of your existing applications. Performance profiling is about assessing current performance metrics for workloads in your environment and plotting the distribution of these metrics. This isn’t a perfect solution either – after all, current performance does not necessarily equal satisfactory performance (although hopefully it’s not far off), but this approach does scale more easily, particularly as VCF Operations includes out-of-the-box dashboards to help plot the distribution of relevant performance metrics for workloads. You can also cross-compare these metrics with complaints related to performance in your environment. If nobody is currently complaining, then you could make a reasonable assumption that current levels of performance are acceptable.
This is not a perfect solution, but it is a good starting point to start building from.
VCF Operations comes with a dashboard called “vSphere Performance Profiling” which is particularly useful for this. The figure below gives you an idea of how the dashboard represents the distribution of values for a disk-specific performance metric for all VMs in a small test environment over the most recent 7-day period. The values used by this dashboard are the 20-second peak values for the 99th percentile of workloads in your environment.
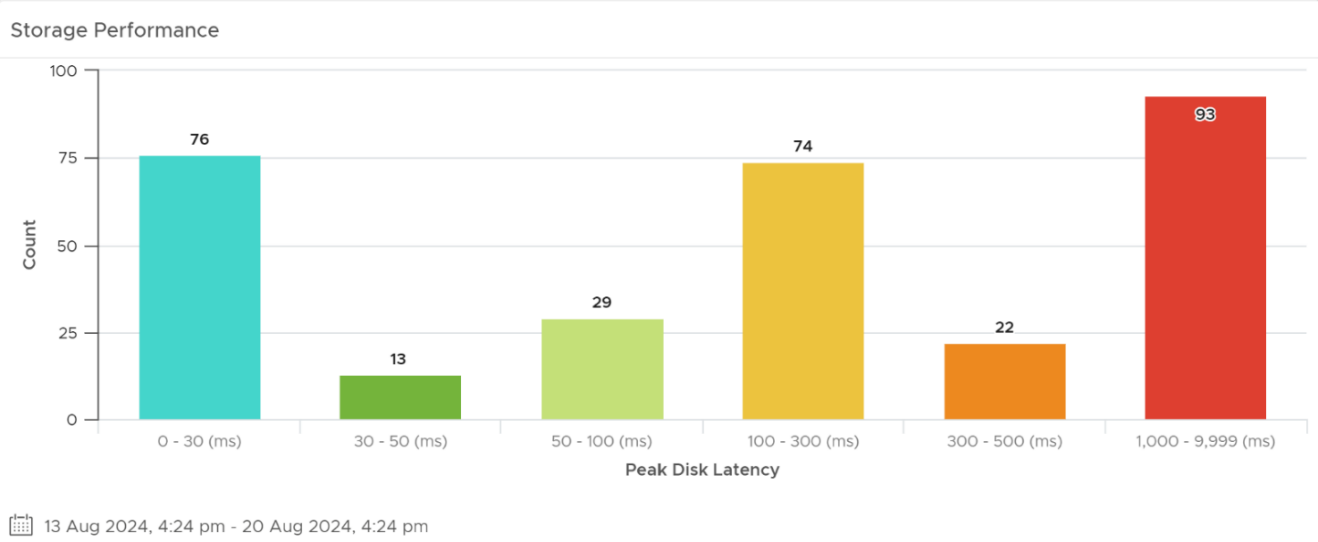
Figure 10: Performance profiling – performance distribution
The dashboard also summarizes the values of relevant metrics averaged across all VMs, and the worst value for each metric in the environment.
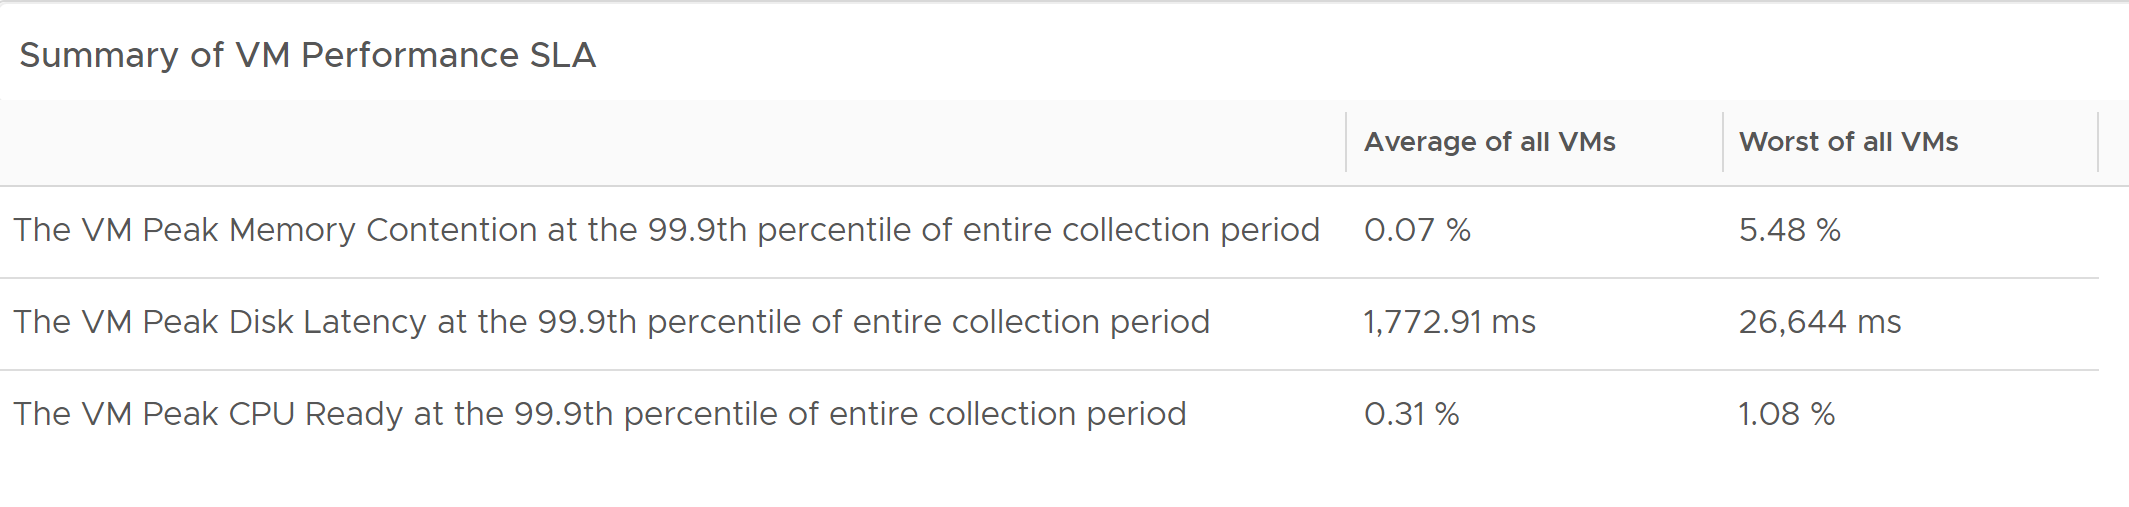
Figure 11: Performance profiling – Summary of VM performance SLA
This dashboard gives you great insight into how your workloads are currently performing. When compared against complaints about performance in your environment, it should give you a reasonable starting point for a creating the definition of “good” performance in your environment.
Once you’ve done a bit of work to understand and document this definition, you have the opportunity to begin proactively managing performance towards what is good, rather than simply reacting to complaints to fix performance away from what’s bad.
Key Performance Indicators
With SLAs in place, we need a way to stay on top of VM performance and availability so that we can identify and respond to problems proactively. This an important – in fact, mandatory - part of transitioning away from complaint-based operations. Passively waiting for an alert or complaint to trigger the troubleshooting process is not proactive, and it means the problem has already been noticed by the owner. Having internal thresholds that are more stringent than the external, formally agreed SLA is an effective way to drive proactivity. This is the primary benefit of Key Performance Indicators (KPIs): providing a real-time “score” of the workload’s performance experience derived by summarizing and consolidating several separate but equally relevant metrics.
Where SLAs are somewhat binary (regardless of the contents of the SLA, you either meet the SLA or you don’t), KPIs can be graduated with color-coding to help prioritization. KPIs can also be tracked more frequently (we recommend 20-second intervals) and reflect real-time values rather than providing a rolling summary.
A secondary benefit of KPIs is they effectively summarize multiple metrics, each of which provides valuable indicators of performance, into a single number or score, which makes them simple to understand and use.
We build KPIs within VCF Operations that allow us to track performance at the workload (VM) level, and at the cluster level. For both workload-level and cluster-level KPIs, we look at multiple metrics across the different compute resource types (CPU, memory, storage, and network). These metrics provide a score in the form of a single percentage for each VM and cluster that highlights as a single number the performance “health” of each object. The score is represented via a color-coded traffic-light system. Importantly, while the score is a percentage from 0-100%, 0% does not represent the worst possible performance. 0% indicates the worst performance that you can tolerate, i.e. the threshold at which you breech your SLA.
So, the aim of KPIs is to take the numerous metrics which are key indicators of the performance experience of a workload or cluster, to condense these metrics into a single number which considers weighting to highlight performance problems, and to color code them to facilitate proactivity by your operations team.
When a performance problem is identified, operations teams should revert to their existing knowledgebase and processes to perform focused troubleshooting of the problem. VCF Operations provides numerous metrics, dashboards, and capabilities that can assist operational teams with troubleshooting performance problems, identifying anomalous behavior, correlating behavior across multiple workloads or layers of the stack, and performing root cause analysis and remediation. It is assumed that performance troubleshooting is already a capability within your operations teams, and as such this is not an area of the product that this whitepaper attempts to address. As always, VMware Professional Services can be engaged to help uplift your operations teams in these areas.
Performance Metrics
We will however provide a quick commentary on the metrics which we feel are most relevant to performance. To make sense of performance, it’s crucial to have a good understanding of performance metrics.
There are multiple types of metrics within the virtualization layer of VCF. There are many metrics for the raw resources: CPU, memory, storage, and networking. You may also have other types of metrics relevant to your environment, such as GPU-specific metrics and vmotion metrics. For each of these areas, there are metrics for different layers of the infrastructure. As an example, for storage, there are metrics for the datastores, for the storage controllers or HBAs in your servers, and for the virtual disks and the virtual storage controllers in your VMs. There are also metrics within storage arrays that VCF Operations may not have access to out-of-the-box. Depending on your hardware choices, these metrics may be collectable via management packs for VCF Operations.
These metrics, broadly speaking, resolve into two primary categories: consumption, and contention. Consumption metrics, as the name implies, are focused on showing how much something is being utilized. For example, what is the utilization of my physical, or virtual, CPU? CPU utilization metrics can show us values in both relative (percentage) or discreet (MHz) values.
Contention metrics, on the other hand, are focused on illuminating the penalties or overheads incurred for sharing (or oversharing) virtualized resources. For example, how much time do a VM’s virtual CPUs want to run, but cannot because the physical CPUs are already used by other VMs?
The built-in performance dashboards within VCF Operations will use both kinds of metrics, but the contention metrics are more heavily used because they are a better indicator of performance than utilization metrics. This is why VCF Operations uses these metrics as part of its SLA Leading Indicator.
Outcomes
Good performance management is absolutely crucial for ensuring your applications are serving the needs of the business. It conveys numerous benefits, not just purely in the context of performance, but also across the pillars of capacity and cost.
Performance management helps you build an objective definition of good performance. “Good” performance may not be the best possible performance, but it is performance that is good enough to allow applications to serve the business. Having this definition is so important for avoiding subjective arguments with application owners about where a problem lies or what the problem is.
Performance management helps your teams to manage performance proactively rather than waiting for complaints, aka complaint-based operations. Armed with the definition of good performance, you can track actual performance and remediate performance degradations before they become a problem. For applications which report problems while still within the thresholds of “good” performance, tiered performance levels can be useful to allow customers to pay more for better performance. This needs to be approached as part of a maturity journey.
Understanding good performance, and proactively managing changes in performance, allows you to drive efficiency within the private cloud. Efficiency is about maximizing utilization while maintaining good performance. The reality of driving utilization is that it will have some impact on performance. We would never say that metrics for workloads will never show reduced levels of performance as utilization increases. It just means that reduction in performance is still within acceptable levels. Driving utilization is key for driving efficiency and cost-effectiveness.
Performance management helps with right-sizing, which crosses all three pillars. End users will often resist initiatives by the operations/infrastructure teams to right-size workloads, partially because they don’t want performance to be “affected” or reduced. In reality, performance metrics will almost certainly change as a result of right-sizing. Performance management helps you to demonstrate that the change in performance is not a problem, or, if it actually is a problem, to identify the issue and remediate rather than waste time in blame cycles. Right-sizing is an important part of optimizing your private cloud for efficiency, and is discussed more in the next section on Capacity Management.
Capacity Management
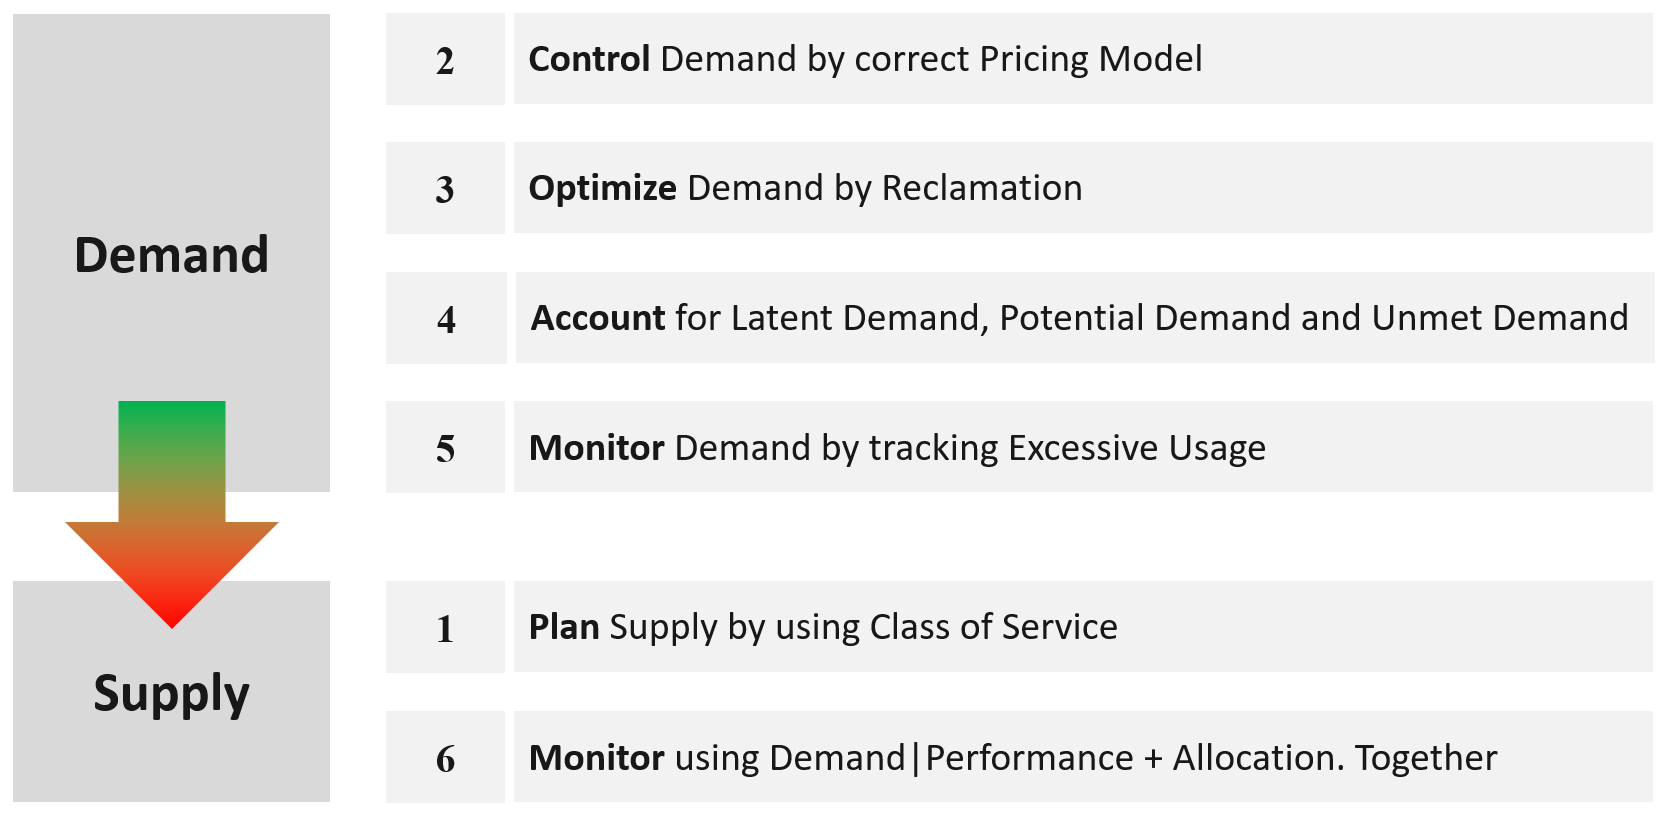
Figure 12: Overview of VCF Capacity Management
Capacity management is about ensuring that the private cloud can always meet the resource demands of its customers while minimizing cost. Capacity has a close relationship to performance, since as an environment runs out of capacity, contention for compute resources increases and performance suffers. Capacity management is particularly crucial when customers can consume capacity on-demand through self-service provisioning of new workloads and applications.
Capacity Model
Simplistically, capacity management involves determining how much of the underlying physical resources have been consumed by workloads and subtracting that from the total amount available, the result being capacity which remains free for consumption.
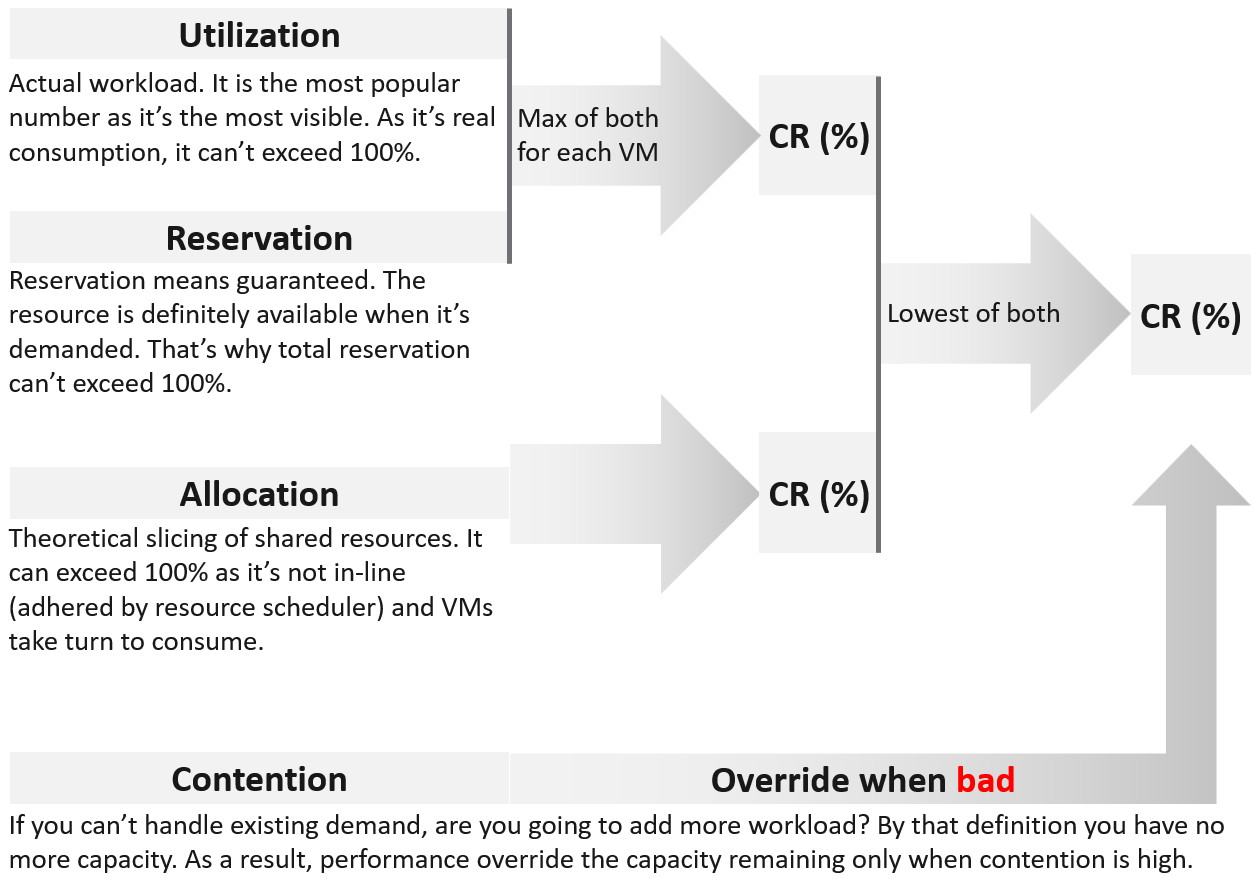
Figure 13: The 4 inputs to capacity model
VCF Operation’s capacity analytics engine supports two methods for calculating capacity. The first is the demand method. The demand model calculates the demand for resources in the cluster to determine the amount of capacity required to run the workloads. Demand is actual utilization plus unmet utilization (due to resource contention). This means the Demand method takes into account how many resources workloads are actually using, as well as how much they want to use but can’t due to capacity limitations. This provides an accurate picture of capacity within the environment. Because of this, the demand method is the default capacity management method in VCF Operations and is always enabled.
The second capacity method is the allocation method. The allocation method is a more traditional method of capacity management where, for example, you might define a virtual CPU (vCPU) consolidation ratio of 4:1. If you have 100 physical CPU cores in a cluster, then under this model you will be able to run up to 400 vCPUs worth of workloads. The weakness of this model is that resource allocation has little relationship with resource consumption: whether 4:1 will provide good performance depends on how much each workload is actually using its CPUs. A good justification for the usage of this model is for environments where the demand is not high yet you need to declare capacity as full. A prime example is a mission critical environment. For these reasons, the allocation method is not enabled by default and will need to be enabled and configured if you want to use it.
Regardless of the method used, the capacity engine in VCF Operations will calculate historical capacity utilization and forecast a projected utilization that accounts for historical growth. The capacity engine also accounts for factors like overheads and resource reservations when calculating utilization and growth.
VCF Operations does several things with the calculations provided by the capacity engine to help you manage capacity in your Private Cloud.
It provides out-of-the-box dashboards for both the capacity remaining in the environment, and the time remaining until capacity is exhausted based on the growth trends. Aggressive and conservative configurations are available to configure whether the projection used for calculations is based on a mean or an upper bound. If both the demand and allocation methods are enabled in VCF Operations, the capacity remaining and time remaining of your clusters will be calculated based on which method results in capacity exhaustion first.
In terms of capacity remaining, VCF Operations will track current capacity for CPU, Memory, and Disk space, based on demand (and allocation, if enabled).
It will trigger alerts for both capacity and time remaining and allows you to factor in a configurable lead-times for provisioning new capacity, so that if it takes you 2 months to order provision new hardware, the capacity alert will trigger 2 months early.
VCF Operations will also provide recommendations for how to deal with capacity situations, both in terms of adding new capacity (broken down by compute resource type), and in terms of reclaiming unused capacity, such as powered off or idle VMs, snapshots, and orphaned disk objects. Reclamation is covered in more detail in the section Optimizing & Reclaiming resources below.
Capacity Planning
VCF Operations enables capacity planning through the use of what-if analysis scenarios. What-if analysis allows you to simulate the addition and removal of hosts or workloads and project the capacity impact of that activity.
Both options support configuration of start dates for the change to be made, as the capacity engine supports forecasting for one year from the current date. Both options also allow for configuration of end dates to forecast changes in capacity that is temporary.
Once a scenario for what-if analysis has been completed, the scenario can be committed. Committing a scenario allows VCF Operation’s capacity engine to factor the planned change in capacity into its long-term capacity planning forecasts for the environment.
Optimizing & Reclaiming Resources
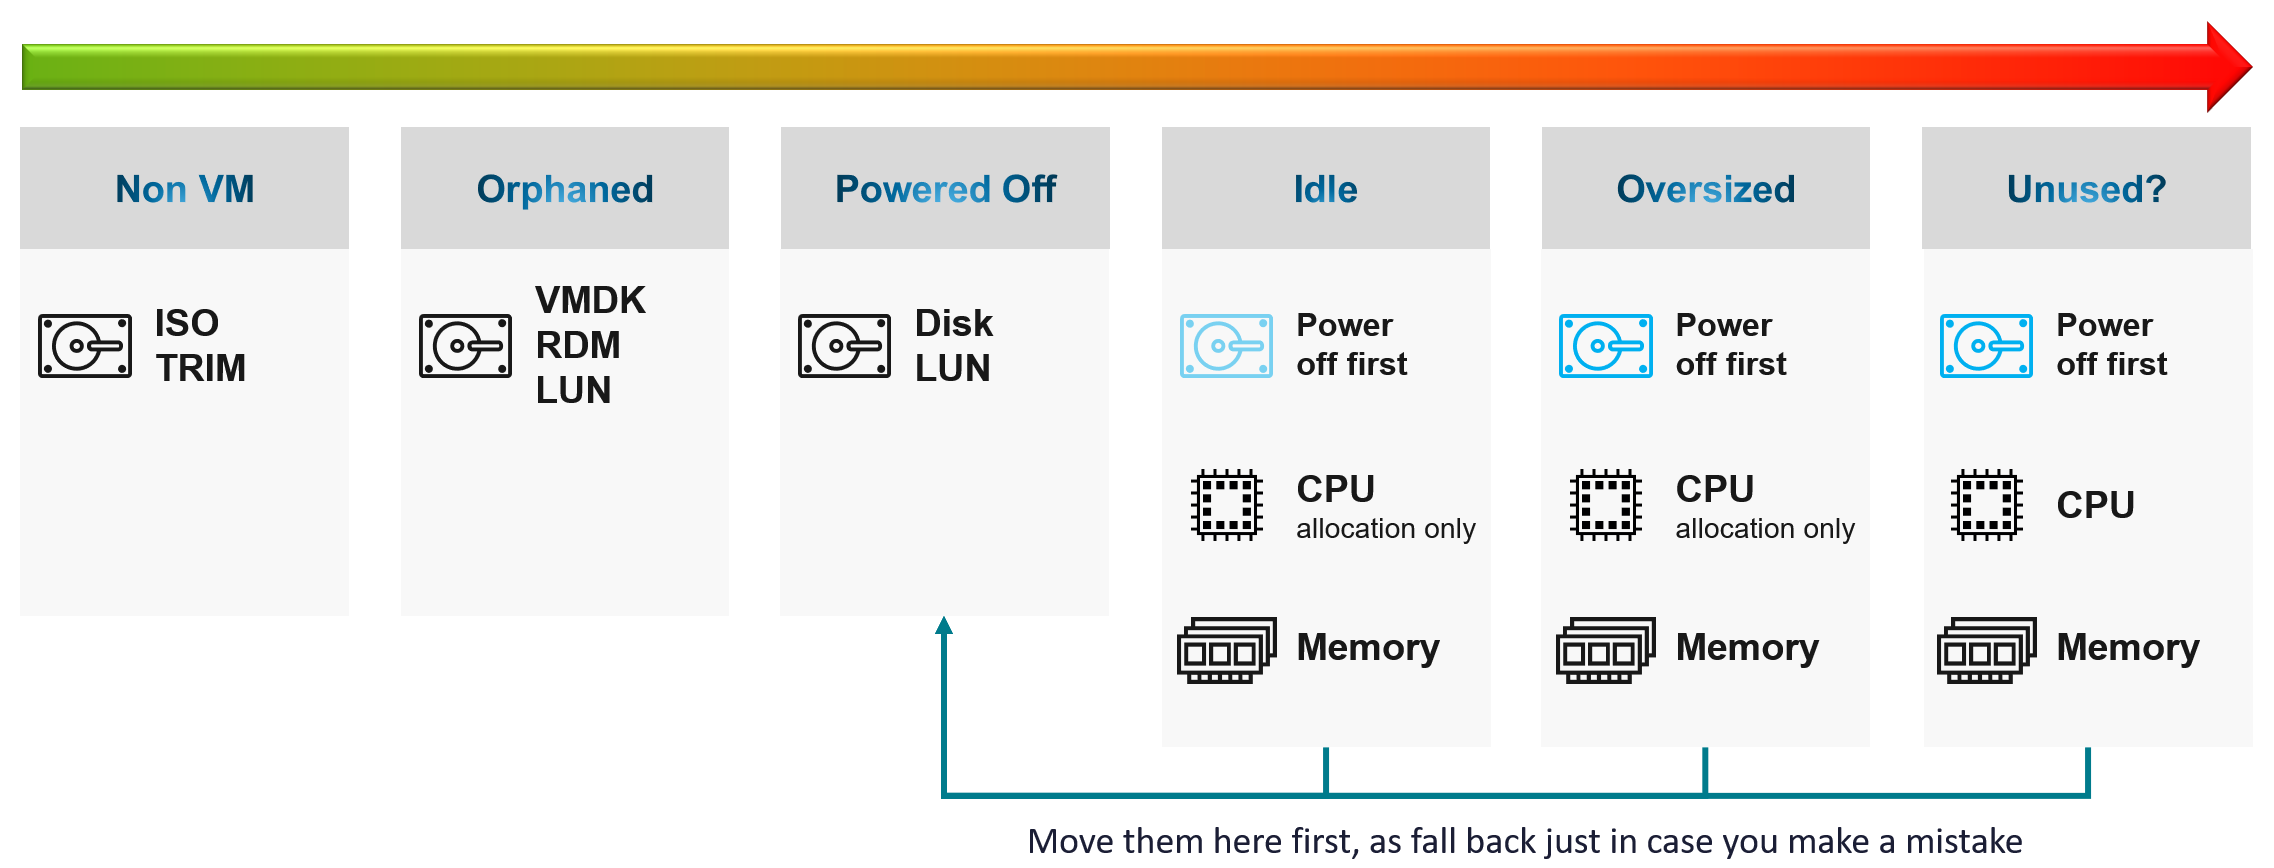
Figure 14: Reclamation Overview
VCF Operations provides recommendations on how you can save resources, and therefore increase available capacity, through right-sizing workloads and reclaiming resources.
Right-sizing recommendations are provided for both oversized VMs, which can be downsized, and undersized VMs, which can be upsized. These recommendations are based on metrics which give an insight into the demand for resources that workloads are making, and are focused on adjusting the resources allocated to workloads to match the workload requirements. The goal of right-sizing is to drive efficient use of resources within your environment, and potentially to reduce cost (depending on whether recommendations are to downsize or upsize workloads – with downsizing being by far the most common in customer environments we see). Right-sizing also benefits performance, in a way that should be obvious for upsized VMs (which are resource constrained), and also for downsized VMs because over-sized VMs increase the likelihood of resource contention across an environment and reduces overall efficiency.
With oversized and undersized VMs, the recommended CPU or memory sizing is listed and compared to the currently allocated CPU and memory. For oversized VMs, the capacity engine is conservative and will never recommend a reduction larger than 50% of an allocated resource. This may mean it takes multiple rounds of down-sizing to achieve a right-sized workload, based on the default recommendations.
Reclaimable resources are listed in terms of amounts of resources – CPU, memory, and disk – suitable for reclamation. This reclamation comes from VMs which are powered off, detected as idle (determined by utilization metrics) over a period of time, VMs which have old snapshots consuming storage, and orphaned disks (which are not connected to any registered VMs).
Implementing right-sizing (or reclamation) recommendations can be acted upon at the point in time, or via a scheduled action to align with maintenance windows. This makes it simple to action the recommendations to optimize workloads in your environment.
If you have cost drivers configured (see the next section for more details), VCF Operations will also provide cost savings associated with implementing the recommended optimization via right-sizing and reclamation.
Outcomes
Capacity management is about driving efficient resource utilization and cost effectiveness within a private cloud. Capacity has a direct relationship to performance – performance issues are often caused by a lack of capacity. And performance and capacity are inexorably linked to cost. So, by implementing effective capacity management, you confer benefits to both performance and cost.
Capacity management ensures that your operations teams understand how much capacity is currently consumed, how much is still available, and when capacity will be exhausted within the private cloud. It enables them to plan for changes in capacity caused by future workload demands, such as an upcoming application deployment or migration project. And it gives them the ability to project changes in capacity caused by adding or removing hosts to account for the changes in workload demand.
VCF Operations provides out-of-the-box recommendations for workload optimization which can reduce resource consumption and contention, benefiting performance and cost.
Capacity management is crucial for ensuring performance SLAs are met. Very often, performance issues are caused by resource contention caused by exhausted capacity. Attempting to provide performance SLAs and proactively monitoring and managing workload performance without capacity management is setting yourself up for failure.
In environments with self-service consumption - which as discussed earlier is an important part of providing a private cloud - good capacity management is crucial for ensuring that customers can continue to provision without impacting the performance of their or other’s workloads. This is especially true in environments that have historically relied on IT to server as a gatekeeper for provisioning to maintain governance around capacity.
Cost & Price Management
Overview
Cost management is about measuring and managing two adjacent properties: cost, and price. VCF Operations allows you to measure both. It provides dashboards for tracking and calculating for both scenarios but does not actually provide a financial billing mechanism.
Cost vs Price
Cost vs price can be a confusing topic to discuss because in everyday life the terms are often synonymous and interchangeable. The meaning of these terms can be dependent upon the persona or perspective. As a customer, you might think of price as the cost you pay. From the perspective of a business, on the other hand, cost is what it costs you to provide the product or service, and price is what you charge the customer. As the tool for managing the operations of your private cloud, VCF Operations uses the perspective of your operations teams, so these terms should be understood from that perspective. Simply, cost is the cost of running your infrastructure, allocated across running workloads. Price is the amount you charge customers for each workload, which may be different to the cost.
Throughout this whitepaper, care will be taken to use these terms in the same way.
Cost
Cost refers to the capital and operational expenditure associated with running your infrastructure. Within VCF Operations, you configure cost drivers for your infrastructure & operational components, such as your server hardware, storage, network, OS licenses, maintenance, labor, facilities, and additional costs & overheads. These cost drivers are used to calculate the overall costs for running your infrastructure. These costs are then broken down per data center and per cluster. Cost drivers can also be allocated into per-workload costs which are based on the resource sizing of the workload, and can vary depending on what infrastructure the workload is running on.
VCF Operations also allows for configuration of hardware depreciation over a term of 2-5 years using straight line or max of double or straight models. Straight line provides linear depreciation over the term, whereas max of double or straight front-loads the depreciation in the early years of the term.
VCF Operations also comes out-of-the-box with cost drivers based on industry reference figures. These can be used as a starting point, but ideally your cost calculations should be as accurate as possible, so there is always value in ensuring that cost drivers are tailored to the specifics of your business and infrastructure.
Price
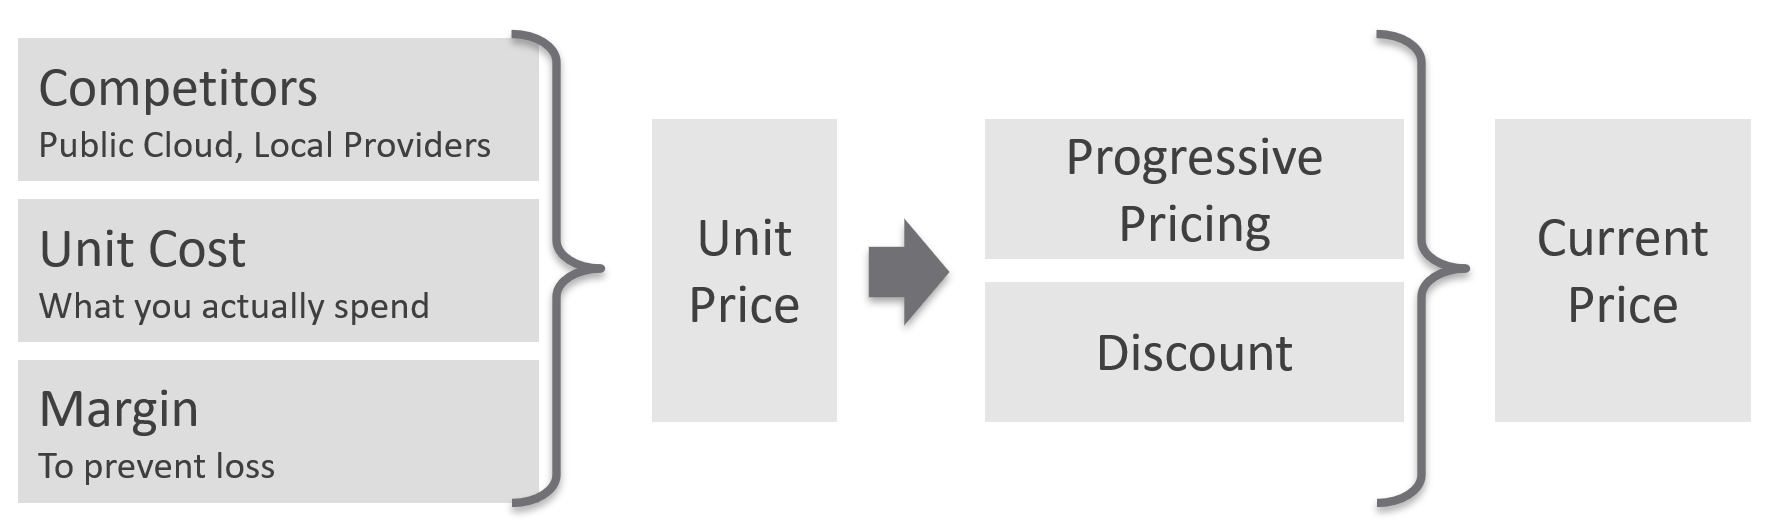
Figure 15: Pricing methodology
“Price” is a per-workload value and should be thought of as the amount you want to charge to the workload. The price could simply be based on the allocated cost of running a standard workload, as described above. However, the price might also be independent of the cost, where the delta between the two could be considered profit or loss on a per-workload basis.
You could set price to be contestable with a competing cloud solution, regardless of profit or loss, or you could set price be cost-neutral or to take profit. This is a decision that will differ from customer to customer based on factors that are well outside the scope of this whitepaper.
Outcomes
Effective cost management provides significant benefits, both purely in financial terms but also across the other operational realms of performance and capacity. These three operational capabilities are mutually supporting, and cost management is the lynchpin that creates this synergy.
VCF Operations comes out-of-the-box with dashboards to provide insights into Total Cost of Ownership (TCO) and Return on investment (ROI) of your infrastructure. It can identify potential savings based on factors such as oversized, idle, or powered-off workloads, and recommend steps to act on these savings. It will track the savings that were realized by acting upon these recommendations.
Cost and price also influence customer behavior. No doubt we can relate to this from our experience in everyday life. From an IT service perspective, cost management helps solve several problems for us.
Pricing model enables financial comparison across environments or entire clouds, allowing customers to choose the right place to run their workload based on price in addition to other factors - and private cloud can be very cost-competitive. Smart workload placement can save a significant amount of money for a business. This is particularly effective when customers can self-service workload deployment and see price at the time of provisioning.
Pricing model help with right-sizing. In environments without proper pricing policy, resistance to right-sizing from workload owners is a common challenge we hear. Workload owners often perceive right-sizing as IT taking back resources the customer thinks they need (and which without a billing model they effectively get for free). With the introduction of pricing model, right-sizing helps your customers save money.
Pricing model helps with the problem of customers “overprovisioning” their workloads, either in terms of provisioning more resources than needed, or demanding dedicated/reserved resources which come at significant cost. Price can influence more efficient consumption by your customers, so if a customer is willing to pay the price associated with overprovisioning their workload in a chargeback model, then it helps to fund the cost of providing the infrastructure as well as helping to qualifying the demand. Right-sizing is still relevant in this context too: providing recommendations to customers on how they can reduce their cost without impacting their service shifts from being perceived negatively to being a value-add. This is exactly how public cloud providers position themselves.
Chargeback also help solve problems with idle workloads – workloads that are left running but are not really needed. In an environment where customers have self-service, this is an effective way (other than applying leases to provisioned workloads) to control workload sprawl.
Lastly, price as a general principle can be used to incentivize customers to behave in certain ways. As one example, defining a pricing model that scale with resources at a super linear rate will incentivize users to think about what they need and consume efficiently.