Service Level Agreements
One of the key differences between a virtual infrastructure platform and a Private Cloud is the SLA. A cloud provider can state that they have the best technology, the best staff, the most innovative processes, the most industry certifications, etc., to prove that their product is the best, but none of that carries weight because it’s not contractual. If you are providing a service to your business, your SLA is the definition of what that service actually is. The SLA enables operations teams to hold themselves accountable to their customers because the SLA carries financial penalties. Once the SLA is defined, only then will customers want to know how it will be delivered. This is where those elements mentioned earlier, like processes, architecture, certifications etc., come into play.
Anatomy of an SLA
So, what’s in the SLA? The SLA, being a contractual document, will contain service definitions and descriptions that inform the customer on all sorts of details about the service. It should provide a thorough description of what the service is that your customers are receiving from you. As an example, the SLA for a VM within a Private Cloud service may contain description of the VM, it’s resource size and hardware capabilities, as well as details about backups, disaster recovery, patching schedules and maintenance windows, and other features and capabilities that your business has decided a virtual machine (VM) running within its organizational boundary must have.
Much of this content will be specific to your business and the service that you have designed.
An SLA also contains another fundamental piece: the Service Level Objective.
Service Level Objective
An SLA must contain one or more thresholds that defines the “service level” that is implied by the name. This is called the Service Level Objective (SLO). Likely the most common SLO in the world of IT measures Availability and is often expressed as a percentage (99.99%), or in a number of “nines”, e.g. “four nines” (99.99%) or “five nines” (99.999%).
Whatever measurement you are providing as the SLO, it should be black and white: your service either achieves it, or it doesn’t. There should not be room for subjectivity or interpretation.
How many SLAs do you need?
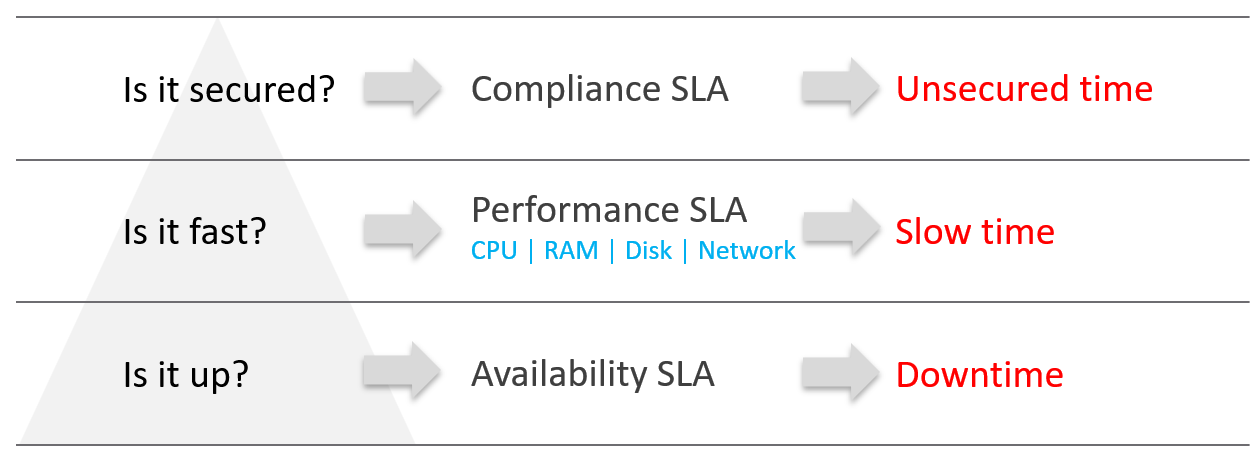
Figure 2: The 3 types of SLA in VM as a Service
Many service providers will only commit to the most obvious one: the Availability SLA. This may seem the simplest SLA to track and manage because it’s binary: the service is either up, or it’s down. In reality, Availability can be deceptively complicated depending on where and how you need to measure it, but this will be discussed more in section later in this chapter about Availability SLAs.
But just because something is “up” doesn’t mean it’s “fast”, and a service that’s slow to the point of being unusable may as well be down.
In a Private Cloud, there should be at least two SLAs: one for Availability, and one for Performance. The Availability SLA measures “downtime”. The Performance SLA measures “slow time”.
You could also consider an SLA for compliance. VCF Operations helps to track compliance of an environment against a number of predefined compliance baselines. We think the value of a compliance SLA, if one exists, should be 100%. In terms of Availability, or Performance, we know 100% is not realistic because they affected by factors like platform cost and efficiency. With compliance, however, we don’t believe there is any cost or efficiency justification for not keeping on top of compliance. We will not devote further time in this whitepaper to the subject of a compliance SLA, but this is an area that may be expanded upon and refined in future.
Measuring SLAs
SLAs should be measured over a monthly period. A monthly period for SLAs is industry standard, and allows for easier comparison against benchmarks and peers. Be aware also that a shorter (or longer) period of measurement can have a significant effect on the duration you have to fix a problem before the SLA is breeched.
SLA Leading Indicators
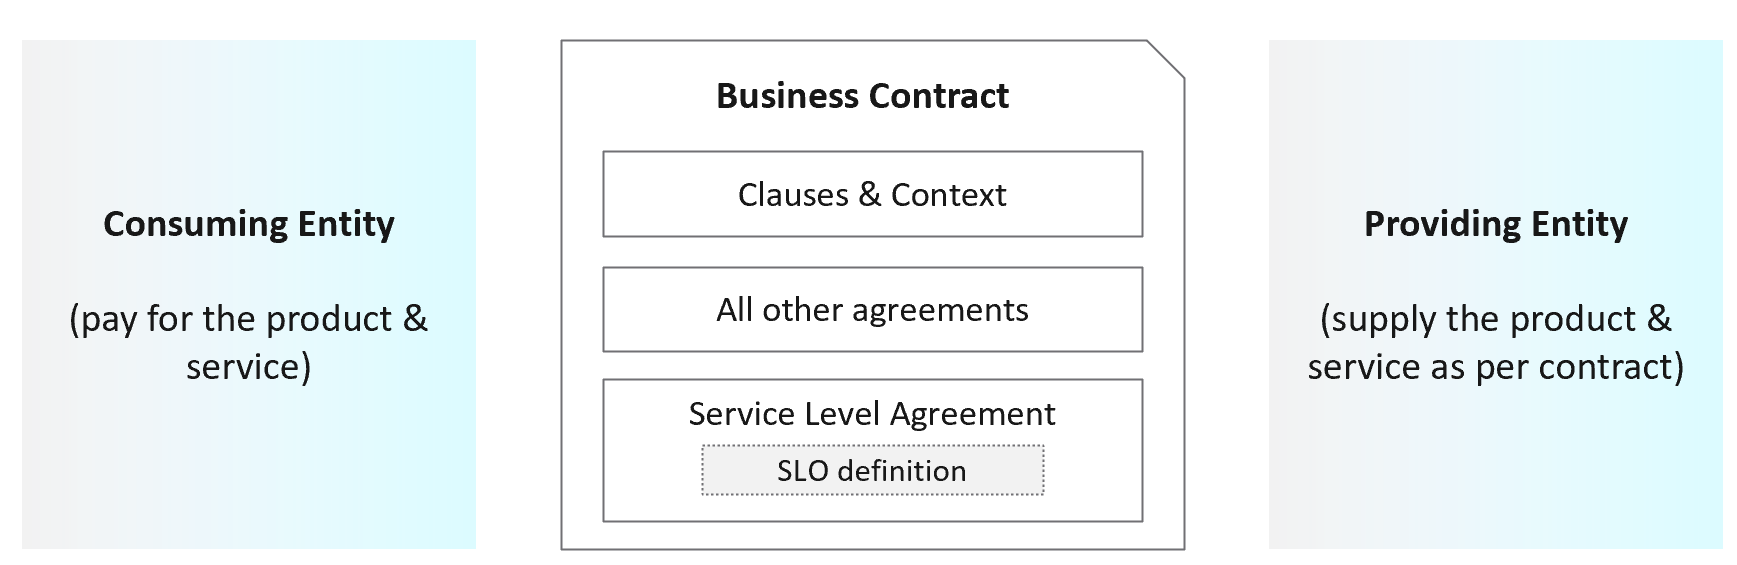
Figure 3: How SLA is derived from SLI
Adjacent to the SLO is the SLA Leading Indicator (SLI). Where the SLO (and thereby, the SLA) shows the customer the promise you are making, the SLI shows you the reality of how your platform is actually performing. It is a leading indicator of service quality because it shows you the current, real-time view of your environment. The SLA is a lagging indicator of service quality because it’s a counter of the average over the last month.
If the leading indicator is worse than the SLO, then your service runs the risk of violating its SLA. By providing insight into how the service is comparing to its SLA, it will give you an indication about whether you will meet your SLA at the end of the month.
Availability SLA
Figure 4: Availability and scheduled downtime
The Availability SLA measures downtime for a VM. As mentioned earlier, the Availability SLA may appear to be the simplest to measure because it’s binary. This depends a lot upon how and where you measure it. For example, if the only requirement in your business is that a VM is powered on, then it’s easy to measure. If you need to consider whether the network is functional, or that the guest OS is running, then it can become more complicated. You may also need to exclude scheduled changes for patching or reboots from the SLA measurement.
The majority of our customers manage the guest OS for their internal customers as part of their VMware service, therefore we recommend measuring availability via ping packets, which verify that the OS is running and available on the network.
When setting the SLO for Availability, keep in mind that achieving high levels of availability carry architectural and cost implications. A SLO of 99.999% uptime equates to 26 seconds of downtime per month, which is likely to require factors such as hardware with more redundancy or specific architectural configurations that are not necessary to support a 99.9% SLO (which equates to 43 minutes of downtime per month).
When documenting your availability SLA, make sure that your SLO and exclusions (i.e. what events are not measured towards downtime) are clearly defined.
Performance SLA

Figure 5: Performance SLA for a VM
The performance SLA measures the performance of a VM across its four compute resources: CPU, memory, disk, and network. Performance problems in any one of these areas could cause the application to become unusably slow and cause the SLA to breech, so we need an indication of performance per-workload that is more complex than simply averaging the values of relevant performance metrics for each compute resource.
VCF Operations contains a built-in SLI metric which tracks a key metric for each of CPU, memory, Disk, and Network, on a per workload basis.
|
|
|
| Ready | 2.5% |
| Latency | 1.0% |
| Latency | 10 ms |
| Transmit Dropped Packet | 0% |
Figure 6: Breakdown of the Service Level Indicator metric in VCF Operations
This metric summarizes whether each of the metrics above is under or over threshold on a per-VM basis. On each VM, the value of the SLI metric will be between 0-4, with the number incrementing for each threshold breeched.
These values for performance are built into VCF Operations as a Service Level Indicator because we believe they are the best metrics for providing a reliable insight into VM performance.
We recommend measuring the performance SLA off these metrics. The performance SLA is a promise about the percentage of time per month that a VM’s performance will be at or under these thresholds (measured over 5-minute intervals).
One additional note: we don’t address multiple classes of service (e.g. gold, silver, bronze that have different SLAs) in this whitepaper. If you were to pursue different classes of service, we recommend that the threshold for performance above should be the same for each class. The differentiator between each class (from an SLA perspective) is the percentage of time that the VM may exceed the threshold within the 30-day period. If you instead provide class-based differentiation using different thresholds, this can result in a “better”, more expensive class receiving a lower percentage-based score than a lower class, even though the higher class’s actual performance might still be better. This is confusing and unclear for both users and operations teams.